-
Cisco IP Solution Center Traffic Engineering Management User Guide, 4.0
-
Index
-
About This Guide
-
Introduction to ISC TEM
-
Setting Up the Service
-
TE Network Discovery
-
TE Resource Management
-
Basic Tunnel Management
-
Advanced Primary Tunnel Management
-
Protection Planning
-
Traffic Admission
-
Administration
-
Task Monitoring
-
TE Topology
-
Traffic Engineering Management GUI
-
Warnings and Violations
-
Document Type Definition (DTD) File
-
 Feedback
Table Of Contents
Traffic Engineering Management GUI
Accessing Protection Management
View Managed Primary Tunnel Details
Create TE Managed Primary Tunnel SR
Edit TE SR (Primary or Backup)
Movable Tunnel Selection Window
TE Primary Tunnel Computation SR - Changes Window
TE Primary Tunnel Computation Results - Report
Create TE Backup Tunnel Window
Select TE Tunnel for Admission
Traffic Engineering Management GUI
This chapter describes the Cisco IP Solution Center Traffic Engineering Management (ISC TEM) GUI and provides an explanation of the various fields, buttons, and other GUI elements. For a detailed description of the process flows for the various ISC TEM services, see the respective chapters and sections elsewhere in this user guide.
In this chapter, the parts of the ISC GUI used by the ISC TEM component are described:
Accessing the TEM GUI
The Traffic Engineering Management GUI forms part of the general Cisco ISC GUI.
This section describes the GUI elements in the Traffic Engineering Management Services window.
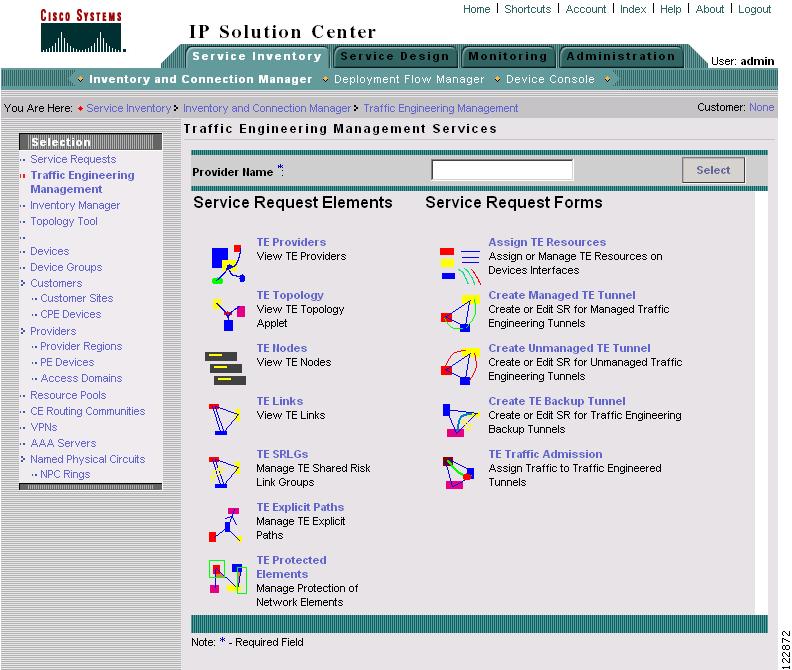
To access the TEM GUI, go to Service Inventory > Inventory and Connection Manager > Traffic Engineering Management. The Traffic Engineering Management Services window in Figure A-1 appears.
Figure A-1 Traffic Engineering Management Services
The main ISC TEM window includes the following service elements:
•
Service Request Elements
–
–
–
–
–
–
–
•
–
–
–
–
–
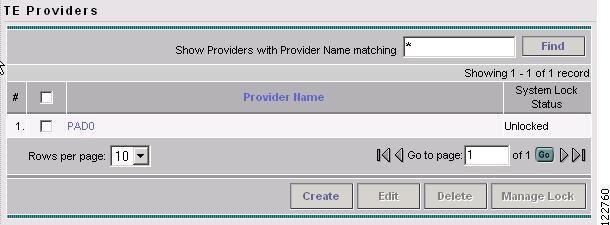
TE Providers
This section describes the GUI elements in the TE Providers tool.
To create a TE Provider, see Creating a TE Provider.
To access the TE Providers window, go to Service Inventory > Inventory and Connection Manager > Traffic Engineering Management > TE Providers. The TE Providers window in Figure A-2 appears.
Figure A-2 TE Providers
The TE Providers window contains the following fields:
•
•
The following actions can be performed:
•
•
•
•
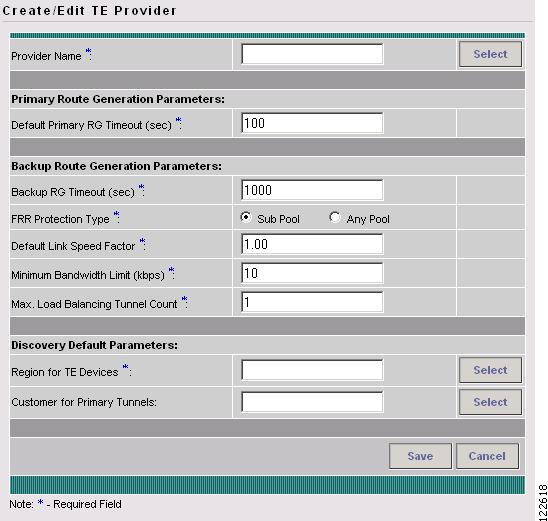
Create/Edit TE Provider
To access the Create/Edit TE Provider window, go to Service Inventory > Inventory and Connection Manager > Traffic Engineering Management > TE Providers and click Create.
The Create/Edit TE Provider window in Figure A-3 appears.
Figure A-3 Create/Edit TE Provider
The Create/Edit TE Provider window contains the following fields:
•
•
•
•
–
–
•
•
•
•
•
For step-by-step instructions on how to create or edit TE providers, go to Creating a TE Provider.
TE Topology
This section describes the various fields, buttons, and other GUI elements in the TE Topology GUI. For instructions on how to use the TE Topology tool, see Chapter 11, "TE Topology".
ISC TEM includes a TE Topology tool that is accessed as a TE Topology Interface Applet that displays the TE topology through a Java applet within the browser.
For specific instructions on how to use the topology applet, see Using the TE Topology Interface Applet, page 11-2.
Note
Topology Display
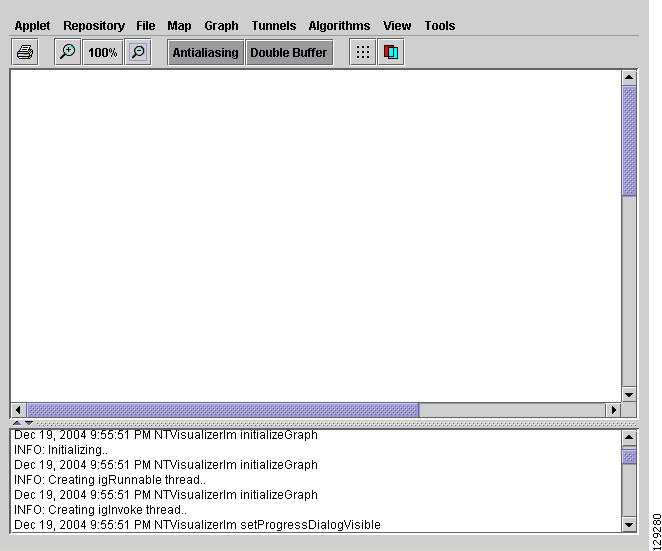
To access the TE Topology tool, go to Service Inventory > Inventory and Connection Manager > Traffic Engineering Management > TE Topology and select ISC-TEM Topology Interface Applet
The topology display appears immediately as an separate window as shown in Figure A-4.
Figure A-4 Topology Display Window
The Topology Display window contains the following menus:
•
•
•
•
•
•
•
•
The menus in the Topology Display window are described in more detail below with definitions for individual entries.
The Topology Display window toolbar contains the elements shown in Table A-1.
For instructions on how to use the Topology Display, see Using the TE Topology Interface Applet, page 11-2.
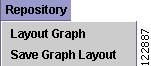
Repository
The Repository menu in Figure A-5 serves to discard or save the layout graph.
Figure A-5 Repository Menu
The Repository menu contains the following elements:
•
•
File
The File menu in Figure A-6 provides access to the print functionality.
Figure A-6 File Menu
The File menu contains the following element:
•
Map
The Map menu in Figure A-7 serves to load or clear maps.
Figure A-7 Map Menu
The Map menu contains the following elements:
•
•
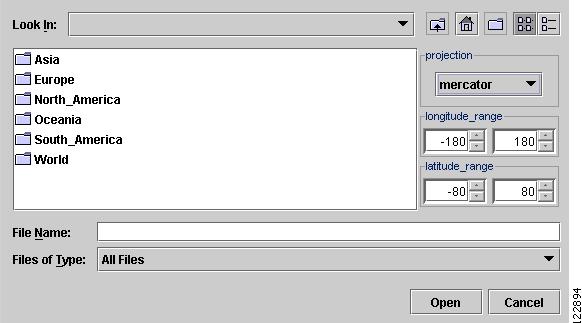
Load Map
When selecting Load from the Map menu, the Map Chooser window in Figure A-8 appears.
Figure A-8 Map Chooser
The Map Chooser window contains the following elements:
•
•
•
•
•
•
The Map Chooser window navigation toolbar contains the elements shown in Table A-2.
•
•
•
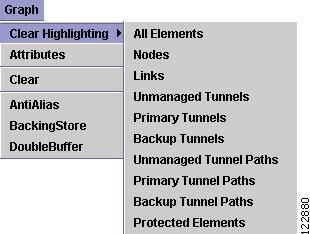
Graph
The Graph menu in Figure A-9 provides access to a range of tools to manage and manipulate graphs.
Figure A-9 Graph Menu
The Graph menu contains the following elements:
•
–
–
–
–
–
–
–
–
–
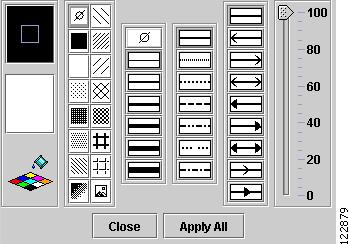
•
Figure A-10 Graphics Attributes Window
To understand the tools in the Graphics Attributes window, mouse over the various attributes. Choose the desired settings for line color, fill color and pattern, line thickness and style, arrow, and transparency.
Click Apply All to activate your selections or Close to quit the Graphics Attributes window.
•
•
•
•
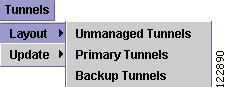
Tunnels
The Tunnels menu in Figure A-11 is used to highlight TE tunnels in the network.
Figure A-11 Tunnels Menu
The Tunnels menu contains the following elements:
•
–
–
–
Note
•
–
–
–
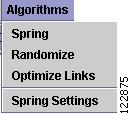
Algorithms
In the Algorithms menu in Figure A-12 various algorithms can be used to enhance and otherwise alter the graph layout.
Figure A-12 Algorithms Menu
The Algorithms menu contains the following elements:
•
•
•
•
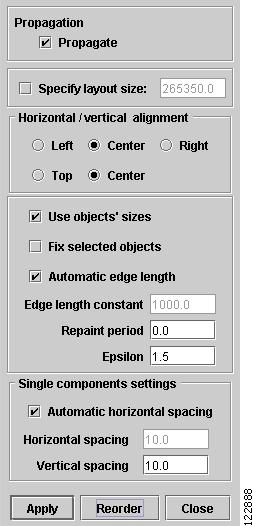
Figure A-13 Spring Settings
The Spring Settings menu contains the following elements:
•
•
•
•
•
•
•
•
•
•
•
•
Once you have made your selections, you can do any of the following:
•
•
•
View
The View menu in Figure A-14 allows zooming in the current view.
Figure A-14 View Menu
The View menu contains the following elements:
•
•
•
Tools
The Tools menu in Figure A-15 allows you to modify the magnetic grid settings and the layer visibility. Different network elements are drawn in different layers. Individual layers can be turned on or off using the Layers menu.
Figure A-15 Tools Menu
The Tools menu contains the following elements:
•
•
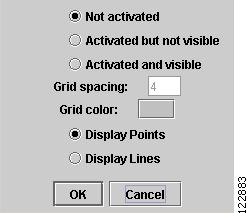
Grid
The Magnetic Grid window in Figure A-16 allows you to modify the magnetic grid settings. An activated grid appears under the graph layout in the Topology Display.
Figure A-16 Magnetic Grid
The Grid window contains the following elements:
•
•
•
•
•
•
•
Click OK to apply the settings or click Cancel to cancel the operation and return to the Topology Display window.
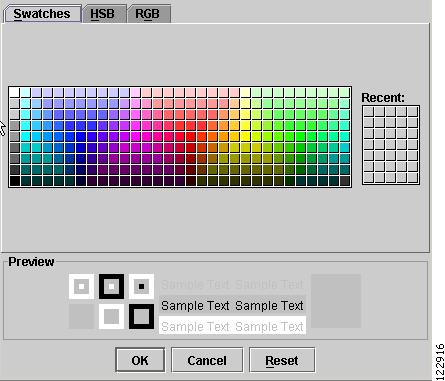
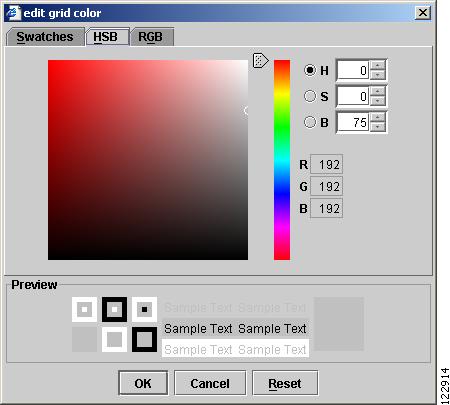
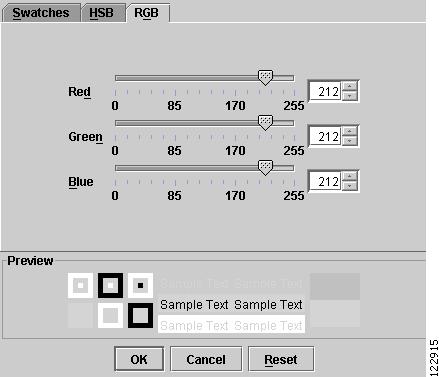
Grid Color
The Grid Color window in Figure A-17 has three tabs:
Swatches—The Swatches palette (shown) provides color swatches for making rapid color choices.
HSB—The HSB palette in Figure A-18 is used to set hue, saturation, and brightness.
RGB—The RGB window in Figure A-19 is used to set the color intensity for red, green, and blue, respectively.
Figure A-17 Edit Grid Color - Swatches
Figure A-18 Edit Grid Color - HSB Settings
Figure A-19 Edit Grid Color - RGB Settings
Make the desired changes and click OK.
Click Reset to reapply the default settings.
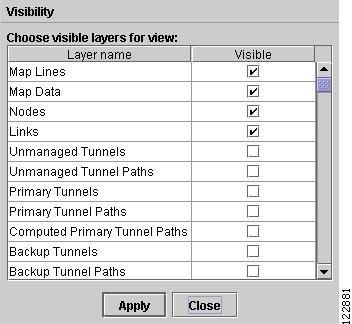
Layers
The various network elements are organized into layers that can be turned on and off to display only the part of the TE network that you want to see.
Select Tools > Layers to access the Layer Visilibity window shown in Figure A-20.
Figure A-20 Layer Visibility
In the Layer Visibility window, specify which layers should be visible by clicking the corresponding check boxes in the Visible column:
•
•
•
•
•
•
•
•
•
•
•
Click Apply to apply the settings or click Close to cancel the changes and quit the Layer Visibility window.
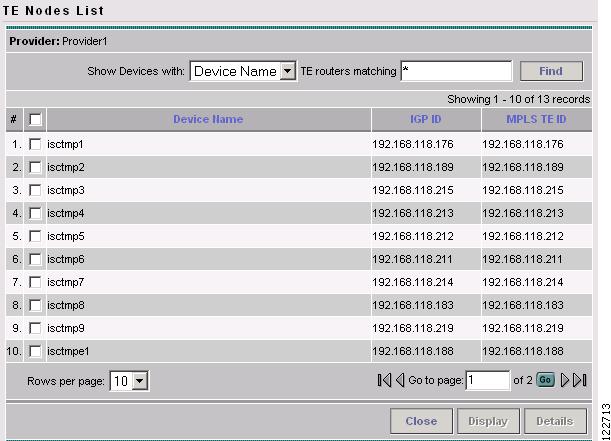
TE Nodes
This section describes the GUI elements in the TE Nodes tool.
The nodes of the TE network can be viewed after running a TE Discovery task. For instructions on how to run a TE Discovery task, see Chapter 3, "TE Network Discovery."
The TE Nodes tool gives access to both textual and visual information about the nodes discovered in the TE network.
To access the TE Nodes window, go to Service Inventory > Inventory and Connection Manager > Traffic Engineering Management > TE Nodes. The TE Nodes List window in Figure A-21 appears.
Figure A-21 TE Nodes List
The following actions can be performed:
•
•
•
•
Display TE Nodes
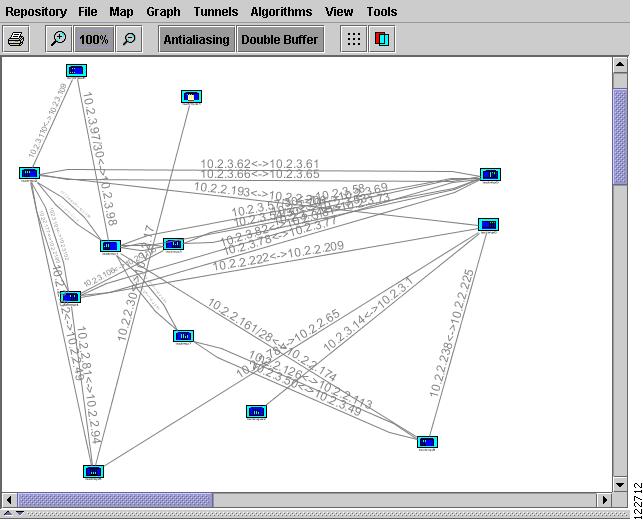
The Topology Display can be invoked to highlight selected nodes.
Go to Service Inventory > Inventory and Connection Manager > Traffic Engineering Management. Click TE Nodes. Select one or more devices by clicking the corresponding check boxes. Click the Display button. The Topology Display applet in Figure A-22 appears.
Figure A-22 TE Nodes Topology Display
For a description of how to use the Topology Display features, see Topology Display.
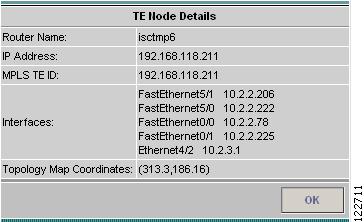
View Node Details
To view the detailed information about a particular node, use the following steps, go to Service Inventory > Inventory and Connection Manager > Traffic Engineering Management > TE Nodes.
Select a device by clicking the corresponding check box. Click the Detail button. The TE Node Details window in Figure A-23 appears.
Figure A-23 TE Node Details
The TE Node Details window contains the following fields:
•
•
•
•
•
Click OK to close the TE Node Details window.
TE Links
This section describes the GUI elements in the TE Links tool.
The links of the TE network can be viewed after running a TE Discovery task. For instructions of how to run a TE Discovery task, see Chapter 3, "TE Network Discovery."
The TE Links window gives access to both textual and visual information about the links discovered in the network.
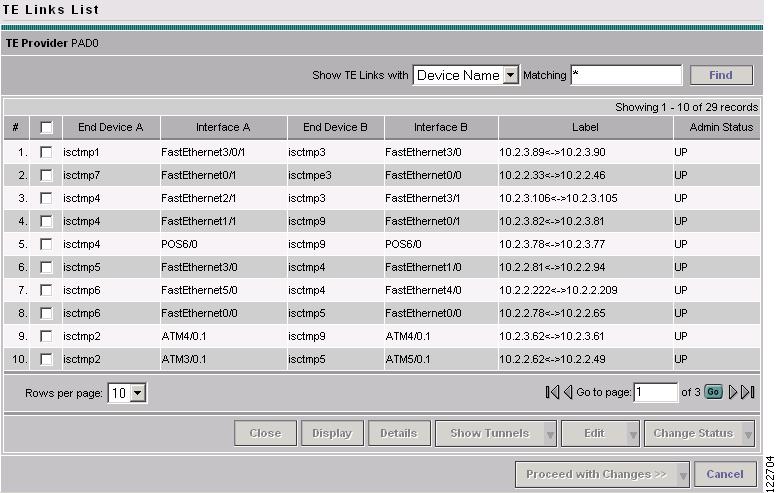
To access the TE Links window, go to Service Inventory > Inventory and Connection Manager > Traffic Engineering Management > TE Links. The TE Links List window in Figure A-24 appears.
Figure A-24 TE Links List
The columns in the links list table provides the following information:
•
•
•
•
•
•
Note
The following actions can be performed:
•
•
•
•
–
–
–
–
–
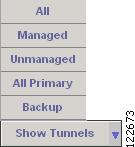
For more information about the Show Tunnels feature, see Show Tunnels.
Figure A-25 Show Tunnels Options
•
–
–
•
–
–
•
–
–
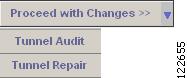
Figure A-26 TE Links List - Proceed with Changes
•
•
Display TE Links
The Topology Display can be invoked to highlight selected links.
Go to Service Inventory > Inventory and Connection Manager > Traffic Engineering Management > TE Links. Select one or more devices by clicking the corresponding check boxes. Click the Display button. The Topology Display Applet in Figure A-4 appears.
For a description of how to use the Topology Display features, see Using the TE Topology Interface Applet, page 11-2.
For an explanation of the GUI elements in the TE Topology Display applet, see Topology Display.
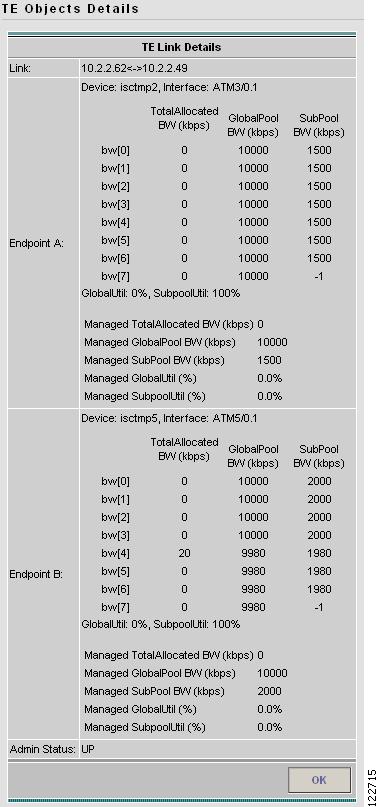
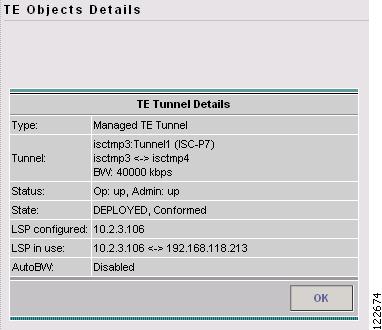
View Link Details
To view the detailed information about a particular link, go to Service Inventory > Inventory and Connection Manager > Traffic Engineering Management > TE Links. Select a device by clicking the corresponding check box. Click the Detail button. The TE Objects Details window in Figure A-27 appears.
Figure A-27 TE Objects Details
The TE Links Details contains the following fields:
•
•
–
–
–
–
–
–
–
–
–
–
–
–
•
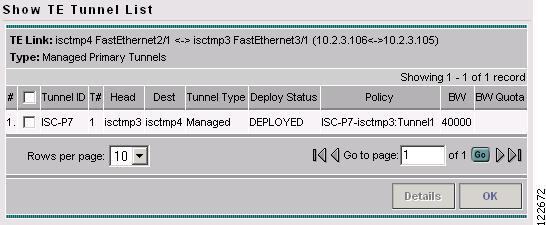
Show Tunnels
This feature allows you to display which TE tunnels (primary and/or backup) a particular TE Link is using and helps facilitate the tunnel planning and placement processes. In addition, you can see which tunnels are impacted when an interface (or link) in the TE network is shut down.
To view specific types of tunnels using the Show Tunnels button, go to Service Inventory > Inventory and Connection Manager > Traffic Engineering Management > TE Links. Select the desired link in the TE Links List (Figure A-24) and click Show Tunnels and select the type of tunnel you want to list.
The Show TE Tunnel List window in Figure A-28 appears.
Figure A-28 Show TE Tunnel List
The TE Managed Primary Tunnels SR window contains the following elements:
The columns in the tunnel list provides the following information:
•
•
•
•
•
•
•
•
•
To view the tunnel details for a particular tunnel, select the tunnel in question and click Detail.
Figure A-29 Show Tunnels - TE Objects Details
For an explanation of the various GUI elements, see View Managed Primary Tunnel Details.
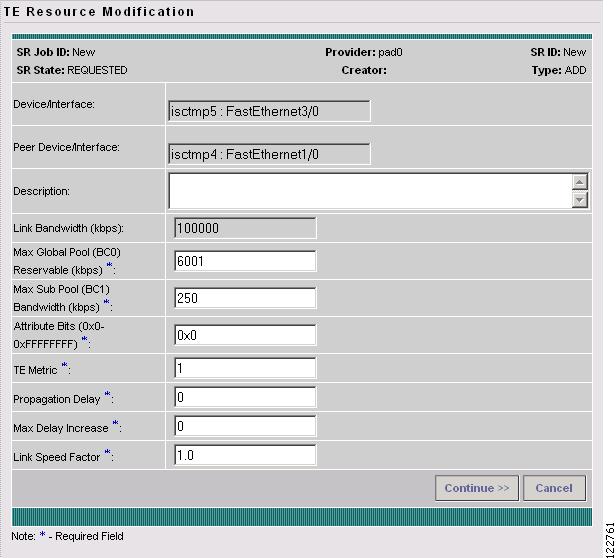
Edit Interface
To edit information about a particular link, go to Service Inventory > Inventory and Connection Manager > Traffic Engineering Management > TE Links. Select the desired link in the TE Links List (Figure A-24). Click Edit > Interface A or Edit > Interface B to edit one of the interfaces on the link.
The TE Resource Modification window in Figure A-30 appears.
Figure A-30 TE Resource Modification
The TE Resource Modification window contains the following fields:
•
•
•
•
•
•
•
•
•
•
•
The following actions can be performed:
•
•
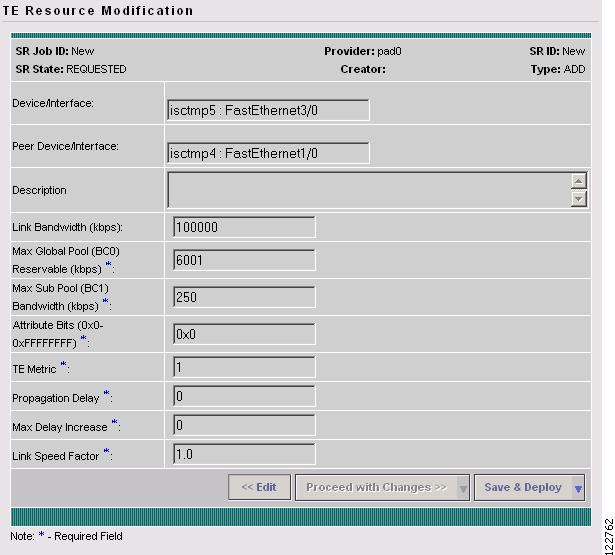
Figure A-31 TE Resource Modification (Confirmation Page)
The Confirmation Page provides a view-only snapshot of the SR data and offers the following options:
•
•
–
–
Figure A-32 TE Links List - Proceed with Changes
•
–
–
Figure A-33 TE Links List - Save & Deploy Tunnels
TE SRLGs
This section describes the GUI elements in the TE SRLGs tool. It is used to manage Shared Risk Link Groups (SRLGs) as part of ISC TEM protection management.
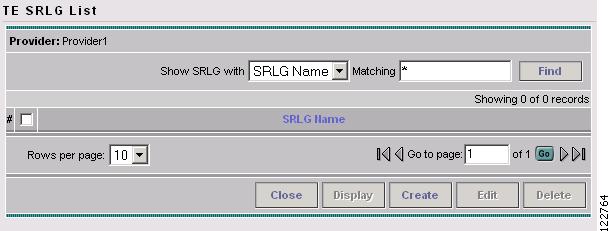
To access the TE SRLGs window, go to Service Inventory > Inventory and Connection Manager > Traffic Engineering Management > TE SRLGs. The TE SRLG List window in Figure A-37 appears.
Figure A-34 TE SRLG List
The TE SRLG List window lists SRLGs by name.
The following actions can be performed:
•
•
•
•
•
•
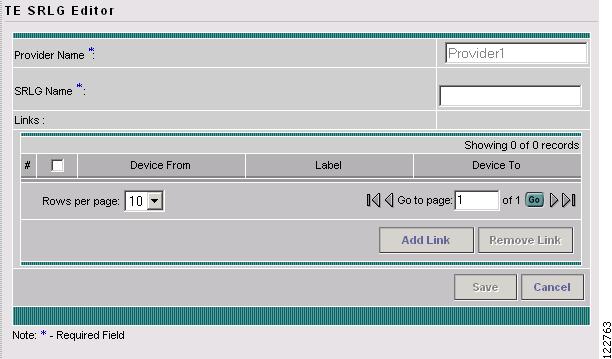
Create/Edit TE SRLG
This section describes the GUI elements in the TE SRLG Editor, which is used to both create and edit SRLGs.
The process of creating an SRLG is described in Create SRLG.
To access the TE SRLG Editor, go to Service Inventory > Inventory and Connection Manager > Traffic Engineering Management > TE SRLGs. In the TE SRLGs window, to create an SRLG click Create or to edit or select an SRLG that you want to edit by clicking the corresponding check box and clicking Edit.
In either case, the TE SRLG Editor window in Figure A-35 appears.
Figure A-35 TE SRLG Editor
The TE SRLG Editor window contains the following GUI elements:
•
•
The columns in the TE SRLG Editor provide the following information:
•
•
•
The following actions can be performed:
•
•
•
•
Step 4
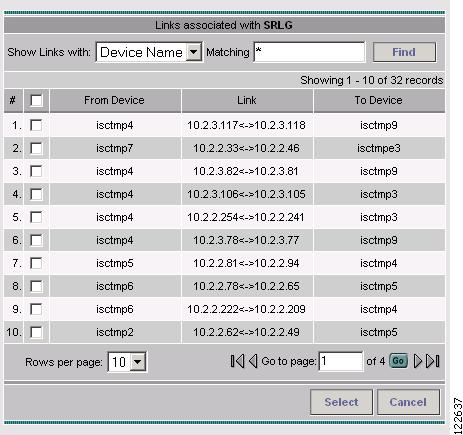
Figure A-36 Links associated with SRLG
The columns in the TE SRLG Editor provide the following information:
•
•
•
The following actions can be performed:
•
•
•
TE Explicit Paths
This section describes the GUI elements in the TE Explicit Path tool.
TE explicit paths can be created after the execution of a TE Discovery task. For instructions on how to create an explicit path, see Create Explicit Path.
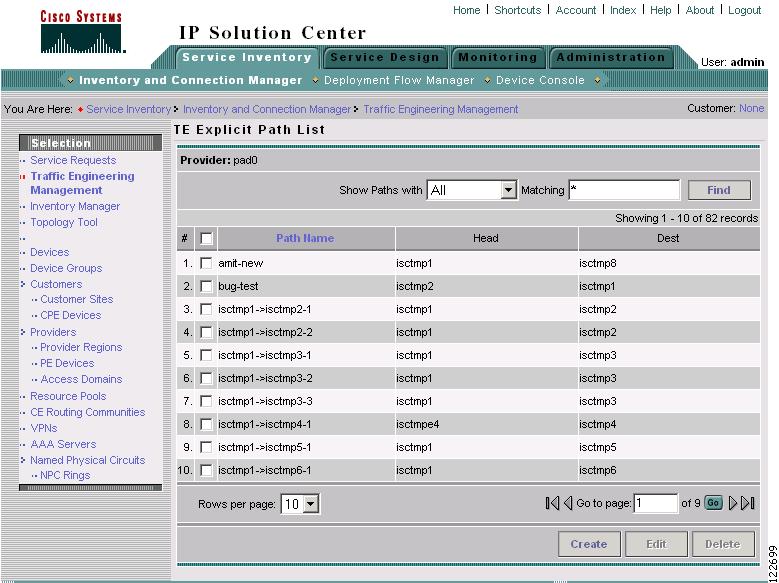
To access the TE Explicit Path List window, go to Service Inventory > Inventory and Connection Manager > Traffic Engineering Management > TE Explicit Paths. The TE Explicit Path List window in Figure A-37 appears.
Figure A-37 TE Explicit Path List
The columns in the TE Explicit Path list provides the following information:
•
•
•
The following actions can be performed:
•
•
•
•
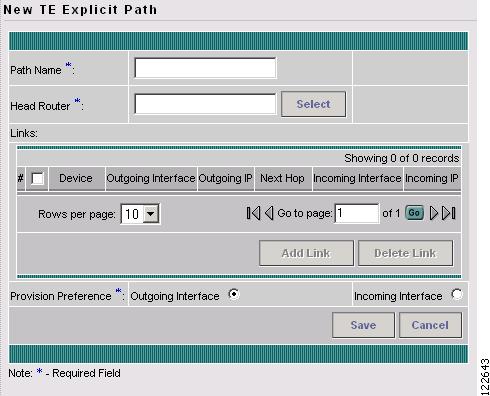
Create/Edit Explicit Path
This section describes the elements in the create and edit explicit path windows.
To create or edit an explicit path, see Create Explicit Path.
To create or modify an explicit path, go to Service Inventory > Inventory and Connection Manager > Traffic Engineering Management > TE Explicit Paths. In the TE Explicit Path List window, click Create to create an explicit path. To edit an explicit path, select the explicit path that you want to edit by clicking the corresponding check box and clicking Edit.
When clicking the Create button, the New TE Explicit Path window in Figure A-38 appears. A similar window appears when clicking the Edit button.
Figure A-38 New TE Explicit Path
The New TE Explicit Path window contains the following GUI elements
•
•
•
–
–
–
–
–
–
•
–
–
The following actions can be performed:
•
•
•
•
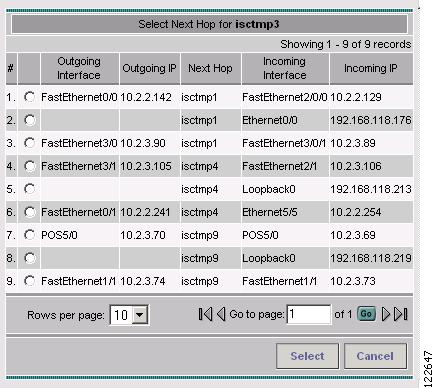
Step 5
Figure A-39 Select Next Hop
The columns in the TE Explicit Path list provide the following information:
•
•
•
•
•
TE Protected Elements
This section describes the TE Protected Elements GUI.
For instructions on how to configure protected elements, see Configure Element Protection.
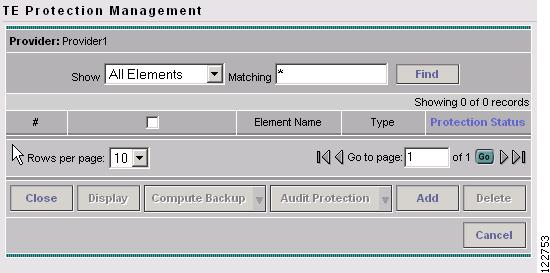
Accessing Protection Management
To access the TE Protection Management window, go to Service Inventory > Inventory and Connection Manager > Traffic Engineering Management. Click TE Protected Elements.
The TE Protection Management window in Figure A-40 appears.
Figure A-40 TE Protection Management
The columns in the TE Protection Management table provide the following information:
•
•
•
The following actions can be performed:
•
•
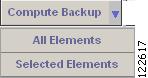
Figure A-41 Compute Backup Button
•
–
–
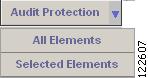
Figure A-42 Audit Protection
•
–
–
•
•
•
•
Compute Backup
This section describes the Compute Backup GUI.
For instructions on how to run Compute Backup on all or selected elements, see Configure Element Protection.
To run Compute Backup, go to Service Inventory > Inventory and Connection Manager > Traffic Engineering Management > TE Protected Elements. The TE Protection Management window in Figure A-40 appears.
In the TE Protection Management window, select one or more elements for which you want ISC TEM to calculate a backup path.
Click Compute Backup and select one of the following:
•
•
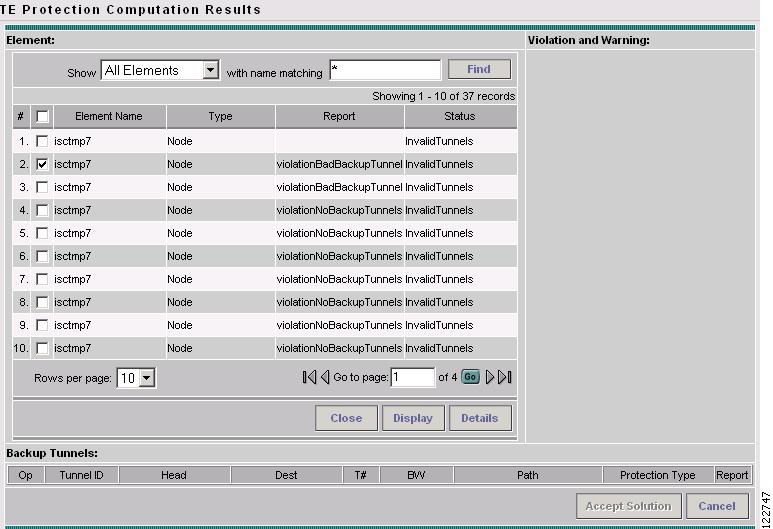
The window in Figure A-43 appears.
Figure A-43 TE Protection Computation Results
The Element: table displays the outcome of the computation for each element in the protection computation. The status for each element is indicated by at least one row per element in the table. If the status is not valid, the table will contain one row per warning or violation.
The Element: table contains the following columns:
•
•
•
•
The following actions can be performed:
•
•
•
Violation and Warning: pane—Describes the selected violation/warning and any relevant details about the corresponding link or flow.
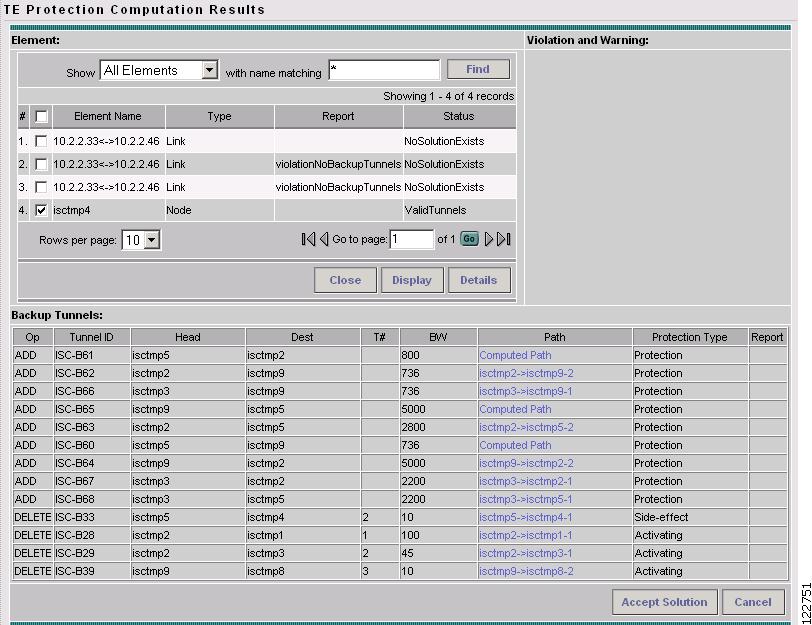
Figure A-44 TE Protection Computation Results with Backup Tunnels
The columns in the tunnel list provide the following information:
•
–
–
•
•
•
•
•
•
•
•
The following actions can be performed (buttons):
•
•
•
Audit Protection
This section describes the Audit Protection GUI.
For instructions on how to run Audit Protection on all or selected elements, see Configure Element Protection.
To run Audit Protection, go to Service Inventory > Inventory and Connection Manager > Traffic Engineering Management > TE Protected Elements. The TE Protection Management window in Figure A-40 appears.
In the TE Protection Management window, select one or more elements for which you want ISC TEM to perform an Audit Protection computation.
Click Audit Protection and select one of the following:
•
•
ISC TEM reports FRR Audit Protection in progress and the same computation result window as for Compute Backup in Figure A-43 appears.
The GUI for the rest of the process is identical to that described for Compute Backup.
Assign TE Resources
To access the TE Resource Management part of the TEM GUI, click Assign TE Resources in the Traffic Engineering Management Services window (see Figure A-1).
The graphical user interface for Assign TE Resources is identical to that of TE Links. For an explanation of the GUI elements of this window, see TE Links.
The process of assigning TE resources is explained in Chapter 4, "TE Resource Management."
Create Managed TE Tunnel
In this section, the GUI used to create managed traffic engineering tunnels is explained. For step-by-step instructions on how to create a managed TE tunnel, see "Basic Tunnel Management."
To access the Create Managed TE Tunnel window, go to Service Inventory > Inventory and Connection Manager > Traffic Engineering Management > Create Managed TE Tunnel.
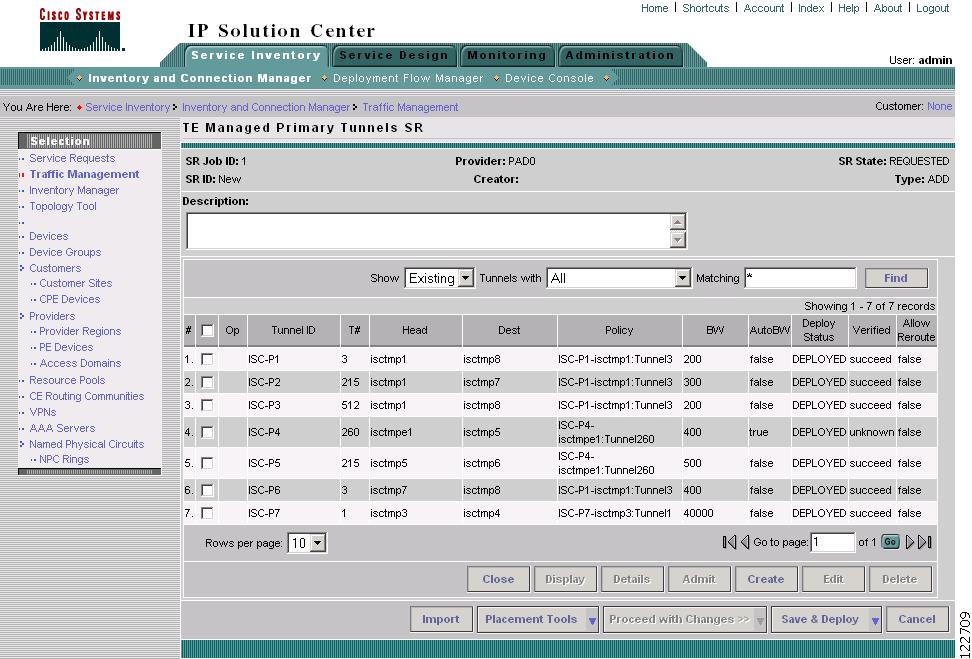
The TE Managed Primary Tunnels SR window in Figure A-45 appears.
Figure A-45 TE Managed Primary Tunnels SR
The TE Managed Primary Tunnels SR window contains the following elements:
The columns in the tunnel list provides the following information:
•
–
–
–
–
•
•
•
•
•
•
•
•
•
•
The following actions can be performed (buttons):
•
•
•
•
•
•
•
•
•
–
–
–
The Placement Tools GUI is described in Planning Tools.
•
–
–
–
•
–
–
Figure A-46 Save & Deploy Tunnels
•
The tunnel SR search tool allows you to look for particular tunnels by selecting tunnel characteristics in the drop-down menu tunnels with and specify matching criteria in the Matching field:
•
–
–
•
–
–
–
–
–
–
–
•
•
View Managed Primary Tunnel Details
This section describes the elements in the TE Managed Primary Tunnel Details window.
To view the details of a TE managed primary tunnel, go to Service Inventory > Inventory and Connection Manager > Traffic Engineering Management. > Create Managed TE Tunnel. The TE Managed Primary Tunnels SR window in Figure A-45 appears.
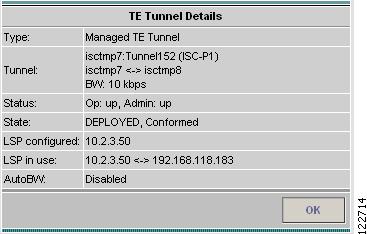
To view the details of a particular managed primary tunnel, select the desired tunnel by first clicking the corresponding check box and then clicking the Details button. When clicking Details, the TE Tunnel Details window in Figure A-47 appears.
Figure A-47 TE Tunnel Details
The TE Tunnel Details window contains the following elements:
•
•
•
•
•
•
•
Create TE Managed Primary Tunnel SR
This section describes the GUI elements in the Create TE Managed Primary Tunnel SR and Edit TE Managed Primary Tunnel windows. The create feature is here used as an example.
To create a TE Managed Primary Tunnel SR, see "Basic Tunnel Management."
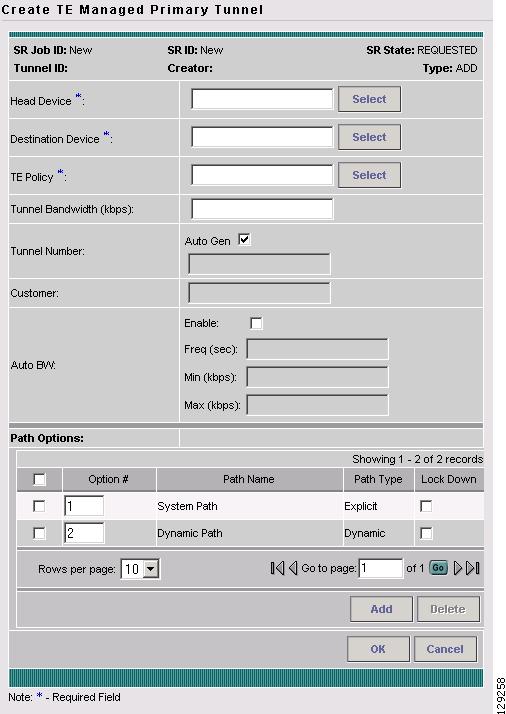
To access the Create TE Managed Primary Tunnel SR window, go to Service Inventory > Inventory and Connection Manager > Traffic Engineering Management > Create Managed TE Tunnel. The TE Managed Primary Tunnels SR window appears. Click Create, to open the Create TE Managed Primary Tunnel window as shown Figure A-48.
Figure A-48 Create TE Managed Primary Tunnel
The Create TE Managed Primary Tunnel window contains the following elements:
•
•
•
•
•
–
•
•
–
–
–
–
Path options:
•
•
–
–
•
•
The following actions can be performed:
•
•
•
•
Select Devices and Policy
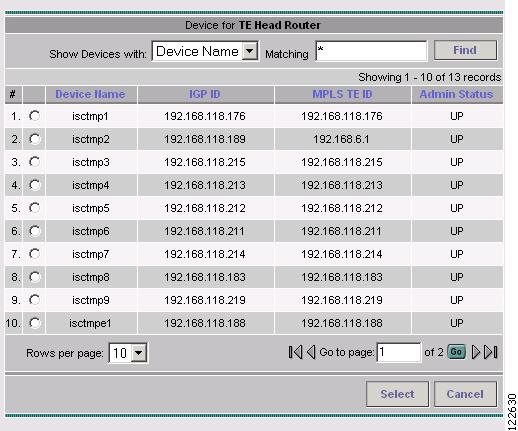
To select a Head Device in the Create TE Managed Primary Tunnel window (Figure A-48), click the corresponding Select button to open the Select Device for TE Head Router window shown in Figure A-49.
Figure A-49 Select Device for TE Head Router
The Select Device for TE Head Router window contains the following elements:
•
•
•
•
The following actions can be performed:
•
•
•
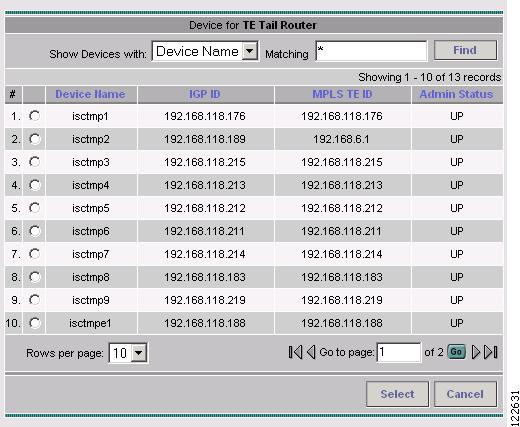
Figure A-50 Select Device for TE Tail Router
For a description of the GUI elements in the Select Device for TE Tail Router window, see the explanation for the Select Device for TE Head Router window.
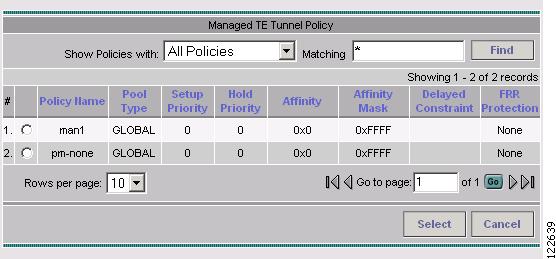
Figure A-51 Select Managed TE Tunnel Policy
The Select Managed TE Tunnel Policy window contains the following elements:
•
•
–
–
•
•
•
•
•
•
–
–
–
–
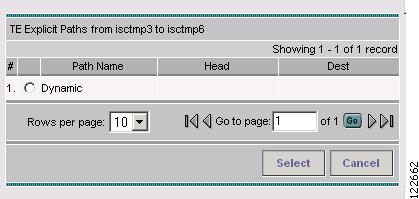
Select TE Explicit Path
An explicit path is added to a tunnel by clicking Add in the tunnel editor. The Select TE Explicit Path window in Figure A-52 appears.
Figure A-52 Select TE Explicit Path
Two path types are available:
Explicit Path—A fixed path from a specific head to a specific destination device.
Dynamic Path—A path that is provisioned by allowing the head router to find the path. The dynamic IOS keyword is provisioned to the routers. This signifies that the router calculates a valid path.
Explicit Path Viewer
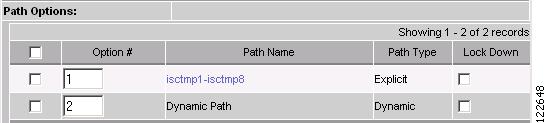
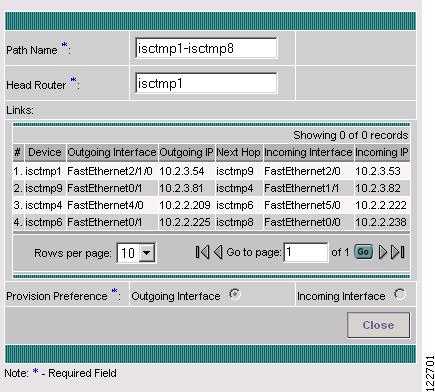
When creating a primary tunnel, the Path Options list by default suggests a System path and a Dynamic path. If an explicit path is added, this link will be selectable as shown in the Path Options section of the create window in Figure A-53. By clicking an explicit path link, a non-editable Explicit Path Viewer in Figure A-54 appears.
Figure A-53 Path Options
For an explanation of the various GUI elements, see Create Managed TE Tunnel.
Figure A-54 TE Explicit Path Viewer
For an explanation of the various GUI elements, see Create/Edit Explicit Path.
Import Tunnel
This section describes the GUI elements in the import tunnel feature.
For instructions on how to import TE tunnels, see the Import Primary Tunnel, page 6-8.
The tunnel import function is found under Service Inventory > Inventory and Connection Manager > Traffic Engineering Management > Create Managed TE Tunnel, which opens the TE Managed Primary Tunnels SR window (see Figure A-62).
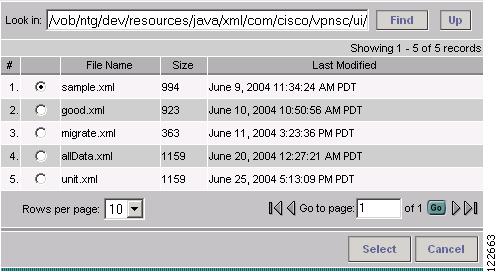
When you click Import to start the import process, the Select Import File window in Figure A-55 appears.
Note
Figure A-55 Select Import File
The Select Managed TE Tunnel Policy window contains the following elements:
•
•
•
The following actions can be performed:
•
•
•
•
Import Error Status Window
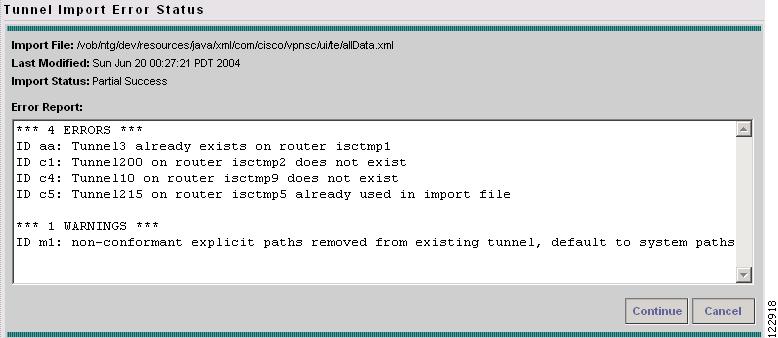
When you click Select to start the import operation, the system parses the file, and if any error is detected, it will be reported in the Tunnel Import Error Status window shown in Figure A-56.
Figure A-56 Tunnel Import Error Status
The Tunnel Import Error Status window contains the following elements:
•
•
•
–
–
The following actions can be performed:
•
•
Edit TE SR (Primary or Backup)
The tunnels editor windows differ only very slightly from the create tunnel windows. All fields in the editor windows are found in the create windows for both primary managed, primary unmanaged, and backup tunnels (see "Basic Tunnel Management").
The only difference from the create window is that the head and destination device and tunnel number fields are not editable and the Path Options table lists existing path options on the tunnel rather than the default System and Dynamic paths.
Planning Tools
This section describes the GUI elements in the sequence of windows used by the planning tools Tunnel Audit, Tunnel Placement, Tunnel Repair, and Grooming. Screenshots from Tunnel Repair has been used as an example but it covers the GUI elements for all four processes.
To use the planning tools, see Placement Tools, page 6-11
To access the Create TE Managed Primary Tunnel SR window, go to Service Inventory > Inventory and Connection Manager > Traffic Engineering Management > Create Managed TE Tunnel. The TE Managed Primary Tunnels SR window in Figure A-62 appears.
There are two ways to activate the planning tools:
•
•
As an example, assume that we run Tunnel Repair on a set of tunnels as described in Tunnel Repair, page 6-21.
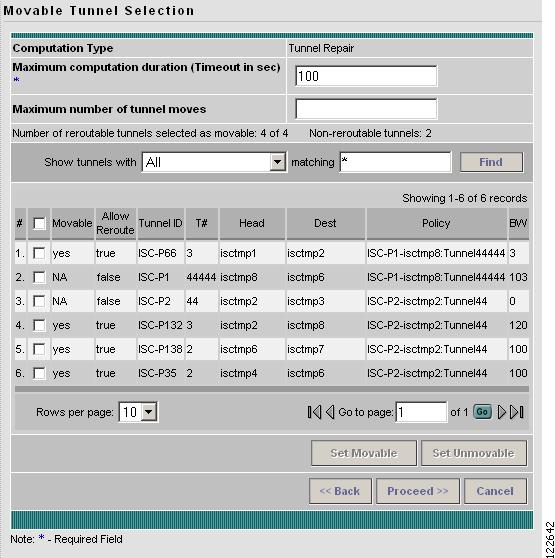
Movable Tunnel Selection Window
When selecting Tunnel Repair from the Placement Tools button, the Movable Tunnel Selection window in Figure A-57 appears.
Figure A-57 Movable Tunnel Selection
The Movable Tunnel Selection window contains the following elements:
•
•
•
•
•
•
Show tunnels with options:
–
–
–
–
–
–
–
matching/equal—Specify matching criteria for your search. Wildcards are accepted. matching changes to equal if Head, Dest Device is selected in the drop-down menu. For equal, the exact host name of the head or tail device must be entered (wildcards not accepted).
•
•
•
•
•
•
•
•
The following actions can be performed:
•
•
•
•
•
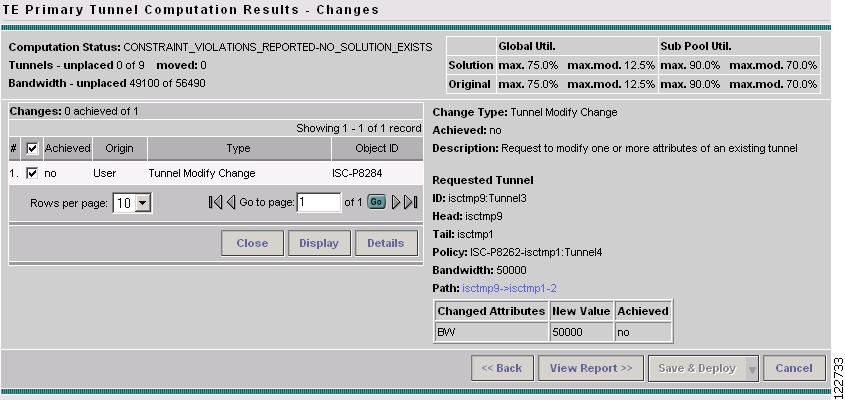
TE Primary Tunnel Computation SR - Changes Window
Still using Tunnel Repair as an example, after selecting Proceed >> from the Movable Tunnel Selection window, the TE Primary Tunnel Computation Results - Changes window in Figure A-58 appears.
The figure shows the computation results window after clicking Detail to obtain detailed information about the tunnel and view the status of the change request.
Figure A-58 TE Primary Tunnel Computation Results - Tunnel Repair Changes (Details)
The TE Primary Tunnel Computation Results - Changes window contains the following elements:
Status section (top):
•
•
–
–
•
•
•
•
•
Changes section (left):
•
–
–
–
–
Information section (right):
•
•
•
•
•
•
•
•
•
•
–
–
–
The following actions can be performed:
•
•
•
•
•
•
–
–
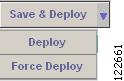
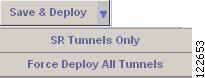
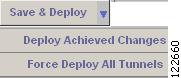
Figure A-59 Save & Deploy
•
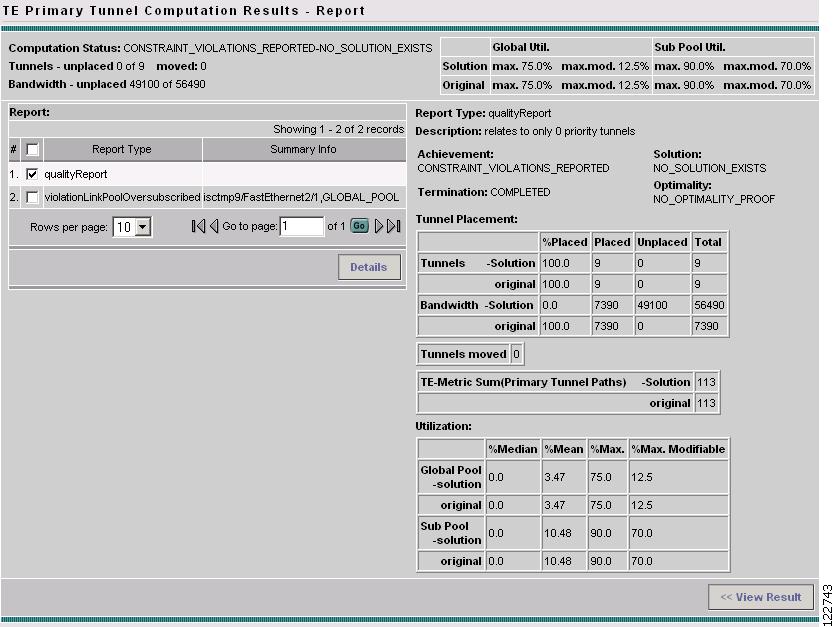
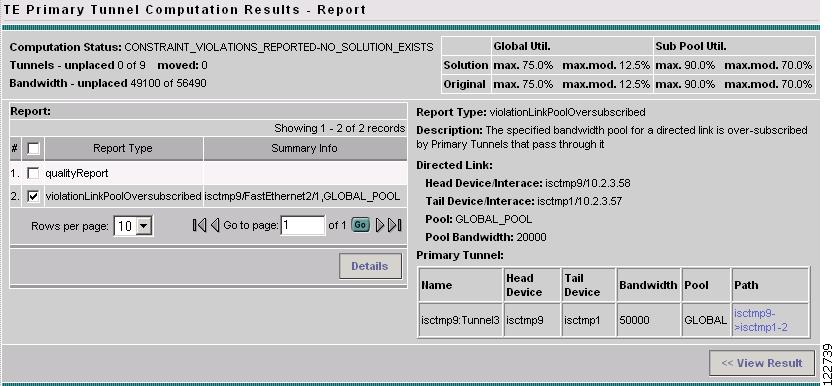
TE Primary Tunnel Computation Results - Report
To view the computation reports, click View Report >>. The TE Primary Tunnel Computation Results - Report window in Figure A-60 appears.
In this case, there is both a quality report and a violation report. In that case, a detail report such as the violation report in Figure A-61 will appear. Warning and violation reports have different fields and they are all described in Appendix B, "Warnings and Violations."
Select the desired report and click the Detail button
Figure A-60 TE Managed Primary Tunnels SR - Tunnel Repair Report (Details)
The TE Primary Tunnel Computation Results - Report window contains the following elements:
Status section (top): described above (Figure A-58).
Report section (left):
•
•
Information section (right):
•
•
•
•
•
•
Tables:
•
–
–
–
–
–
–
–
–
•
–
–
–
–
–
–
The following actions can be performed:
Changes actions (buttons, left):
•
Note
•
Figure A-61 TE Managed Primary Tunnels SR - Violation Report (Details)
In Figure A-61, the top status section and the left Report section contain the same fields as in Figure A-60.
Create Unmanaged TE Tunnel
The only two differences between the managed and the unmanaged tunnel GUIs is that the path option table does not automatically populate the two System/Dynamic paths and that the Conformance status is only indicated for unmanaged primary tunnels.
For a description of the rest of the GUI, see Create Managed TE Tunnel.
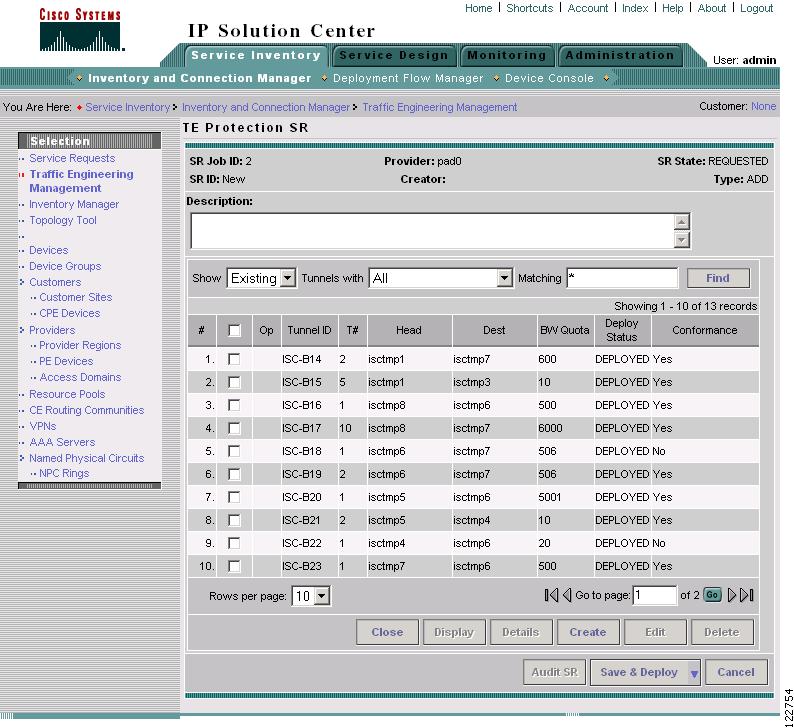
Create TE Backup Tunnel
To access the TE Protection SR window for managing backup tunnels, go to Service Inventory > Inventory and Connection Manager > Traffic Engineering Management > Create TE Backup Tunnel. The TE Protection SR window in Figure A-62 appears.
Figure A-62 TE Protection SR
The TE Protection SR window contains the following elements:
The columns in the tunnel list provides the following information:
•
–
–
–
•
•
•
•
•
•
•
The following actions can be performed (buttons):
•
•
•
•
•
•
•
•
–
–
Figure A-63 Save & Deploy Tunnels
•
The tunnel SR search tool allows you to look for particular tunnels by selecting tunnel characteristics in the drop-down menu tunnels with and specify matching criteria in the Matching field:
•
–
–
•
–
–
–
–
–
–
–
•
•
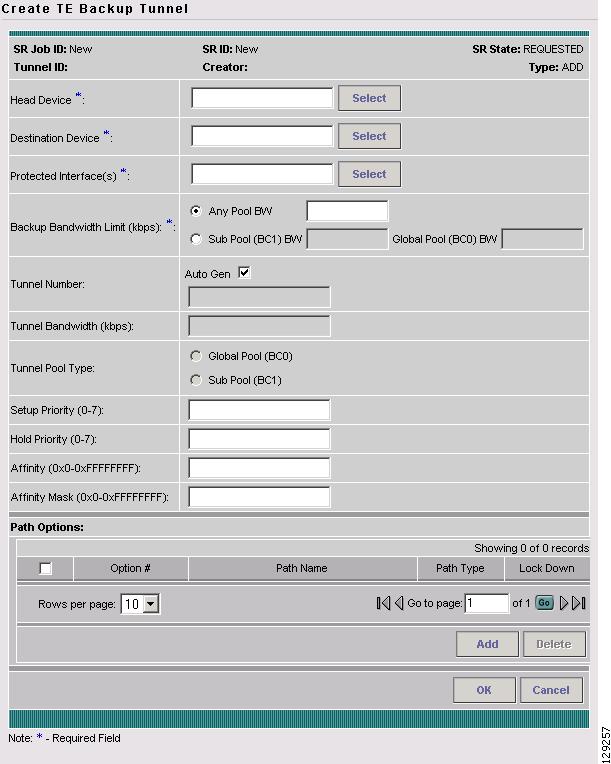
Create TE Backup Tunnel Window
From the TE Protection SR window, click Create to access the Create TE Backup Tunnel window shown in Figure A-64.
Figure A-64 Create TE Backup Tunnel
The Create TE Backup Tunnel window contains the following elements:
•
•
•
•
–
–
–
•
–
•
•
–
–
•
Path options:
•
•
•
•
The following actions can be performed (buttons):
•
•
•
•
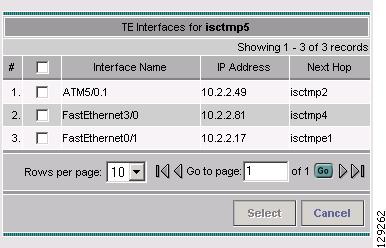
Select TE Protected Interface
When clicking the Select button in the backup tunnel editor to select a TE protected interface, the window in Figure A-65 appears.
Figure A-65 Select TE Protected Interface
The Select TE Protected Interface window contains the following elements:
•
•
•
The following actions can be performed:
•
•
TE Traffic Admission
This section describes the GUI elements in the TE Traffic Admission SR window.
To assign traffic to traffic-engineered tunnels, see "Traffic Admission."
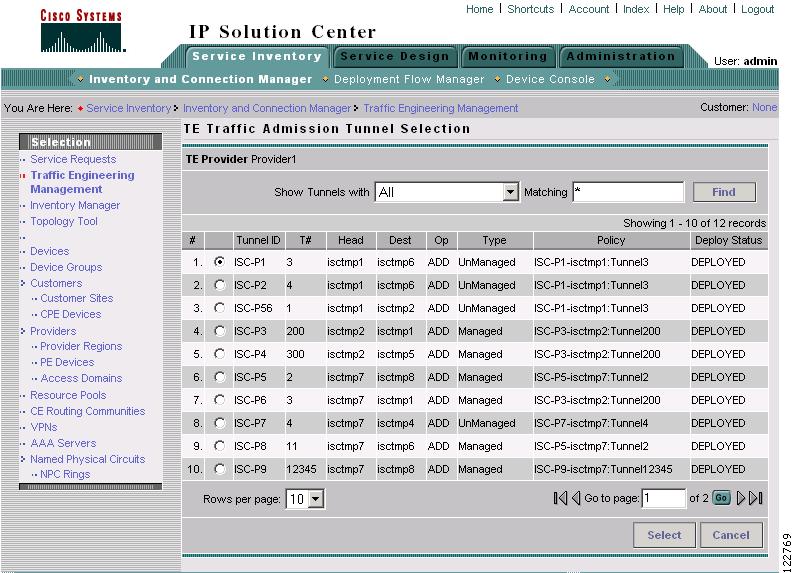
Select TE Tunnel for Admission
To access the TE Traffic Admission SR window, go to Service Inventory > Inventory and Connection Manager > Traffic Engineering Management > TE Traffic Admission.
Prior to reaching the main TE Traffic Admission SR window, a tunnel has to be selected as shown in Figure A-66.
Figure A-66 Select TE Tunnel for Admission
The TE Traffic Admission SR list contains the following columns:
•
•
•
•
•
•
•
•
TE Traffic Admission SR
After selecting a TE tunnel by clicking the corresponding radio button and clicking Select, the TE Traffic Admission SR window in Figure A-67 appears.
Figure A-67 TE Traffic Admission SR
The main TE Traffic Admission SR window contains the following fields:
•
•
•
–
–
•
–
–
•
•
•
•
The following actions can be performed:
•
•
•
•
•
Adminstration
As the administrative features of ISC TEM are general to ISC, some features are described in Chapter 9, "Administration", others in Cisco IP Solution Center Infrastructure Reference, 4.0.
For further clarification, see Chapter 9, "Administration".
Monitoring
This section describes the GUI elements in the following windows:
•
•
TE Task Logs
The TE task logs are used to view the result of running one or more TE tasks as described in TE Task Logs, page 10-1.
To view the task log for a TE task, three sequential steps are required:
1.
2.
3.
Each window in this process is described as follows.
Note
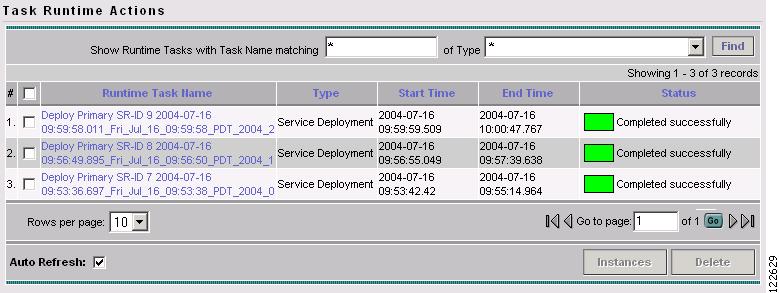
Task Runtime Actions
To access the Task Runtime Actions window, go to Monitoring > Task Manager. Select Logs in the table of contents on the left side of the Tasks window. The Task Runtime Actions window in Figure A-68 appears.
Figure A-68 Task Runtime Actions
The Task Runtime Actions window contains the following GUI elements:
•
•
•
•
•
Search fields:
•
•
–
–
–
Runtime Actions
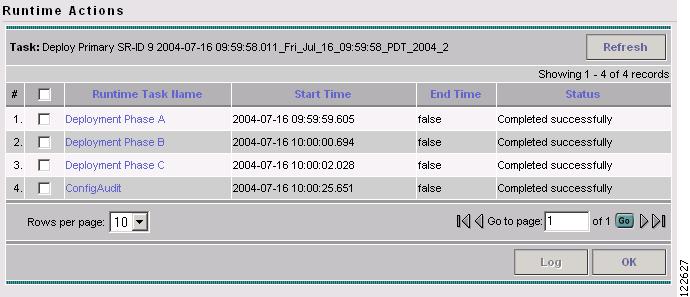
To access the Runtime Actions window, go to the Task Runtime Actions window and click the desired task in the Runtime Task Name field. This open the Runtime Actions window shown in Figure A-69.
Figure A-69 Runtime Actions
The Runtime Actions window contains the following GUI elements:
•
•
•
•
•
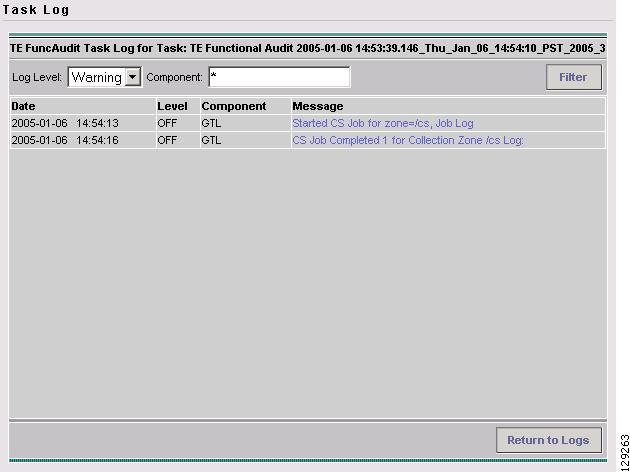
Task Log
To access the Task Log window, go to the Runtime Actions window and click the desired log in the Action field or select a check box and click Log. The Task Log window in Figure A-70 appears.
Figure A-70 Task Log
How the log is structured depends on the type of task that was run.
The following actions can be performed:
•
•
TE Performance Reports
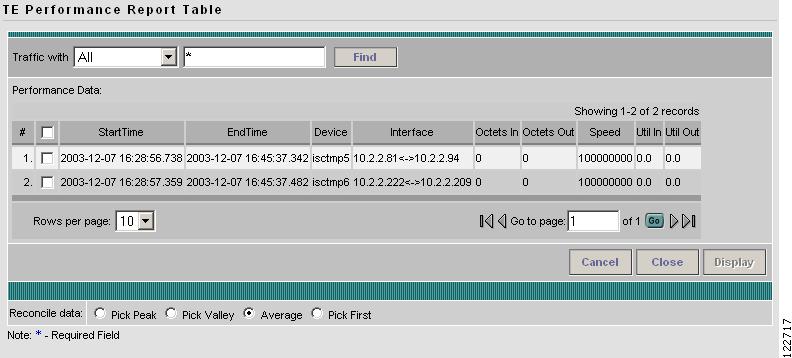
Performance reports are created when you run a TE Interface Performance task as described in Creating a TE Interface Performance Task, page 9-11.
To view a performance report, go to Monitoring > TE Performance Report. The TE Performance Report Table in Figure A-71 appears.
Figure A-71 TE Performance Report Table
The TE Performance Report Table window contains the following GUI elements:
•
–
–
–
–
–
–
–
–
–
•
–
–
–
–
You can perform the following actions:
•
•
•
•