-
Cisco IP Solution Center Traffic Engineering Management User Guide, 4.0
-
Index
-
About This Guide
-
Introduction to ISC TEM
-
Setting Up the Service
-
TE Network Discovery
-
TE Resource Management
-
Basic Tunnel Management
-
Advanced Primary Tunnel Management
-
Protection Planning
-
Traffic Admission
-
Administration
-
Task Monitoring
-
TE Topology
-
Traffic Engineering Management GUI
-
Warnings and Violations
-
Document Type Definition (DTD) File
-
 Feedback
Table Of Contents
Memory Shortage on Large Networks
TE Network Discovery
After the bootstrapping process has been completed and a seed router created, you can discover the TE network for a particular TE provider to populate the repository with a view to creating primary and backup tunnels.
The TE network is discovered by creating TE Discovery tasks and using a logging and verification mechanism.
This chapter describes the steps required to create and run a TE Discovery task and verify the results.
It includes the following sections:
•
Verifying a TE Discovery Task
Overview
The purpose of the discovery process is to populate the repository with the network topology, tunnels, and static routes to tunnels present in the live network.
The discovery process uses a seed device to discover the MPLS TE network topology using either Telnet or SSH. It uses a schedulable task that can be run once or on a periodic basis. Any inconsistencies between the repository and the network are reported. The service state information is updated incrementally by logging tunnel in-use Label Switched Paths (LSPs) and updating the service request (SR) state.
TE Discovery Prerequisites
To successfully run a TE Discovery task, the seed router must be directly accessible from the management station.
For Telnet, there must be either direct Telnet access from the Cisco IP Solution Center Traffic Engineering Management (ISC TEM) management station to each device and/or Telnet access from the seed device.
See Bootstrapping Process Overview for instructions on how to select Telnet or SSH when setting up a seed router.
Memory Shortage on Large Networks
When running discovery on a large network (250+ devices or 5000+ tunnels, for example) and an OutOfMemoryException is encountered, do the following:
Edit the watchdog.server.worker.java.flags property in the vpnsc.properties file to say -Xmx1024m instead of the default -Xmx512m. This increases the heapsize of the discovery task, which will clear up the OutOfMemoryException problem.
When no longer needed, make sure to revert the properties back to their original state to reduce the resource usage.
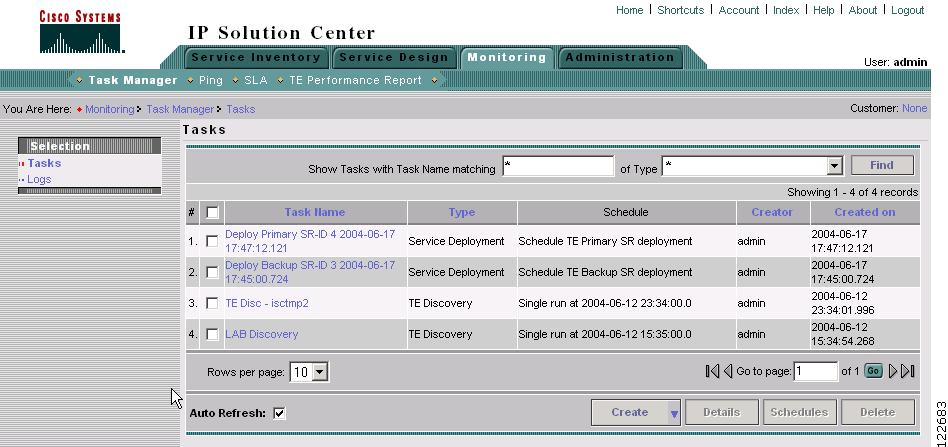
Creating a TE Discovery Task
To create a TE Discovery task on the TE network, use the following steps:
Step 1
Figure 3-1 Tasks
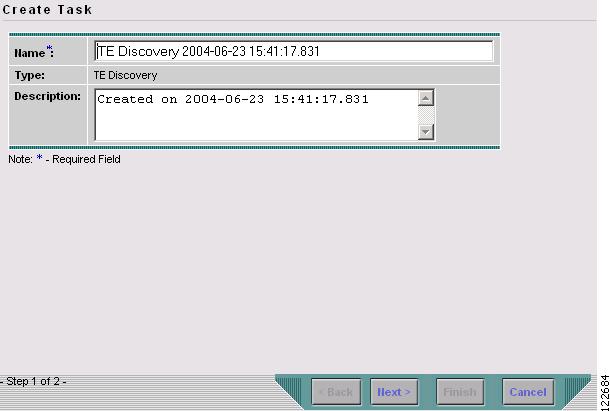
Step 2
Figure 3-2 Create TE Discovery Task (Step 1)
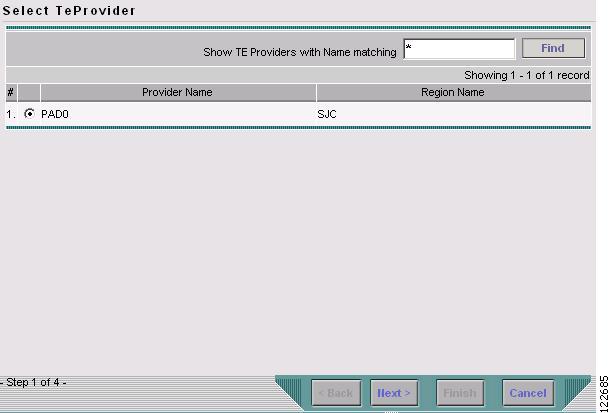
Step 3
Figure 3-3 Select TE Provider
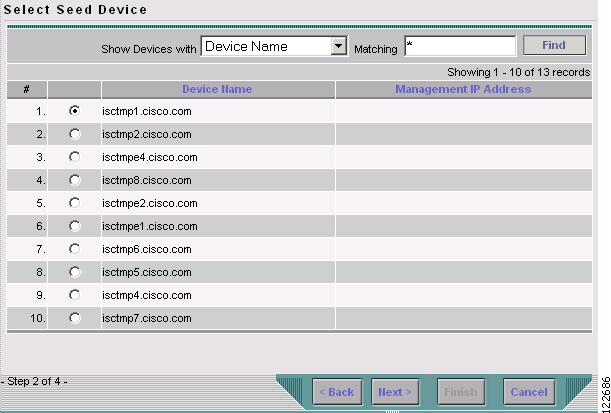
Step 4
Figure 3-4 Select Seed Device
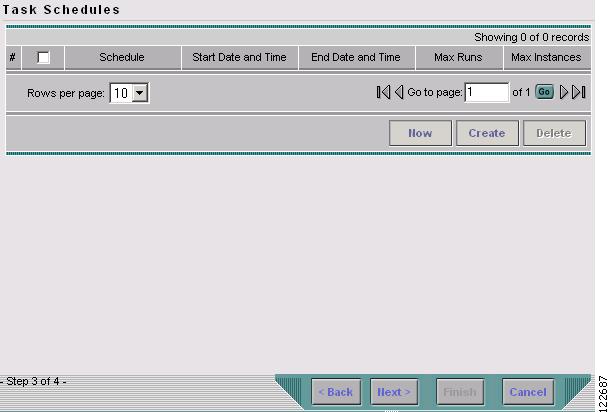
Step 5
Figure 3-5 TE Discovery Task Schedules Window Before Scheduling
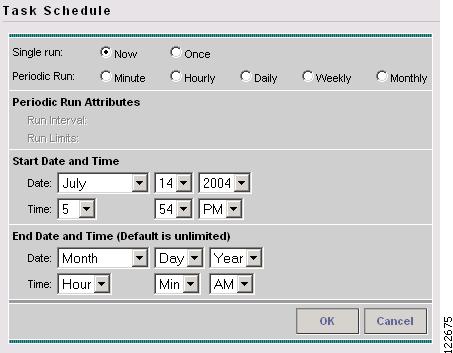
Step 6
Figure 3-6 Task Schedule
Step 7
Note
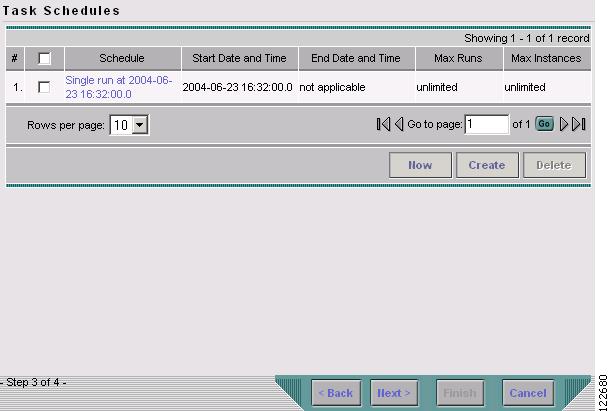
Step 8
Figure 3-7 TE Discovery Task Schedules Window After Scheduling
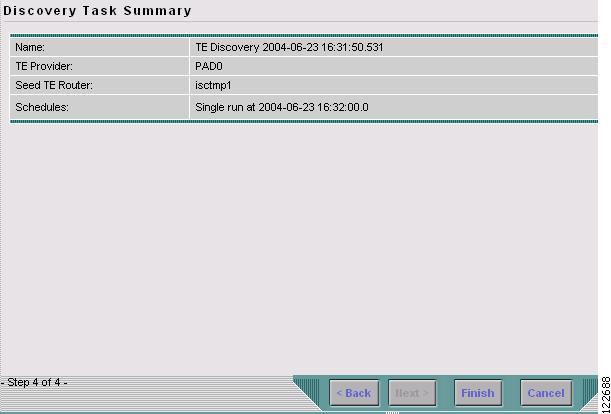
Step 9
Figure 3-8 Discovery Task Summary
Step 10
Verifying a TE Discovery Task
The result of running the TE Discovery task can be assessed in three ways:
•
•
•
Task Logs
The TE Discovery log captures the state of the network and compares it with the most recent snapshot of the repository.
To view the task log for a TE Discovery task, use the following steps:
Step 1
Step 2
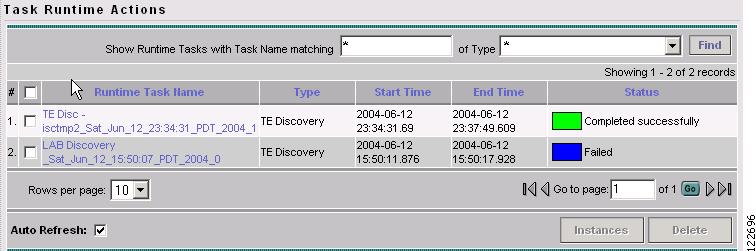
Figure 3-9 Task Runtime Actions
For an explanation of the various window elements, see Task Runtime Actions.
The status of the tasks are shown in the displayed table. This updates automatically and indicates when the discovery process is complete.
If the task is not completed and Auto Refresh is selected, the table continues to update periodically until it is completed.
Step 3
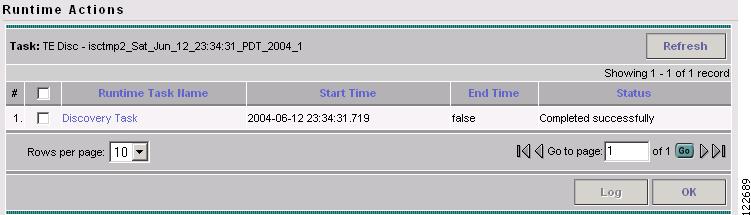
Figure 3-10 Runtime Actions
For an explanation of the various window elements, see Runtime Actions.
The Runtime Actions window shows the actions created for the selected task.
Step 4
Note
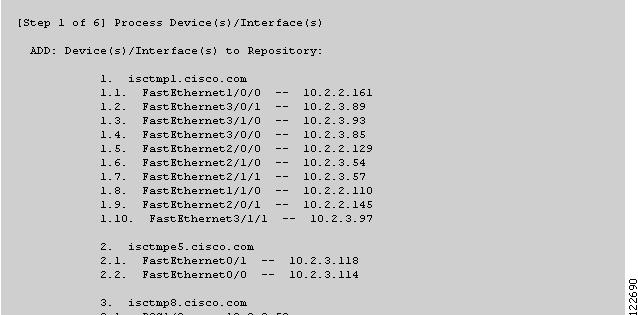
Figure 3-11 TE Discovery Task Log - Devices/Interfaces
Figure 3-12 TE Discovery Task Log - Links
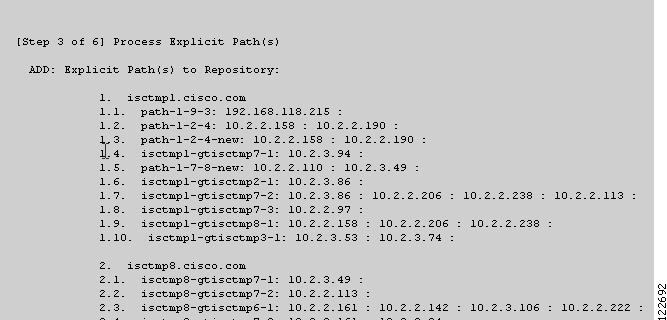
Figure 3-13 TE Discovery Task Log - Explicit Paths
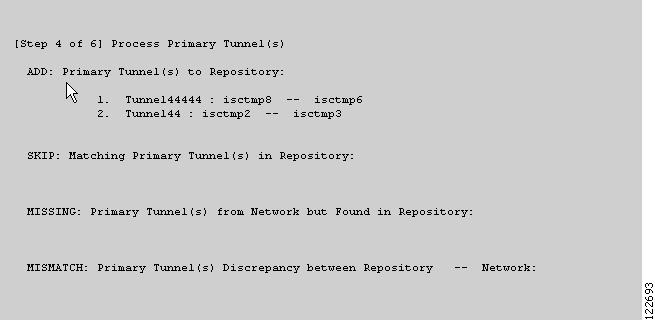
Figure 3-14 TE Discovery Task Log - Primary Tunnels
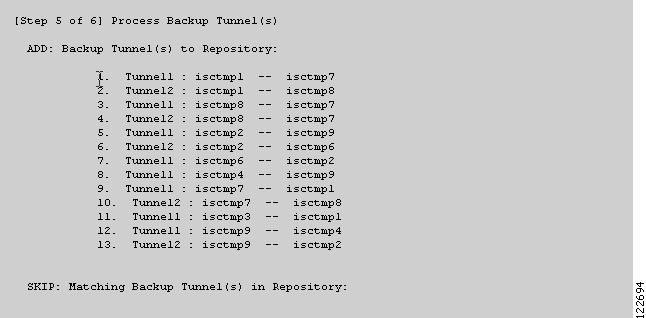
Figure 3-15 TE Discovery Task Log - Backup Tunnels
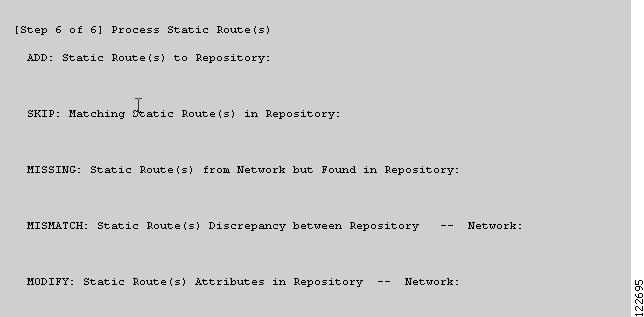
Figure 3-16 TE Discovery Task Log - Static Routes
The TE Discovery task log window is organized into sections that each describes particular events in the TE network:
•
•
The summary of changes in the network is reported in six steps:
1.
2.
3.
4.
5.
6.
As seen in the figures, in each step a log table reports the changes in the following reporting categories:
•
•
•
•
•
Step 5
TE Topology
The TE Topology tool provides a visual snapshot of the current state of the network. It cannot be used to determine changes that have taken place in the network.
The steps required to generate a topology graph of the network are described in Chapter 4, "TE Resource Management."
View Network Element Types
Another way to check the state of the network after running TE discovery is to go to the Traffic Engineering Management Services window and select the type of elements you want to verify.
For example, to check the status of the nodes after running TE discovery, navigate Service Inventory > Inventory and Connection Manager > Traffic Engineering Management > TE Nodes. Look at the updated list of TE nodes to assess which nodes are in the network.
Do the same for TE Links, TE Primary Tunnels, TE Backup Tunnels, and so on.