-
Cisco IP Solution Center Traffic Engineering Management User Guide, 4.0
-
Index
-
About This Guide
-
Introduction to ISC TEM
-
Setting Up the Service
-
TE Network Discovery
-
TE Resource Management
-
Basic Tunnel Management
-
Advanced Primary Tunnel Management
-
Protection Planning
-
Traffic Admission
-
Administration
-
Task Monitoring
-
TE Topology
-
Traffic Engineering Management GUI
-
Warnings and Violations
-
Document Type Definition (DTD) File
-
 Feedback
Table Of Contents
Creating a TE Functional Audit Task
Creating a TE Interface Performance Task
SR History, Config Audit Report, and Configlets
Administration
A number of administrative features in Cisco IP Solution Center Traffic Engineering Management (ISC TEM) are common to ISC. Instructions on how to use these features are described in detail in Cisco IP Solution Center Infrastructure Reference, 4.0.
In this chapter, only TE-specific administrative features are described.
This chapter contains the following sections:
—Creating a TE Functional Audit Task
—Creating a TE Interface Performance Task
•
SR History, Config Audit Report, and Configlets
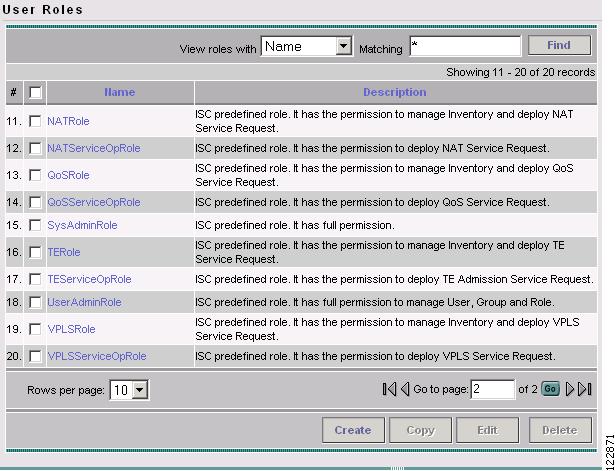
TE User Roles
A TE user role can be a predefined or a user-specified role defining a set of permissions. For a detailed description of user roles in ISC and how to use them, see the Cisco IP Solution Center Infrastructure Reference, 4.0.
To access the User Roles window and locate the TE user roles, navigate Administration > Security > User Roles. The User Roles window in Figure 9-1 appears.
Figure 9-1 User Roles
For a description of the various window elements, see Cisco IP Solution Center Infrastructure Reference, 4.0.
There are two pre-defined TEM user roles:
•
•
TE Policies
Policies are used to define common tunnel attributes. Attributes such as bandwidth pools, hold and setup priority, and affinity bits, are set manually during policy creation as described below.
This section describes the following policy operations:
Create Policy
ISC TEM allows you to create TE-specific policies in a manner similar to other ISC policies.
To create a TE policy, you must access the Policy Manager. Use the following steps:
Step 1
Step 2
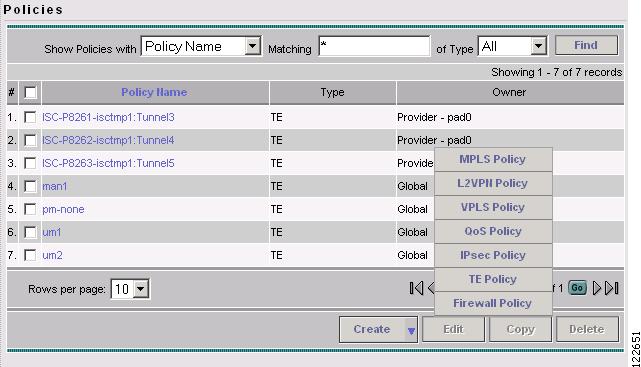
The Policies window in Figure 9-2 appears.
Figure 9-2 Policies Window
Step 3
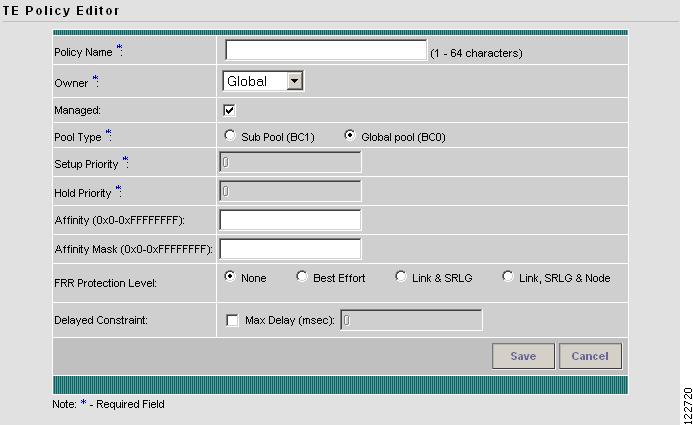
The TE Policy Editor window in Figure 9-3 appears.
Figure 9-3 TE Policy Editor
The TE Policy Editor window contains the following fields:
•
•
–
–
–
•
Clicking the Managed check box will add some extra fields in the TE Policy Editor corresponding to two additional protection levels for FRR Protection Level (Fast Re-Route) and a new field, Delay Constraint.
•
–
–
•
•
•
•
•
–
–
–
–
•
–
Two actions are available:
•
•
Edit Policy
A policy can be edited only if it is not associated with a tunnel.
To edit a TE policy, use the following steps:
Step 1
Step 2
The Policies window in Figure 9-2 appears.
Step 3
The TE Policy Editor window in Figure 9-3 appears. The TE Policy Editor window in Figure 9-3 appears. The policy editor is described in Create Policy. The only difference between the create and edit processes is that the policy name and owner are not editable when editing a policy.
Step 4
Delete Policy
A policy can be deleted only if it is not associated with a tunnel.
To delete a TE policy, use the following steps:
Step 1
Step 2
The Policies window in Figure 9-2 appears.
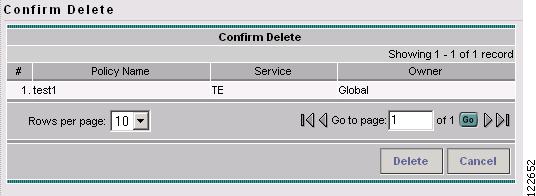
Step 3
Figure 9-4 Policies - Confirm Delete
Step 4
Step 5
TE Tasks
ISC TEM currently offers three TE-specific tasks that are used in a manner similar to other ISC tasks:
•
•
•
This section focuses on describing how to create TE Functional Audit and TE Interface Performance tasks. Instructions on how to create a TE Discovery task are included in "TE Network Discovery".
Creating a TE Task
TE tasks are managed in the ISC Task Manager, which is accessed as follows:
Step 1
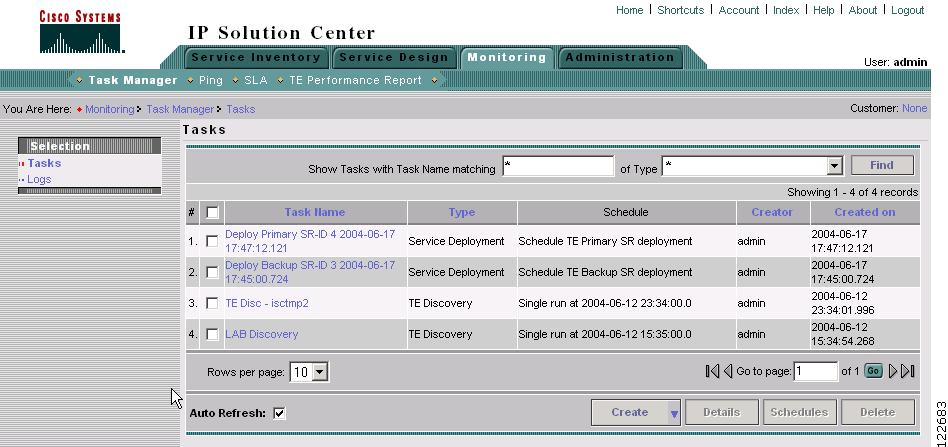
The Tasks window in Figure 9-5 appears.
Figure 9-5 Tasks Window
For a detailed description of the window elements in the Tasks window, see Cisco IP Solution Center Infrastructure Reference, 4.0.
This page shows all collection and deployment tasks that have been executed. Note that a task could be scheduled to happen once or there could be several scheduled runs of a task. The schedule can be viewed by selecting a task and clicking Schedules.
Creating a TE Functional Audit Task
For each tunnel in the SR, the TE Functional Audit task checks the LSP currently used on a router against the LSP stored in the repository:
•
•
–
–
•
This task only performs functional audit on TE Primary or Backup SRs, which are not in one of the following states:
•
•
•
•
For a detailed explanation of the various states, see Cisco IP Solution Center Infrastructure Reference, 4.0.
To create a TE Functional Audit task, use the following steps:
Step 1
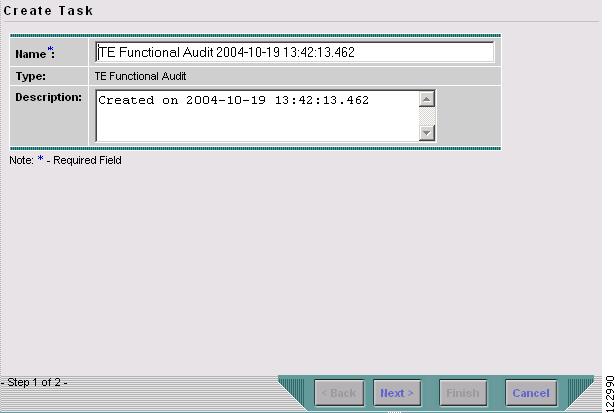
Step 2
Figure 9-6 Create a TE Functional Audit Task
For a detailed description of the window elements in the Create Task window, see Cisco IP Solution Center Infrastructure Reference, 4.0.
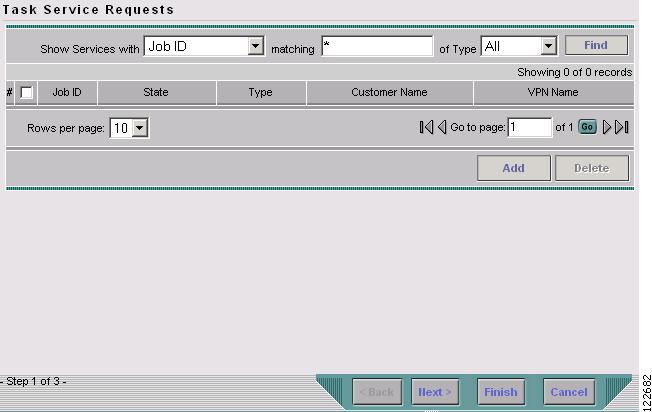
Step 3
The Task Service Requests window in Figure 9-7 appears.
Figure 9-7 Task Service Requests
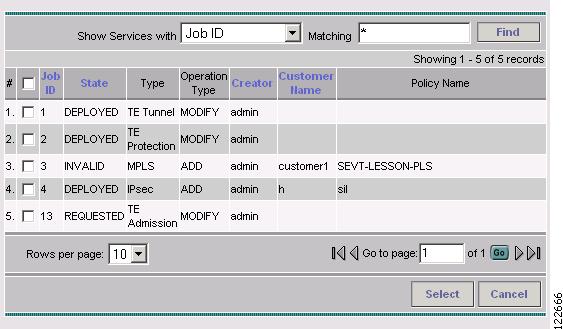
Step 4
Figure 9-8 Select Service Request(s)
Step 5
The Selected Service Request(s) window closes and the selected task(s) now appears in the Task Service Requests window. To add other SRs, repeat the procedure in Step 4 and Step 5.
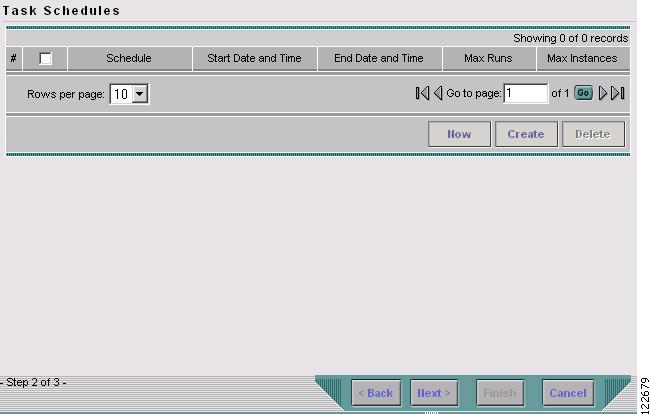
Step 6
Figure 9-9 Task Schedules
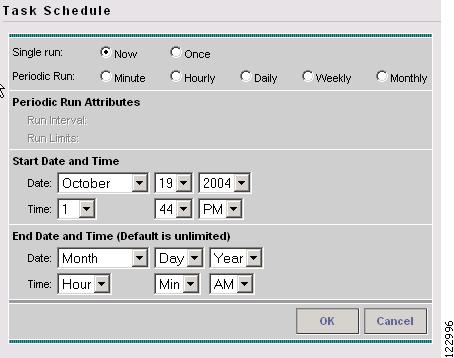
Step 7
Figure 9-10 Task Schedule
Step 8
Step 9
Note
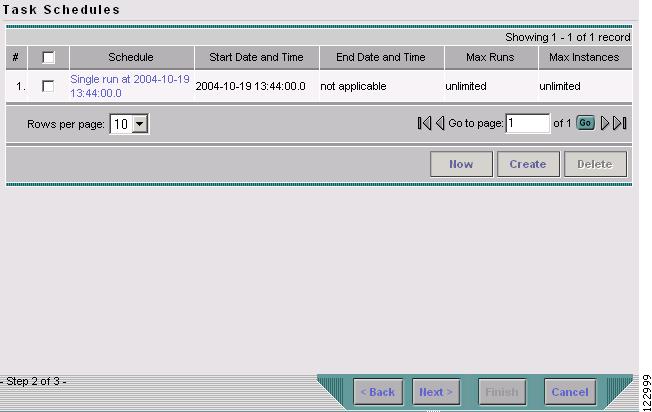
Step 10
Figure 9-11 Task Schedule with Scheduling Data
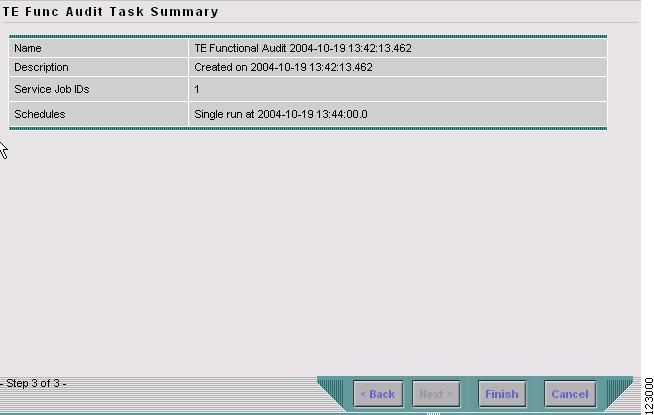
Step 11
Figure 9-12 TE Functional Audit Task Summary
Step 12
To view the task logs for the created tasks, see Viewing a Task Log, page 10-2.
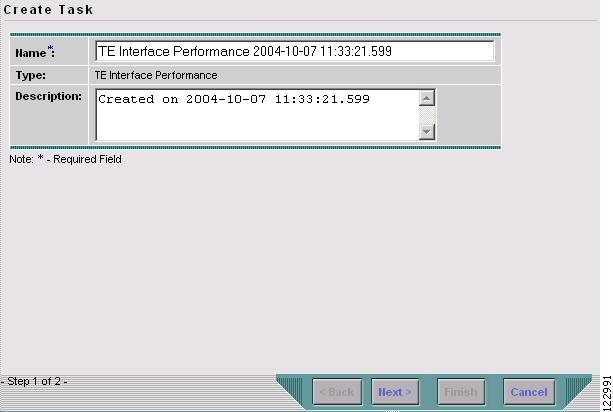
Creating a TE Interface Performance Task
This task calculates interface/tunnel bandwidth utilization using the Simple Network Management Protocol (SNMP).
Calculating utilization depends on how data is presented for the object you want to measure. Interface utilization is the primary measure used for network utilization. Because MIB-II variables are stored as counters, you must take two poll cycles and figure the difference between the two (hence, the delta used in the equation).
Three variables are required:
•
•
•
The following explains the variables used in the formulas:
•
•
•
A more accurate method is to measure the input utilization and output utilization separately, using the following formula:
delta(ifInOctets) x 8 x 100
Input utilization = ---------------------------------------------------
(number of seconds in delta) x ifSpeed
delta(ifOutOctets) x 8 x 100
Output utilization = ---------------------------------------------------
(number of seconds in delta) x ifSpeed
To create a TE Interface Performance task, use the following steps:
Step 1
Step 2
Figure 9-13 Create TE Interface Performance Task
For a detailed description of the window elements in the Create Task window, see Cisco IP Solution Center Infrastructure Reference, 4.0.
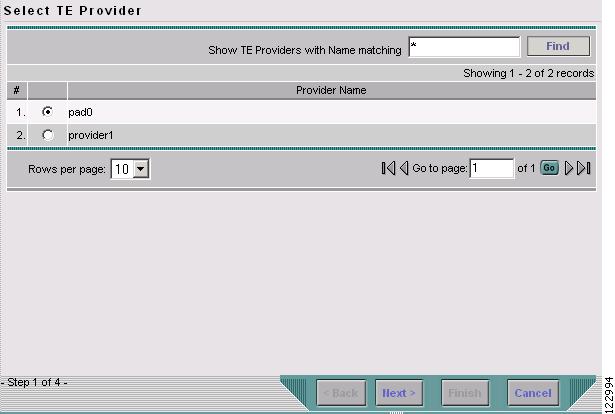
Step 3
The Select TE Provider window in Figure 9-14 appears.
Figure 9-14 Select TE Provider
Step 4
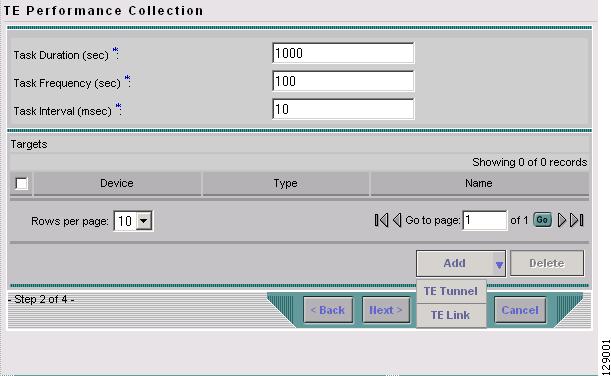
Step 5
Figure 9-15 TE Performance Collection
Step 6
Step 7
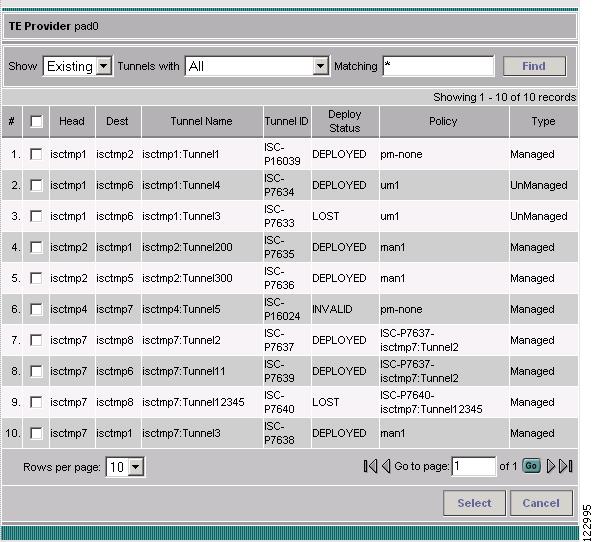
•
•
Figure 9-16 Select Tunnel(s) - Interface Performance
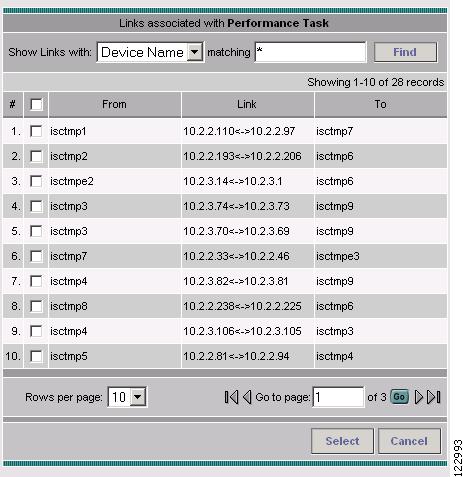
Figure 9-17 Select Link(s)
Step 8
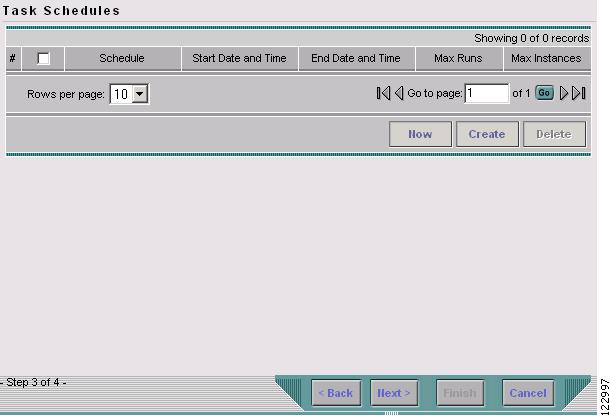
Step 9
Figure 9-18 Task Schedules
Step 10
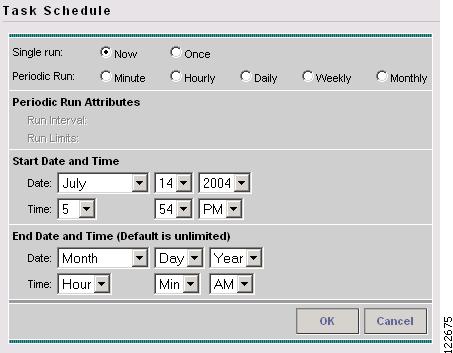
Note
Figure 9-19 Task Schedule
Step 11
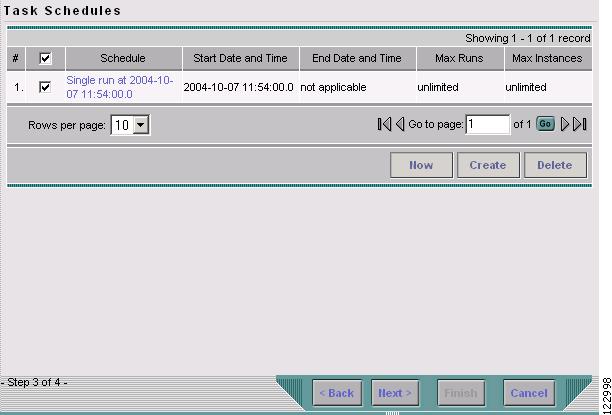
Step 12
Figure 9-20 Task Schedules with Scheduling Data
Step 13
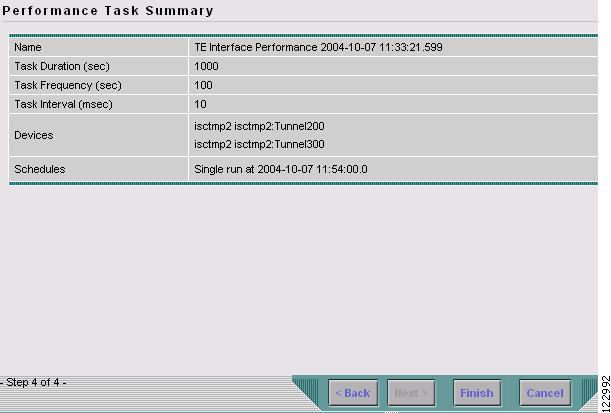
Figure 9-21 Performance Task Summary
Step 14
Figure 9-22 Performance Task Summary
To view the TE Performance Report that is generated for TE Interface Performance task(s), see TE Performance Reports, page 10-4.
To view the task logs for the created tasks, see Viewing a Task Log, page 10-2.
SR History, Config Audit Report, and Configlets
The history, config audit reports, and configlets associated with individual service requests can be viewed from the Service Requests window when you click the Details button.
The history of an SR is essentially a state change report. It lists the various states that elements associated with an SR has transitioned between and reports relevant details pertaining to these state changes.
Configlets for devices associated with SRs are in simple scrollable text format.
Manage Lock
Whenever a task is performed that incurs a database update, which might affect the resource and hence the result of a tunnel computation, it locks the system before the update and releases it at completion of the update. If for some reason the lock is not released, other updates that require the lock are blocked.
The purpose of the lock feature is to prevent concurrent and mutually inconsistent planning activities from being committed to the database. Meaning, if each user takes the same snapshot of the the repository, performs computations, and tries to commit what he/she sees, the locking mechanism helps synchronize the commit and ensures that no commit invalidates other commits.
If the system is locked for prolonged periods of time, the administrator should check if anyone is performing long planning tasks and take note of, which process locked the system and report it. If the administrator is sure that no one is using the sytem, it can be unlocked by using the lock manager.
Each system lock is linked to a TE provider. To unlock the TE provider, use the following steps:
Step 1
Step 2
Step 3
Step 4
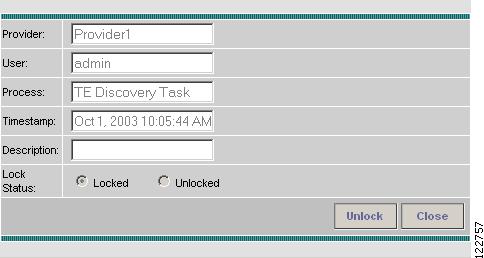
Figure 9-23 System Lock Management
The text fields in this window are read-only.
Step 5
The System Lock Management window closes and the System Lock Status field in the TE Providers window is updated accordingly.