-
Cisco Active Network Abstraction User Guide, 3.7.1
-
Preface
-
Cisco ANA Client Overview
-
Working with the Cisco ANA NetworkVision Client
-
Viewing Network Element Properties
-
Working with Cisco ANA NetworkVision Maps
-
Working with Links
-
Working with Business Tags and Business Elements
-
Working with the Cisco ANA EventVision Client
-
Tracking Faults Using Cisco ANA EventVision
-
Working with Tickets in Cisco ANA NetworkVision
-
Working with Reports
-
Using Cisco ANA PathTracer to Diagnose Problems
-
Monitoring Carrier Ethernet Services
-
Monitoring Carrier-Grade NAT Properties
-
Monitoring DWDM Properties
-
Viewing Ethernet Operations, Administration, and Maintenance Tool Properties
-
IPv6 and IPv6 VPN over MPLS
-
Monitoring MPLS Services
-
Monitoring MToP Services
-
Viewing SBC Properties
-
Icon Reference
-
Index
-
 Feedback
Table Of Contents
Viewing Network Element Properties
User Roles Required to Work with Cisco ANA NetworkVision
Viewing the Properties of a Device
Viewing VNE Communication Details
Viewing the Physical Properties of a Device
Opening the Port Utilization Graph
Viewing the Logical Properties of a Network Element
Logical Inventory Navigation Pane Branches
Logical Inventory Navigation Pane Icons
Logical Inventory Content Pane Tabs
Viewing Device Operating System Information
Viewing Network Element Properties
The following topics describe the user access roles required to use Cisco ANA NetworkVision and how to view network element physical and logical properties in any mapped network:
•
User Roles Required to Work with Cisco ANA NetworkVision
•
•
Note
•
•
•
Note
User Roles Required to Work with Cisco ANA NetworkVision
Table 3-1 identifies the roles that are required to work with Cisco ANA NetworkVision. Cisco ANA determines whether you are authorized to perform a task as follows:
•
•
For more information on user authorization, see the Cisco Active Network Abstraction 3.7.1 Administrator Guide.
Viewing the Properties of a Device
Cisco ANA NetworkVision enables you to view the properties of a selected device using the Properties window. For example, in the Properties window you can view the vendor and location of a device.
To view device properties:
Step 1
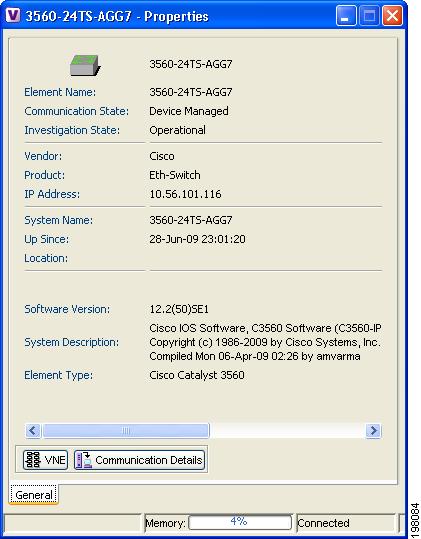
The Properties window is displayed as shown in Figure 3-1.
Figure 3-1 Properties Window
Table 3-2 describes the information displayed in the Properties window.
Table 3-2 Properties Window
Communication State
The ability of the VNE to reach the network element, according to the health of the device. For more information about communication states, see the Cisco Active Network Abstraction 3.7.1 Administrator Guide.
Investigation State
The level of network element discovery that has been performed or is being performed by the VNE. For more information about investigation states, see the Cisco Active Network Abstraction 3.7.1 Administrator Guide.
Device icon
An icon representing the device in Cisco ANA and displaying the current color associated with the device operational health. For more information on severity colors, see Network Element Status Indicators, page 2-17.
The device icon might include a badge (such as a bell or other symbol) that indicates an alarm or another item of interest associated with the device.
Vendor
The vendor name, as defined in the device MIB.
Product
The product name of the device, as defined in the device MIB; for example, Router.
Element Name
A name assigned to the element for ease of identification.
IP Address
The IP address used for managing the device.
System Name
The name of the device, as defined in the device MIB.
Up Since
The date and time the device was last reset.
Location
The physical location of the device, as defined in the device MIB.
Software Version
The software version running on the device.
Software Description
A description of the system taken from the device.
Element Type
The device type with the manufacturer's name, such as Cisco 7200.
VNE
Opens the VNE Properties dialog box, where you can edit the VNE's properties, start and stop the VNE, perform maintenance, and configure polling rates.
For more information, see:
Communication Details
Opens the Communication Details window, which displays the status of the device protocols and whether the device is sending traps and syslogs. For more information, see Viewing VNE Communication Details.
Step 2
.
Viewing VNE Properties
To view VNE properties, open the inventory window (Node > Inventory) or Properties window (Node > Properties) for the required element, and then click VNE.
If the VNE for the element has been stopped, a message is displayed at the top of the inventory window letting you know that the VNE was stopped. The message includes a Refresh button so that you can refresh the information if the VNE has restarted. If the VNE is still down when you click Refresh, a VNE Unreachable message is displayed and the inventory window is closed. For more information about starting VNEs, stopping VNEs, adding new VNEs to a network, or modifying the status of a VNE, see the Cisco Active Network Abstraction 3.7.1 Administrator Guide.
Note
The inventory window also enables you to view all tickets that are collected on the selected NE in the ticket pane. For more information, see Ticket Pane.
Viewing VNE Communication Details
To view VNE communication details:
Step 1
Step 2
Step 3
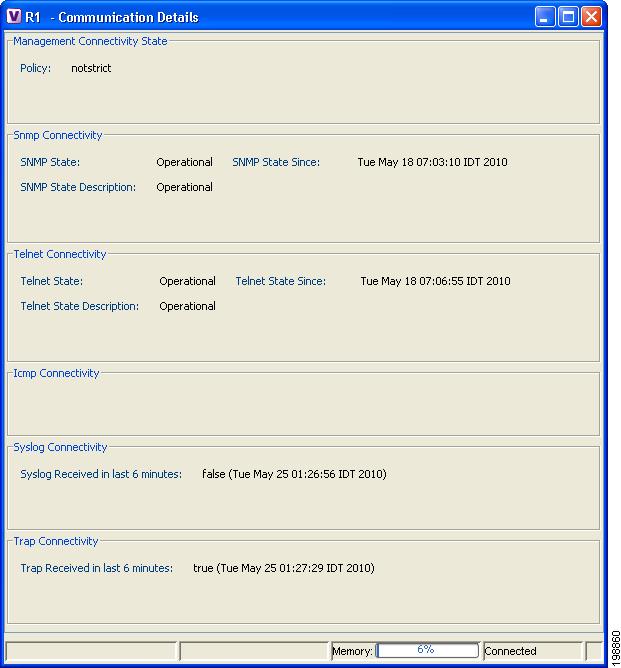
The Communication Details window is displayed as shown in Figure 3-2.
Figure 3-2 Communication Details Window
The Communication Details window provides information about:
•
•
•
•
•
•
For more information about the Communication Detail window, see the Cisco Active Network Abstraction 3.7.1 Administrator Guide.
Opening the Inventory Window
The inventory window enables you to:
•
•
•
•
•
•
•
•
•
•
For more information on specific technologies, see:
•
•
•
•
•
•
•
•
To open the inventory window, do one of the following:
•
•
•
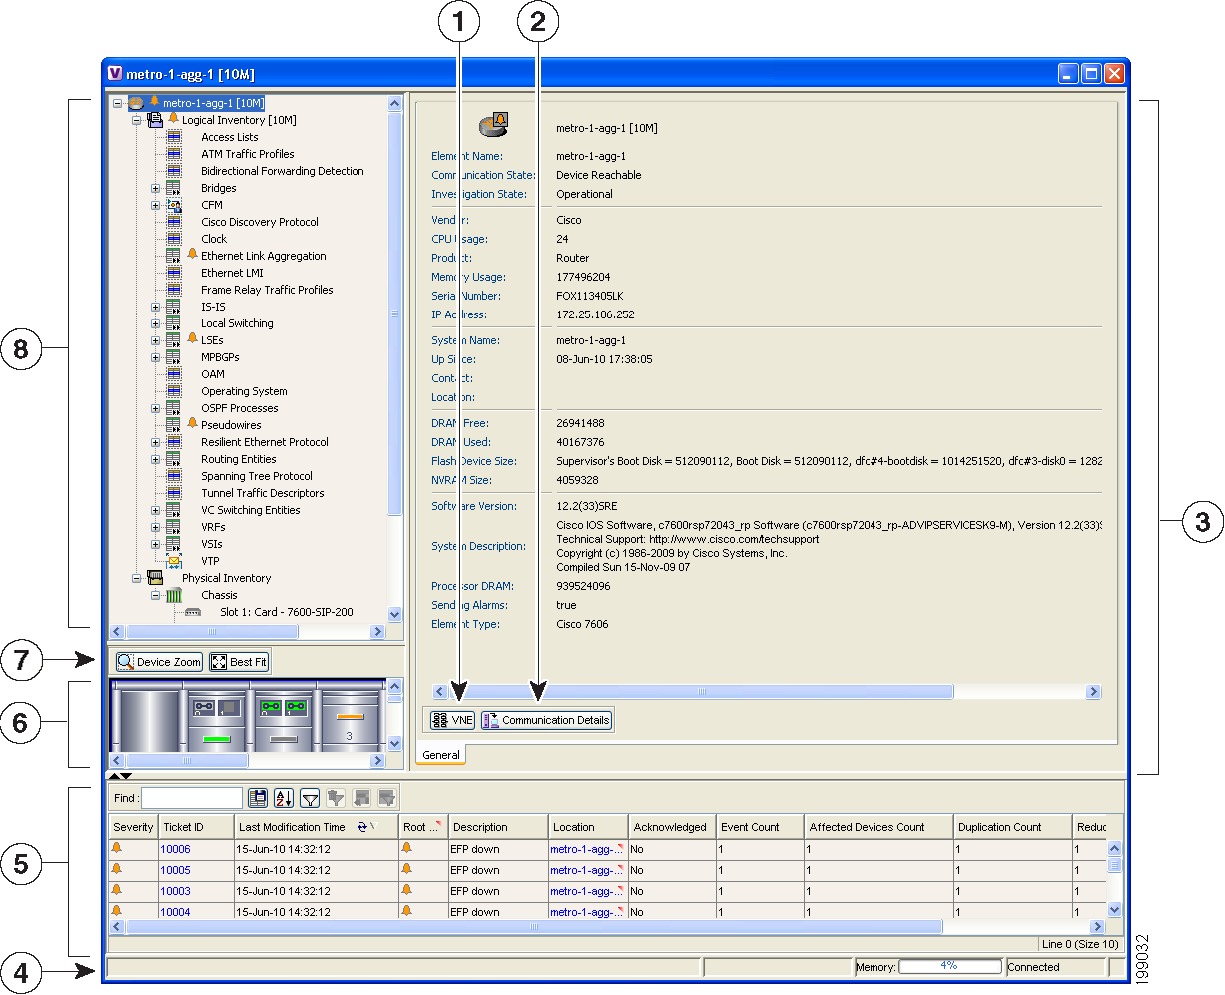
Figure 3-3 shows an example of an inventory window.
Figure 3-3 Inventory Window
VNE button
Ticket pane
Communication Details button
Device view pane
Content pane
Device view pane toolbar
Status bar
Navigation pane
The inventory window displays the physical and logical inventory for the selected item. The inventory window is divided into the following areas:
All areas displayed in the inventory window are correlated; this means that selecting an option in one area affects the information displayed in the other areas.
The information displayed in the inventory window varies according to the item selected in the navigation pane.
To view physical inventory information, open the physical inventory branch.
To view logical inventory information, open the logical inventory branch. For more information about logical inventory information, see Viewing the Logical Properties of a Network Element.
If the selected VNE is shutting down when the inventory window is opened, a Refresh button is displayed in the inventory window so you can refresh the display when the VNE is available again.
Click the top right corner to close the inventory window.
For more information about the right-click shortcut menus that are available in the inventory window, see Cisco ANA NetworkVision Shortcut Menus, page 2-29.
Navigation Pane
The navigation pane in the inventory window displays a tree-and-branch representation of the selected device and its modules. The navigation pane contains two main branches: logical inventory and physical inventory.
The logical inventory branch includes logical items related to the selected element, such as access lists, ATM traffic profiles, and routing entities. The physical inventory branch includes the different NE components, such as chassis, cards, subslots, and so on. When you select an NE component in the navigation pane, the information displayed in the content pane is updated. The branches in the navigation pane can be expanded and collapsed to display and hide information as needed.
The window heading and the highest level in the navigation pane display the name of the VNE given to the device as defined in Cisco ANA Manage. The highest level in the navigation pane also displays the device icon and status.
The color of the device icon in the navigation pane reflects its operational health and is the same as the color of the NE component in the device view panel. For more information about indicators of operational health and status, see Network Element Status Indicators, page 2-17.
You can attach a business tag to an NE component by right-clicking it and then choosing Attach Business Tag. For more information about business tags, see Chapter 6, "Working with Business Tags and Business Elements."
For more information about the right-click menus that are available, see Cisco ANA NetworkVision Shortcut Menus, page 2-29.
Device View Pane
The device view pane enables you to visually locate NEs in the chassis and identify their status. All occupied slots in the chassis are rendered in the device view pane. If a port is down, it is shown in red in both the navigation pane and the device view pane, allowing you to quickly pinpoint the problem.
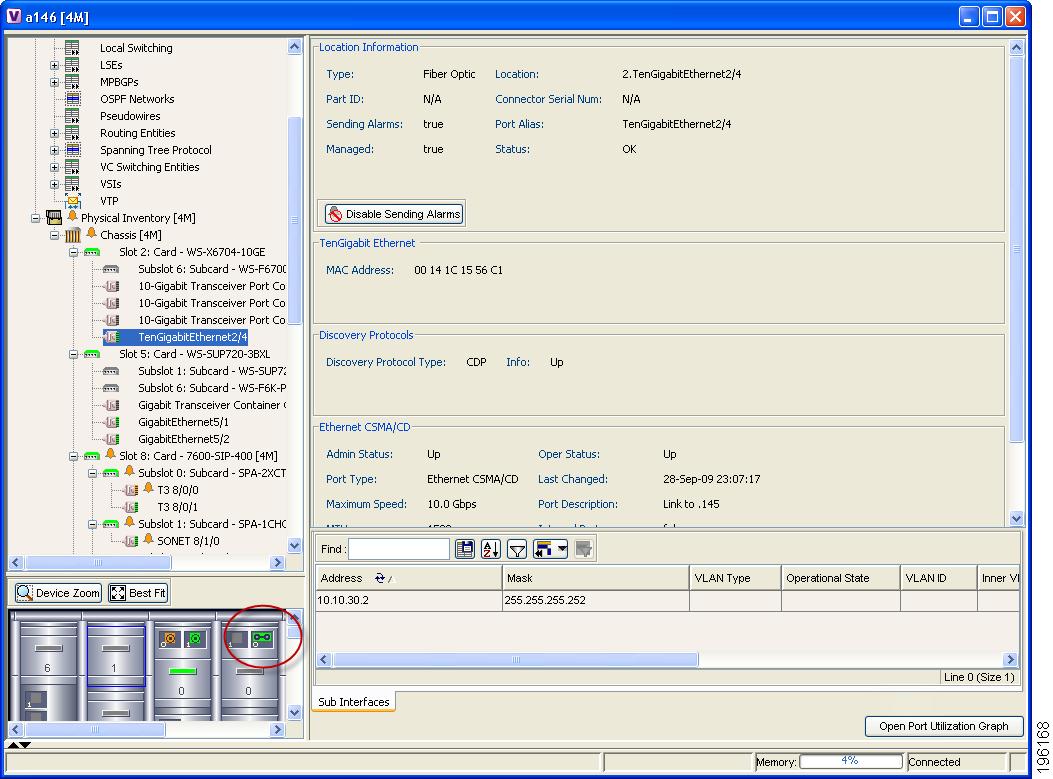
Figure 3-4 provides an example of the device view pane for a Cisco device. The four slots in the device view pane correspond to the four slots in the physical inventory navigation pane. If you click a port in the device view pane (see the circled port), Cisco ANA displays both the element's properties and its location in the physical inventory.
Figure 3-4 Device View Pane
Device View Pane Toolbar
The inventory window contains the following tools for working with the device view pane:
Ticket Pane
The ticket pane is displayed at the bottom of the inventory window. The tickets displayed relate to the element selected in the navigation pane. For more information about the ticket pane, see Ticket Pane, page 2-15.
Note
Content Pane
The content pane contains physical or logical inventory information specific to the item you select in the navigation pane or device view panel; for example, chassis or port information.
The content pane can also display context-sensitive tabs and toolbars; the tools displayed depend on your selection in the navigation pane or device view panel. For example, when an ATM port is selected, the Show VC Table tool is displayed on the toolbar.
In addition, you can view the properties of a row in a table by double-clicking the row in the table or by right-clicking it and choosing Properties.
For information about tables that appear in the content pane, see Working with Cisco ANA Tables, page 2-40.
Viewing the Physical Properties of a Device
Each device that is managed by Cisco ANA is modeled in the same manner. The physical inventory reflects the physical components of the managed network element. Cisco ANA NetworkVision enables you to view physical inventory information for the following entities:
•
•
•
•
•
•
Table 3-3 identifies the icons used to display physical inventory components in the navigation pane.
Table 3-3 Physical Inventory Icons
Chassis
Shelf
Slot/Subslot
Port/Logical Port
Unmanaged Port
Pluggable transceiver modules on Cisco equipment are displayed in a three-level hierarchy:
Container object
Module (such as an SFP container)
Port (such as an SFP or GBIC port)
Physical inventory is continuously updated for both status and configuration. The addition of a new card, the removal of a card, or any change to the device is reflected by the VNE and updated instantly.
For Cisco CRS devices only, fans and power supplies are displayed in physical inventory if they are field replacable units (FRUs). The manner in which the fans are displayed depends on whether the fans are separable or not:
•
•
The system also includes built-in system properties for each network element. This includes information such as MAC address, maximum transmission unit (MTU), and media type.
Note
The information displayed in the content area changes according to the device type, device, and component selected in the navigation pane.
The following buttons might be displayed in the inventory window for physical inventory:
•
•
•
•
•
•
For information about configuring topology from a port, see Adding Static Links, page 5-12.
For a detailed description of device properties, see Viewing the Properties of a Device.
Opening the Port Utilization Graph
Cisco ANA NetworkVision enables you to view the Rx/Tx Rate and Rx/Tx Rate History of a port.
Note
•
To view port utilization statistics:
Step 1
Step 2
The following information is displayed in the Port Statistics dialog box:
•
•
•
•
Step 3
Managing Port Alarms
You can enable or disable the alarms on a selected port. By default, alarms are enabled on all ports. When the alarms are disabled on a port, no alarms are generated for the port and they are not displayed in the ticket pane.
Disabling Alarms
To disable alarms:
Step 1
Step 2
•
•
The Sending Alarms field in the Location Information section of the content pane displays the value false. This indicates that the alarm for the required port has been disabled. In addition, the toolbar in the content pane displays the Enable Sending Alarms tool.
Enabling Alarms
You can enable the alarms on a port at any time.
To enable alarms:
Step 1
Step 2
The Sending Alarms field in the Location Information section of the content pane displays the value true. This indicates that the alarm for the required port has been enabled. In addition, the toolbar in the content pane now displays the Disable Sending Alarms tool.
Viewing the Logical Properties of a Network Element
Cisco ANA NetworkVision enables you to view logical inventory information. Cisco ANA maintains logical inventory for each device. The logical inventory reflects dynamic data such as configuration data, forwarding, and service-related components that affect traffic handling in the device.
The information displayed in the inventory window changes according to the device type and branch selected in the navigation pane.
Logical Inventory Window
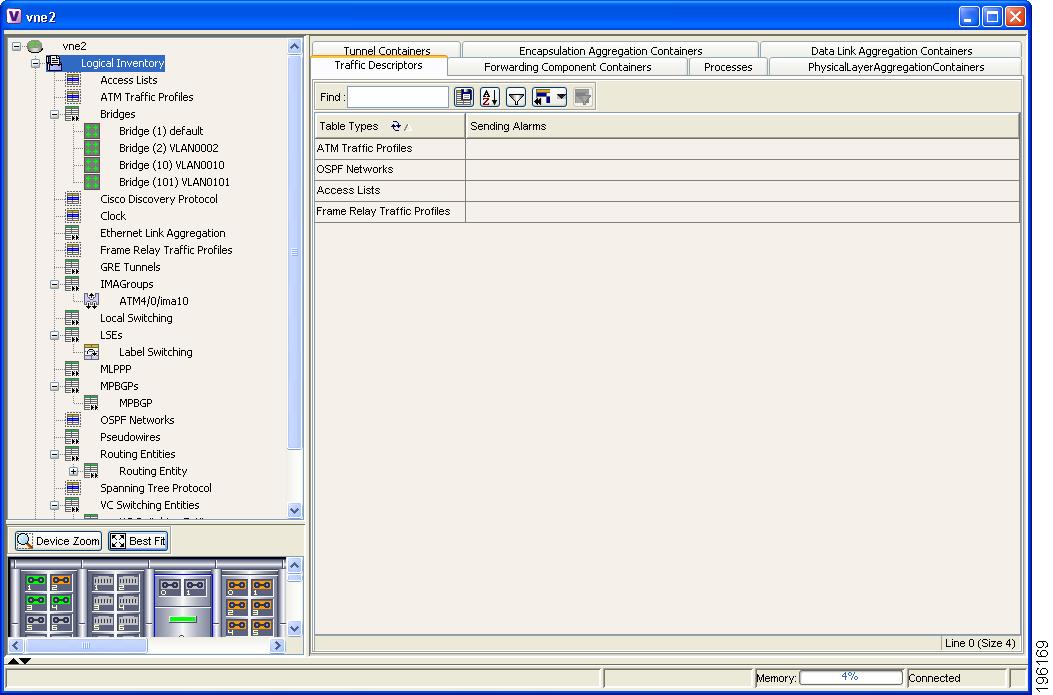
Logical inventory information is displayed in the inventory window as shown in Figure 3-5.
Figure 3-5 Logical Inventory Information Displayed in the Inventory Window
Note
Logical Inventory Navigation Pane Branches
Table 3-4 describes the branches that appear in the logical inventory navigation pane.
Logical Inventory Navigation Pane Icons
Table 3-5 describes the icons used in the logical inventory navigation pane.
Logical Inventory Content Pane Tabs
Table 3-6 describes the tabs that can appear in the logical inventory content pane, depending on your selection in the navigation pane.
Viewing Device Operating System Information
Cisco ANA discovers and automatically displays operating system information for Cisco IOS and Cisco IOS XR devices in logical inventory.
To view operating system information for Cisco IOS or Cisco IOS XR devices:
Step 1
Step 2
Table 3-7 describes the information that is displayed for the Cisco IOS operating system:
Step 3
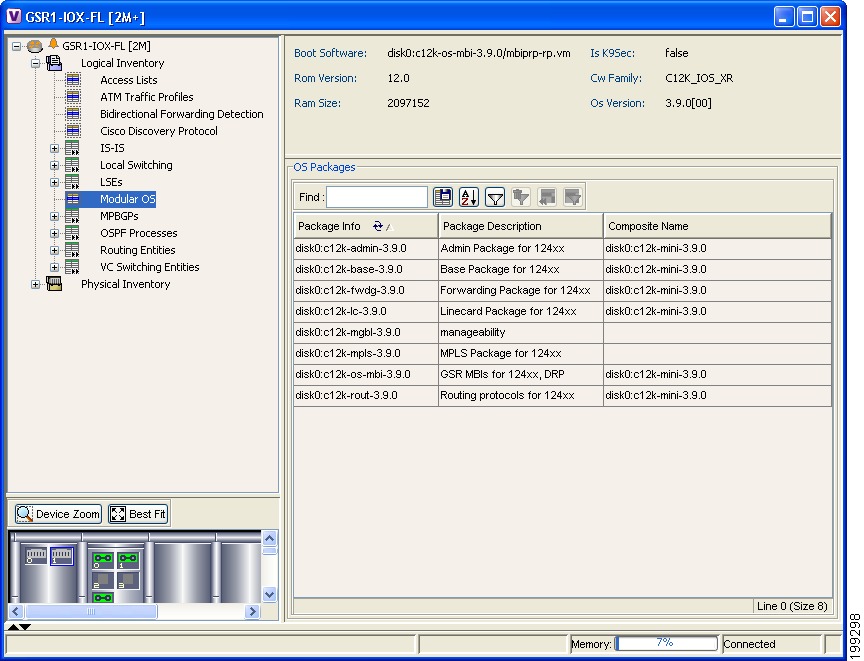
Figure 3-6 shows an example of the information that is displayed for Cisco IOS XR devices.
Figure 3-6 Modular OS Information in Logical Inventory
Table 3-8 describes the information that is displayed for Cisco IOS XR system.
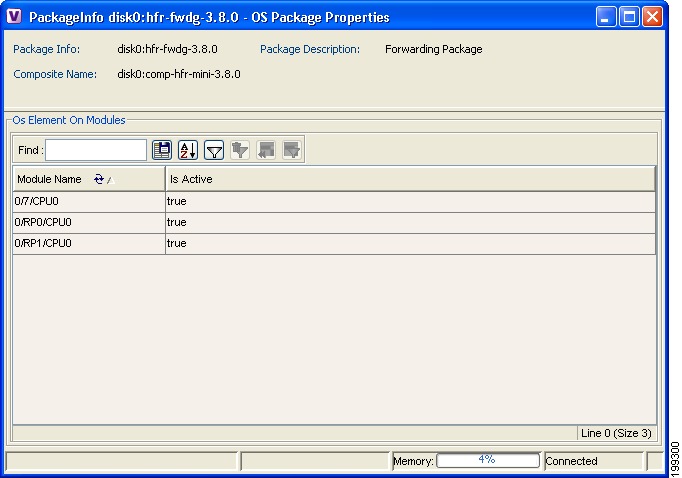
Step 4
The OS Package Properties window is displayed as shown in Figure 3-7.
Figure 3-7 OS Package Properties Window
Table 3-9 describes the information displayed in the OS Package Properties window.