-
Cisco Active Network Abstraction User Guide, 3.7.1
-
Preface
-
Cisco ANA Client Overview
-
Working with the Cisco ANA NetworkVision Client
-
Viewing Network Element Properties
-
Working with Cisco ANA NetworkVision Maps
-
Working with Links
-
Working with Business Tags and Business Elements
-
Working with the Cisco ANA EventVision Client
-
Tracking Faults Using Cisco ANA EventVision
-
Working with Tickets in Cisco ANA NetworkVision
-
Working with Reports
-
Using Cisco ANA PathTracer to Diagnose Problems
-
Monitoring Carrier Ethernet Services
-
Monitoring Carrier-Grade NAT Properties
-
Monitoring DWDM Properties
-
Viewing Ethernet Operations, Administration, and Maintenance Tool Properties
-
IPv6 and IPv6 VPN over MPLS
-
Monitoring MPLS Services
-
Monitoring MToP Services
-
Viewing SBC Properties
-
Icon Reference
-
Index
-
 Feedback
Table Of Contents
Monitoring Carrier Ethernet Services
User Roles Required to Work with Carrier Ethernet Services
Viewing Link Layer Discovery Protocol Properties
Viewing Spanning Tree Properties
Viewing Resilient Ethernet Protocol Properties
Working with Ethernet Link Aggregation Groups
Viewing Ethernet LAG Properties
Viewing Provider Backbone Bridge Properties
Understanding EFP Severity and Ticket Badges
Viewing EVC Service Properties
Viewing Virtual Switching Instance Properties
Viewing VPLS Core or Access Pseudowire Endpoint Properties
Viewing VPLS Access Ethernet Flow Point Properties
Viewing and Renaming Ethernet Flow Domains
Working with VLANs and VLAN Overlays
Switching Entities Containing Termination Points
Viewing Associated Network VLAN Service Links and VLAN Mapping Properties
Viewing VLAN Links Between VLAN Elements and Devices
Adding a VLAN Overlay to a Map View
Displaying or Hiding VLAN Overlays
Viewing VLAN Service Link Properties
Viewing REP Information in VLAN Domain Views and VLAN Overlays
Viewing REP Properties for VLAN Service Links
Viewing STP Information in VLAN Domain Views and VLAN Overlays
Viewing STP Properties for VLAN Service Links
Viewing VLAN Trunk Group Properties
Viewing VLAN Bridge Properties
Understanding Unassociated Bridges
Working with Ethernet Flow Point Cross-Connects
Viewing EFP Cross-Connect Properties
Working with VPLS and H-VPLS Instances
Adding VPLS Instances to a Map
Viewing Pseudowire Tunnel Links in VPLS Overlays
Viewing VPLS-Related Properties
Viewing VPLS Instance Properties
Working with Pseudowires and Pseudowire Overlays
Displaying Pseudowire Information
Working with Ethernet Services
Adding Ethernet Services to a Map
Using Ethernet Service Overlays
Viewing Ethernet Service Properties
Viewing IP SLA Responder Service Properties
Monitoring Carrier Ethernet Services
The following topics describe how you can use Cisco ANA to monitor Carrier Ethernet services:
•
User Roles Required to Work with Carrier Ethernet Services
•
•
•
•
•
•
•
•
•
•
•
•
•
•
•
•
User Roles Required to Work with Carrier Ethernet Services
Table 12-1 identifies the roles that are required to work with to Carrier Ethernet services in Cisco ANA NetworkVision. Cisco ANA determines whether you are authorized to perform a task as follows:
•
•
For more information on user authorization, see the Cisco Active Network Abstraction 3.7.1 Administrator Guide.
Table 12-1 Default Permission/Security Level Required for Working with Carrier Ethernet Services
Add unassociated bridges
—
—
X
X
X
Add EFP cross-connects
—
—
X
X
X
View EFP cross-connect properties
Partial1
Partial1
Partial1
Partial1
X
Rename Ethernet flow domains
X
X
X
X
X
View EFD properties
—
—
—
—
X
View EFP properties
—
—
—
—
X
View Ethernet flow domains
X
X
X
X
X
View Ethernet LAG properties
—
—
—
—
X
View LAG link discovery information
—
—
—
—
X
Add Ethernet services to a map
—
—
X
X
X
Add Ethernet service overlays
X
X
X
X
X
View Ethernet service properties
X
X
X
X
X
Add pseudowires to a map
—
—
X
X
X
Apply pseudowire overlays
X
X
X
X
X
View EVC service properties
—
—
—
—
X
View pseudowire properties
Partial2
Partial2
Partial2
Partial2
X
View REP information in VLAN domain views and VLAN overlays
—
—
—
—
X
View REP properties
—
—
—
—
X
View REP properties for VLAN service links
—
—
—
—
X
View STP information in VLAN domain views and VLAN overlays
—
—
—
—
X
View STP properties
—
—
—
—
X
View STP properties for VLAN service links
—
—
—
—
X
Add VLANs to a map
—
—
X
X
X
Remove VLANs from a map
—
—
X
X
X
View associated VLAN network VLAN service links and VLAN mapping properties
—
—
—
—
X
View VLAN bridge properties
—
—
—
—
X
View VLAN mappings
—
—
—
—
X
View VLAN trunk group properties
—
—
—
—
X
Add VLAN overlays to a map
X
X
X
X
X
Display or hide VLAN overlays
X
X
X
X
X
Remove VLAN overlays
X
X
X
X
X
Add VPLS instances to a map
—
—
X
X
X
Use VPLS instance overlays
X
X
X
X
X
View VPLS access EFP properties
—
—
—
—
X
View VPLS core or access pseudowire endpoint properties
—
—
—
—
X
View VPLS instance properties
X
X
X
X
X
View VSI properties
—
—
—
—
X
View CDP properties
—
—
—
—
X
View IP SLA responder service properties
—
—
—
—
X
View IS-IS properties
—
—
—
—
X
View Link Layer Discovery Protocol (LLDP) properties
—
—
—
—
X
View OSPF properties
—
—
—
—
X
View Provider Backbone Bridge (PBB) properties
—
—
—
—
X
1 The user with this role can view EFP cross-connect properties, but not local switching properties configured on an element unless the element is in the user's scope.
2 The user with this role can view properties for individual pseudowires added to a map, but not for pseudowire endpoint properties configured on an element unless the element is in the user's scope.
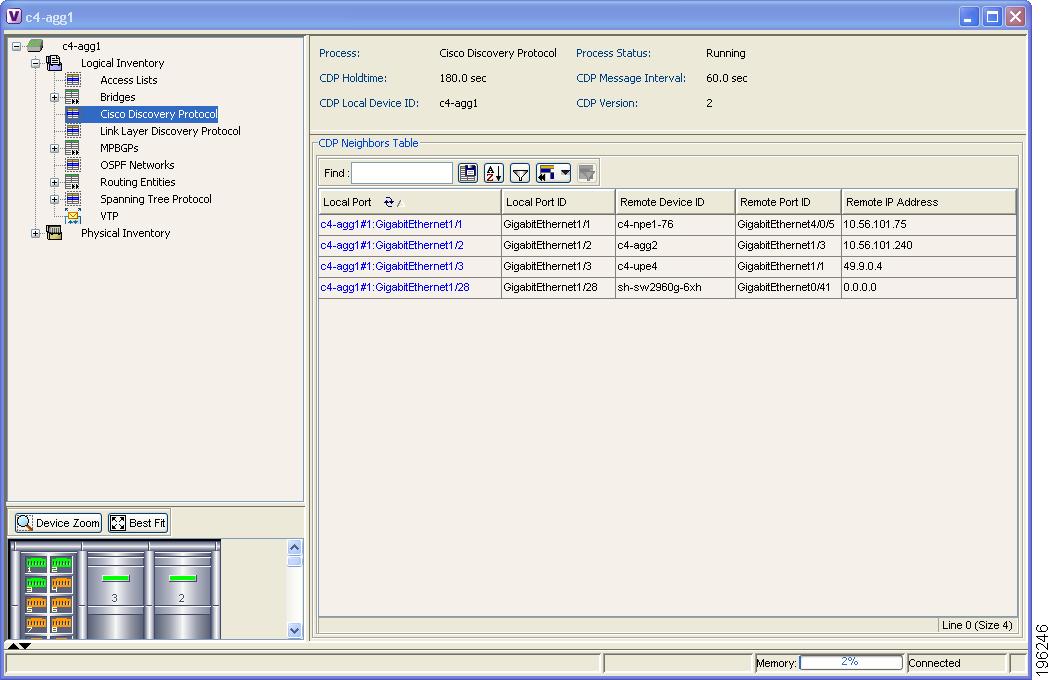
Viewing CDP Properties
Cisco Discovery Protocol (CDP) is primarily used to obtain protocol addresses of neighboring devices and discover the platform of those devices.
To view CDP properties:
Step 1
Step 2
The CDP properties are displayed in logical inventory as shown in Figure 12-1.
Figure 12-1 CDP in Logical Inventory
Table 12-2 describes the CDP instance properties that are displayed.
Step 3
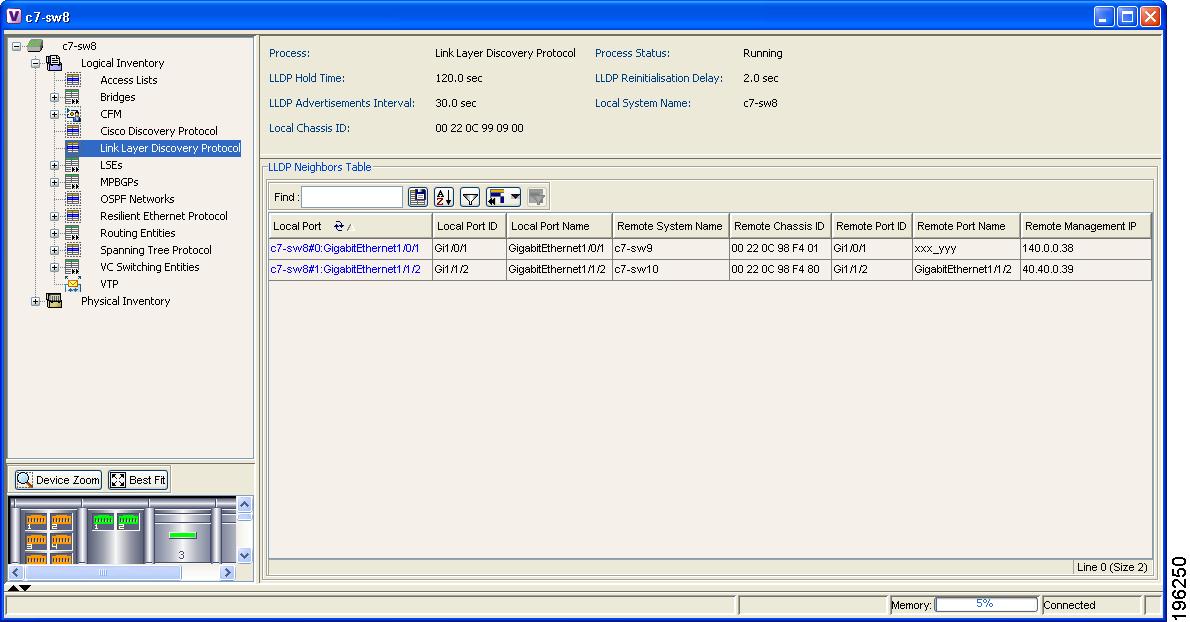
Viewing Link Layer Discovery Protocol Properties
LLDP stores and maintains the local device information, including a list of devices directly connected to the device.
In Logical Inventory
To view LLDP properties:
Step 1
Step 2
The LLDP properties are displayed in logical inventory as shown in Figure 12-2.
Figure 12-2 LLLD in Logical Inventory
Table 12-3 describes the properties that are displayed for LLDP.
Step 3
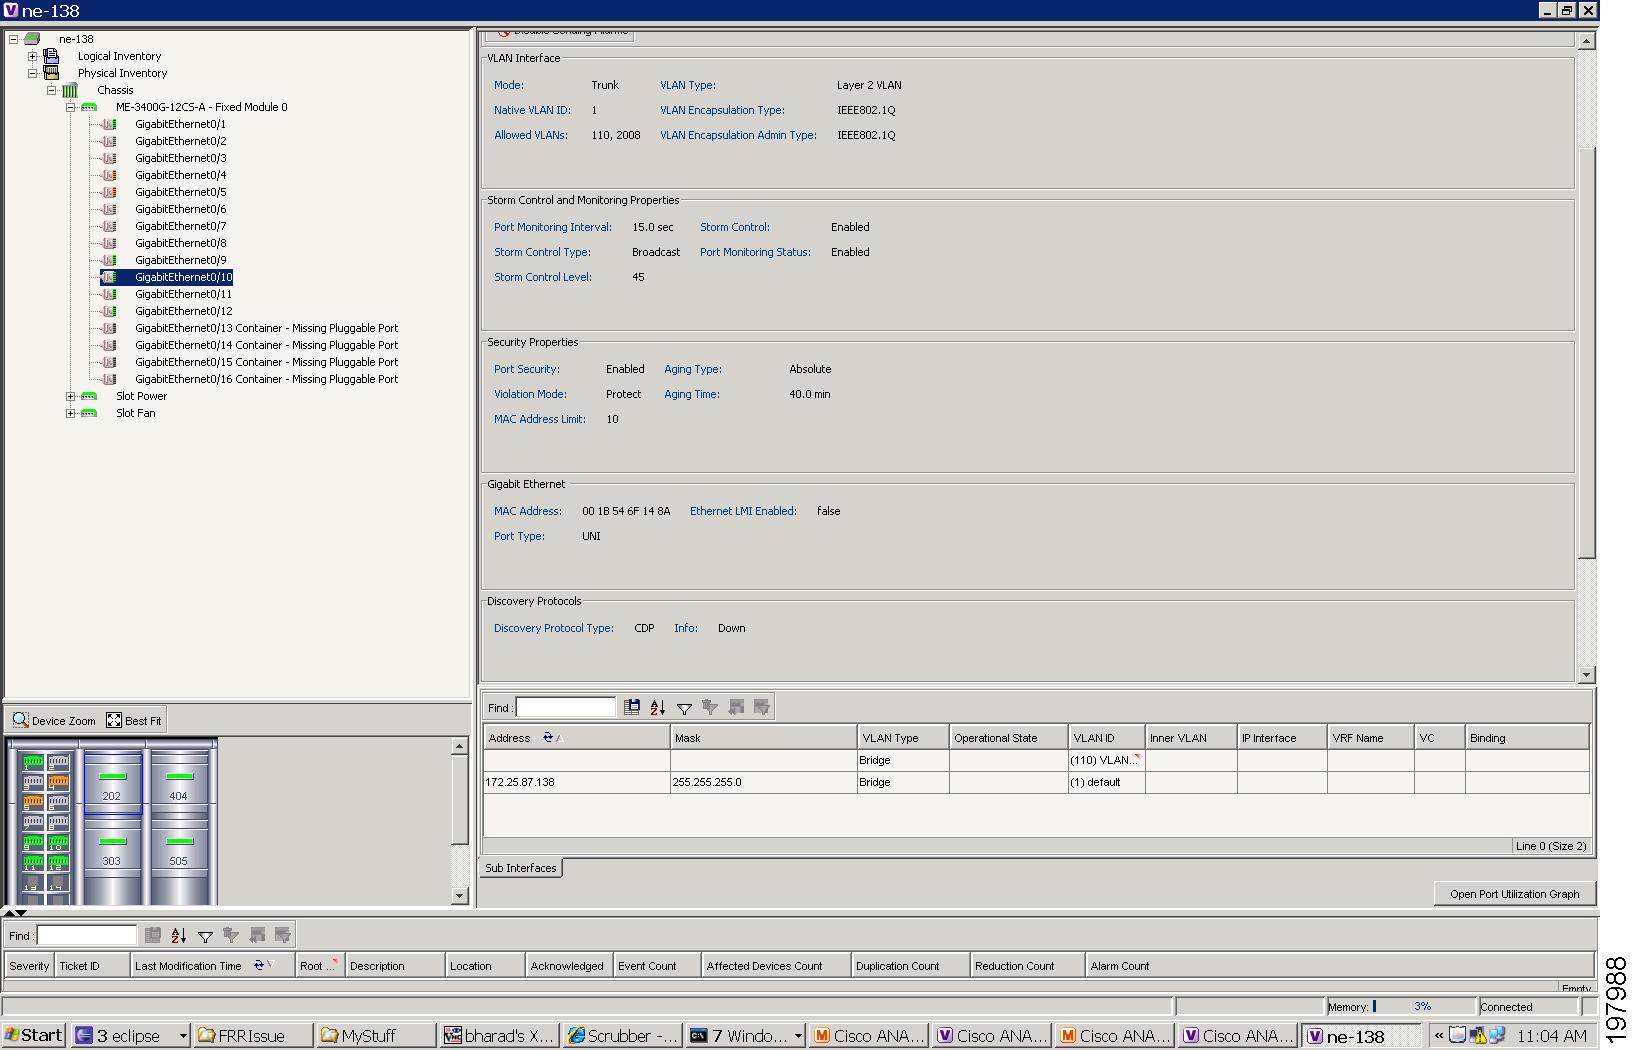
In Physical Inventory
To view LLDP on a Layer 2 port:
Step 1
Step 2
The LLDP information is displayed in the Discovery Protocols area in the Cisco ANA NetworkVision content pane:
•
•
Step 3
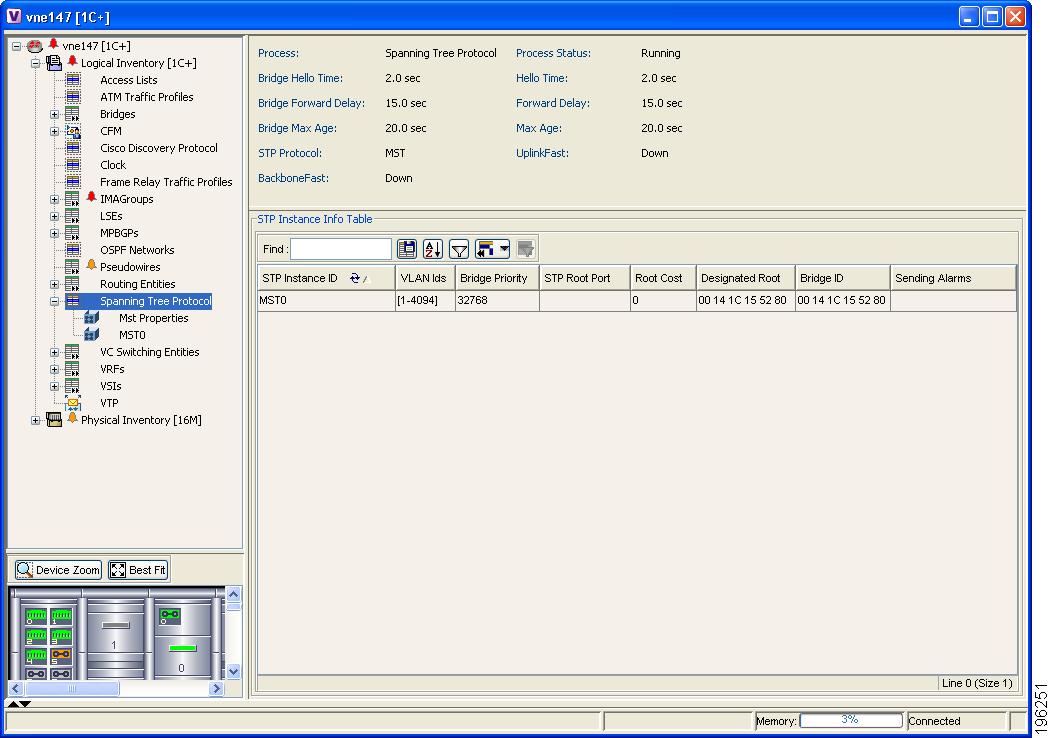
Viewing Spanning Tree Properties
STP is a link management protocol that provides path redundancy while preventing undesirable loops in the network.
To view Spanning Tree properties:
Step 1
Step 2
Step 3
Figure 12-3 STP in Logical Inventory
Table 12-4 describes the properties that are displayed for STP.
Step 4
Table 12-5 describes the information that is displayed in the STP Instance Information Properties window.
Step 5
The following topics describe how to view STP properties related to:
•
•
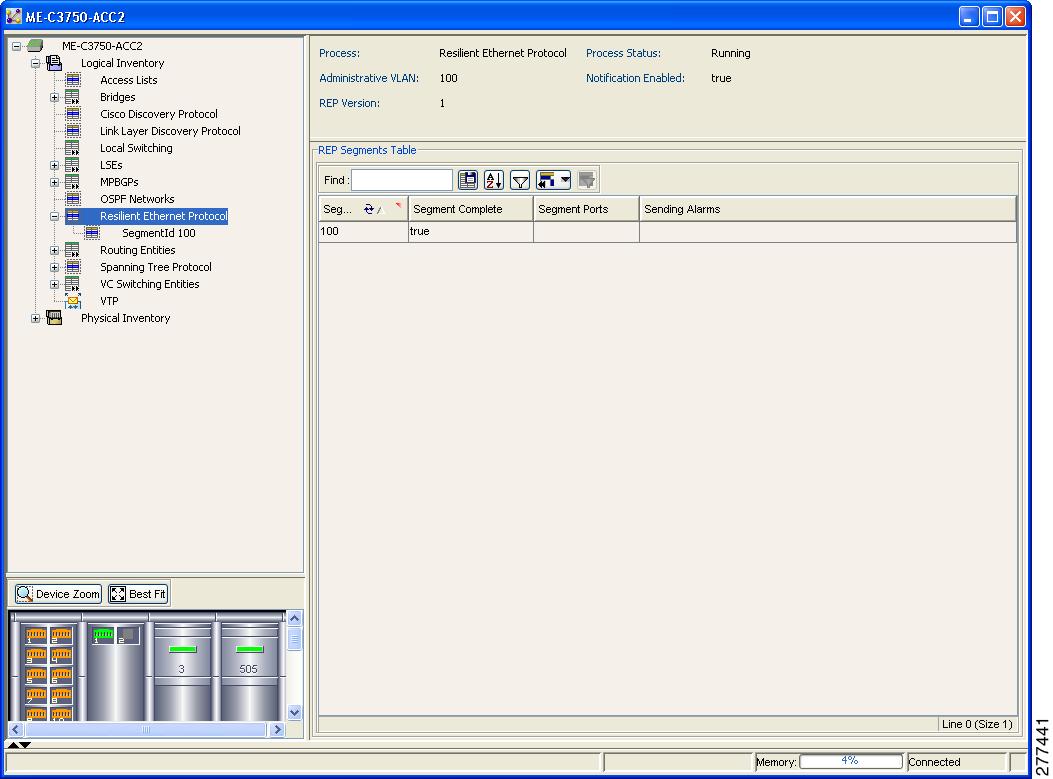
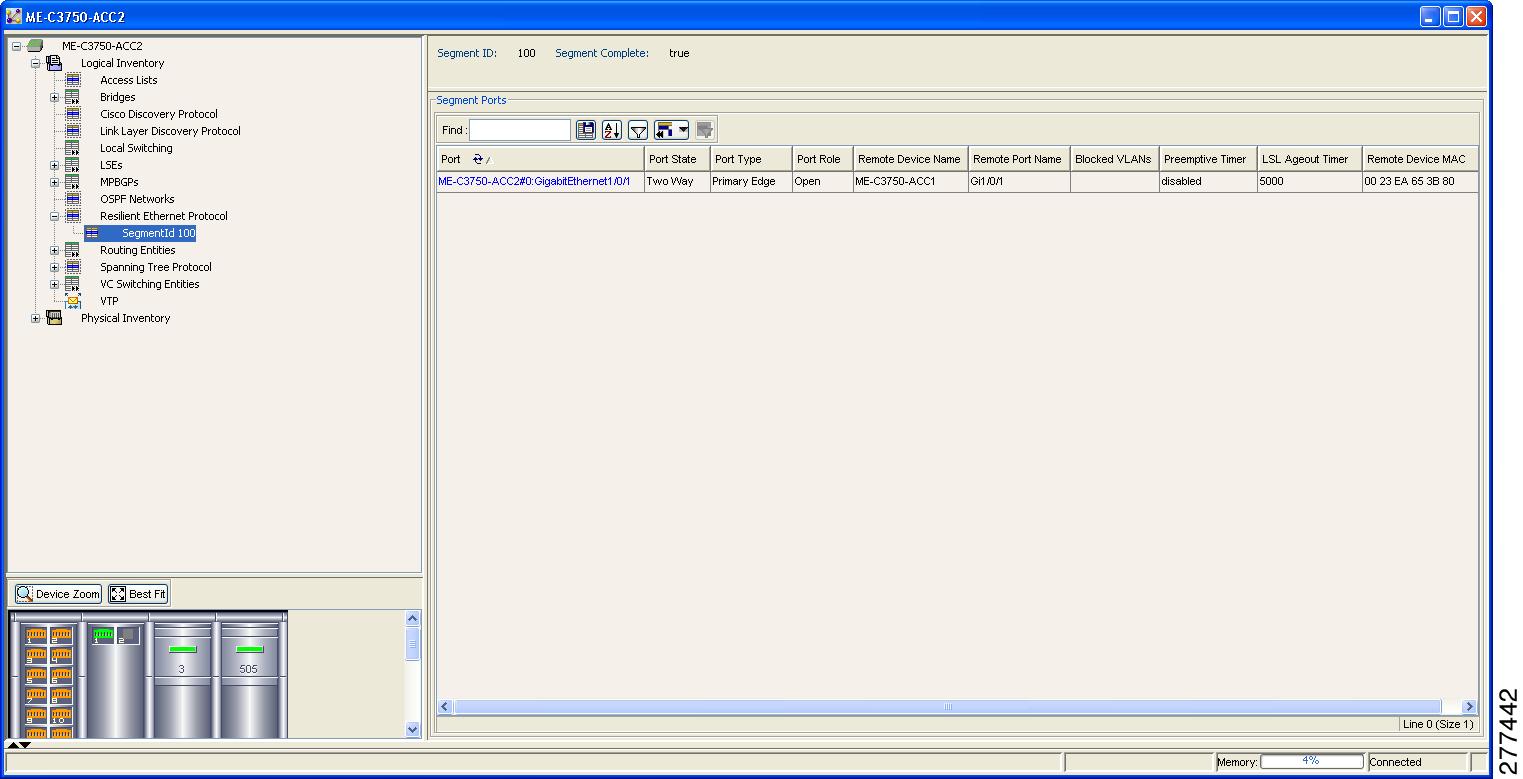
Viewing Resilient Ethernet Protocol Properties
Cisco Resilient Ethernet Protocol (REP) technology is implemented on Cisco Carrier Ethernet switches and intelligent service edge routers. REP is a segment protocol, and a REP segment is a chain of ports connected to each other and configured with the same segment identifier. Each end of a segment terminates on an edge switch. The port where the segment terminates is called the edge port.
To view REP properties in logical inventory:
Step 1
Step 2
Figure 12-4 shows an example of REP in logical inventory.
Figure 12-4 REP in Logical Inventory
Table 12-6 describes the information that is displayed for REP.
Step 3
Figure 12-5 shows an example of REP segment properties in logical inventory.
Figure 12-5 REP Segment Properties
Table 12-7 describes the information that is displayed for REP segments.
Step 4
The following topics describe how to view REP properties related to VLANs:
•
•
Working with Ethernet Link Aggregation Groups
Ethernet link aggregation groups (LAGs) provide the ability to treat multiple switch ports as one switch port. The port groups act as a single logical port for high-bandwidth connections between two network elements. A single link aggregation group balances the traffic load across the links in the channel.
Beginning with Cisco ANA 3.7.1:
•
•
If a physical link within the link aggregation group fails, the following actions occur:
•
Most protocols operate over single ports or aggregated switch ports and do not recognize the physical ports within the port group.
•
The aggregation service alarm indicates the percentage of links within the aggregation that have failed. For example, if an Ethernet link aggregation group contains four Ethernet links and one fails, the aggregation service alarm indicates that 25% of the links are down.
Viewing Ethernet LAG Properties
To view properties for Ethernet link aggregation groups:
Step 1
Step 2
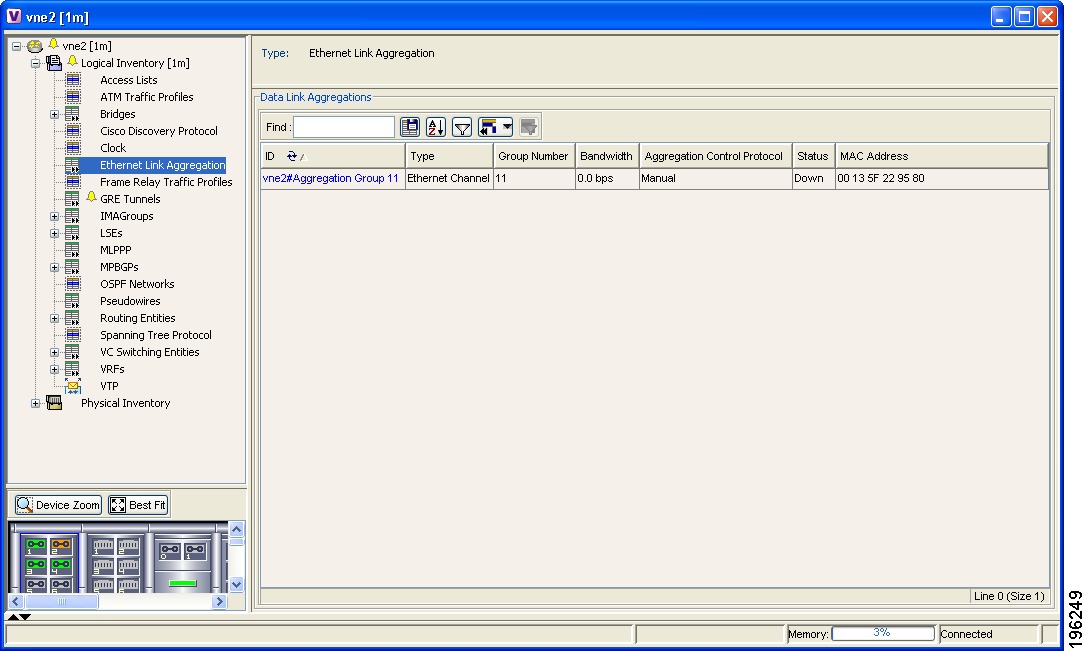
The link aggregation properties are displayed as shown in Figure 12-6.
Figure 12-6 Ethernet Link Aggregation in Logical Inventory
Table 12-8 describes the aggregation group properties that are displayed in the Data Link Aggregations table.
Step 3
The information that is displayed depends on the type of aggregation:
•
•
Step 4
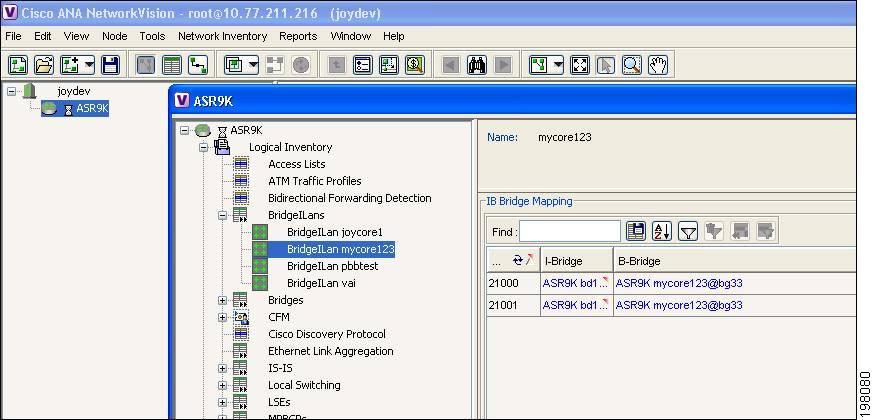
Viewing Provider Backbone Bridge Properties
Provider backbone bridges (PBBs), specified by IEEE 802.1ah-2008, provide a way to increase the number of service provider supported Layer 2 service instances beyond the number supported by QinQ and VPLS. PBB adds a backbone VLAN tag and backbone destination and source MAC addresses to encapsulate customer Ethernet frames and create a MAC tunnel across core switches.
Cisco ANA supports PBB inventory discovery and modeling for the following devices:
•
•
Cisco ANA models the IB type of Backbone edge bridges which includes both I-type and B-type components.
To view PBB properties:
Step 1
Step 2
Figure 12-7 shows an example of PBB properties in logical inventory.
Figure 12-7 PBB Properties in Logical Inventory
Table 12-11 describes the information displayed for PBB.
Viewing EFP Properties
Cisco ANA provides information about EFPs in a number of ways. For example:
•
•
To view additional EFP properties:
Step 1
•
•
The EFP Properties window displays the information described in Table 12-12.
Step 2
•
•
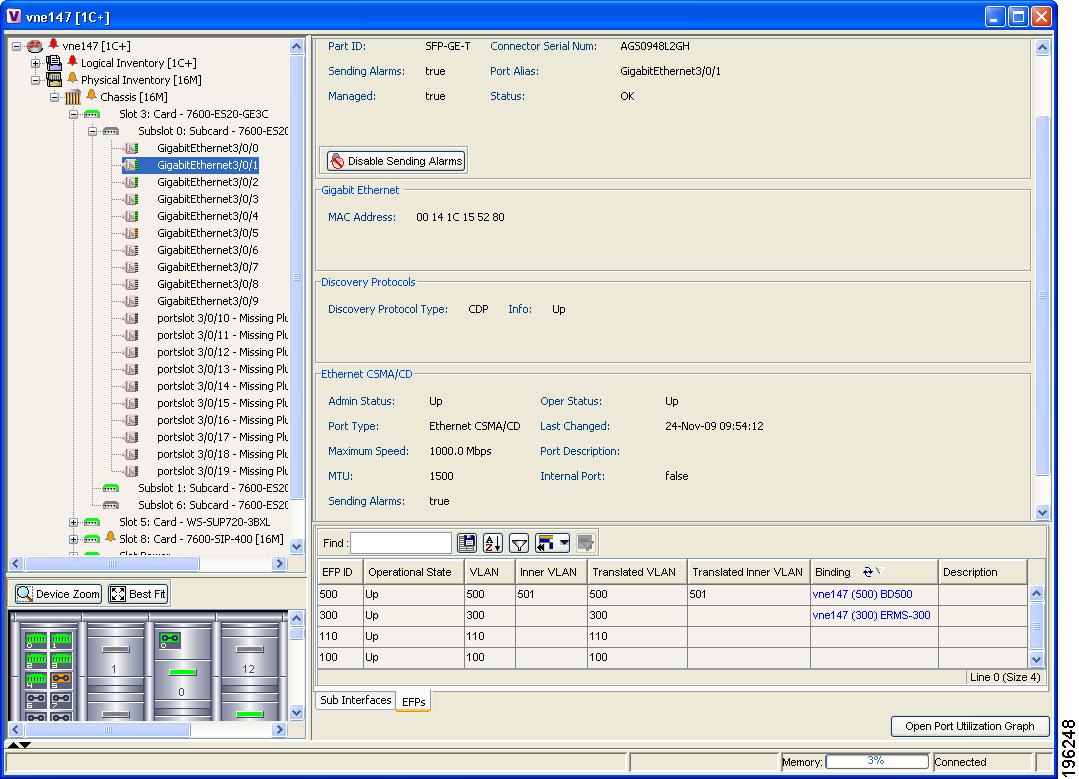
The EFPs tab is displayed in the content pane next to the Subinterfaces tab as shown in Figure 12-8.
Figure 12-8 EFPs Tab in Physical Inventory
Table 12-13 describes the information displayed in the EFPs tab.
Understanding EFP Severity and Ticket Badges
Severity and ticket badges are displayed on EFP icons as follows:
•
Figure 12-9 EFP Severity and Ticket Badges Based on Underlying Service Instance
•
Figure 12-10 EFP Severity and Ticket Badges Based on Corresponding Port
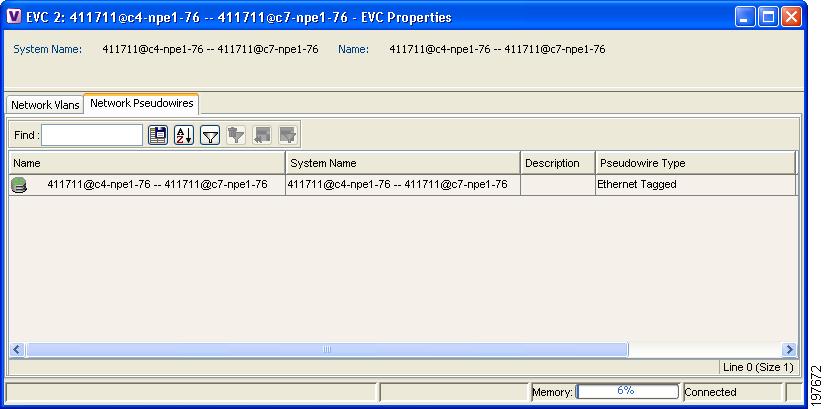
Viewing EVC Service Properties
Certain EVC service properties are configured as port attributes. These attributes determine the degree of service transparency and protect the service provider's network from protocol control traffic. Cisco ANA discovers these key EVC service properties and displays this information in physical inventory for the following devices:
•
•
To view EVC port-related properties for the supported devices and software versions:
Step 1
Step 2
Figure 12-11 shows an example of a port in physical inventory configured with these EVC properties.
Figure 12-11 EVC Port Properties in Physical Inventory
Table 12-14 describes the information displayed for these properties.
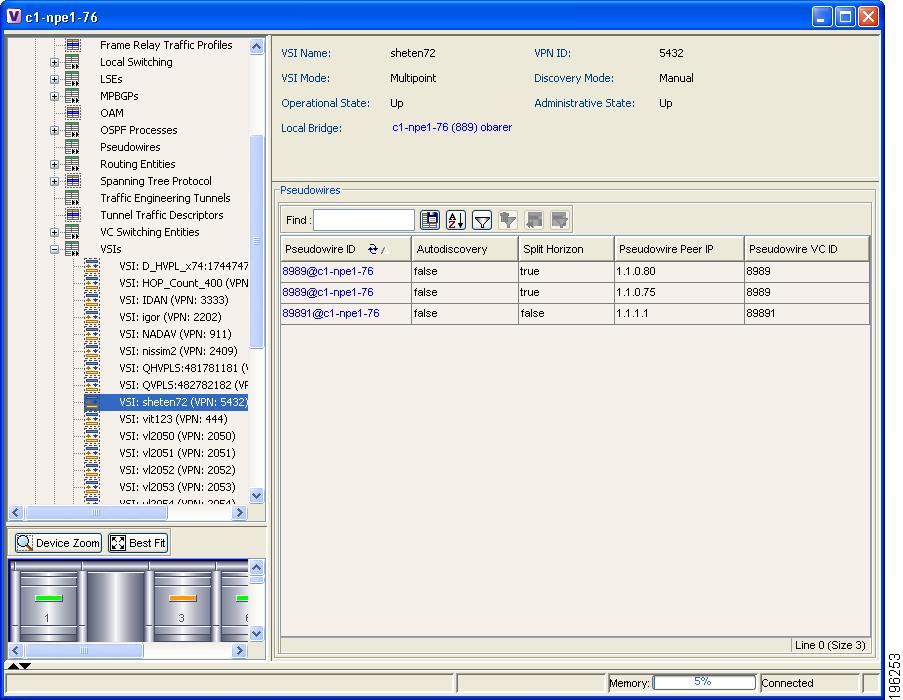
Viewing Virtual Switching Instance Properties
To view VSI properties in Cisco ANA NetworkVision, open the VSI properties window in either of the following ways:
•
•
Figure 12-12 VPLS Forward in Cisco ANA NetworkVision Navigation Pane
The first option opens the inventory window, while the second option opens a standalone VSI Properties window. The information that is displayed is the same for both options.
VSI properties are displayed as shown in Figure 12-13.
Figure 12-13 VSI Properties in Logical Inventory
Table 12-15 describes the information that is displayed for the selected VSI.
Viewing VPLS Core or Access Pseudowire Endpoint Properties
Pseudowire endpoints are displayed under VPLS Instance (Access) or VPLS Forward (Core) in the Cisco ANA NetworkVision navigation pane.
To view pseudowire endpoint properties for a VPLS instance, right-click the required pseudowire endpoint in the navigation pane, and choose Properties. (See Figure 12-14.)
Figure 12-14 VPLS Pseudowire in Cisco ANA NetworkVision Navigation Pane
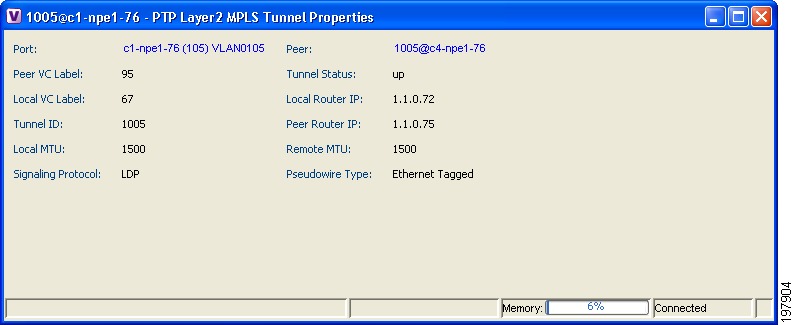
Figure 12-15 shows an example of the Tunnel Properties window that is displayed.
Figure 12-15 VPLS Tunnel Properties Window
Table 12-16 describes the information that is displayed for pseudowire endpoint properties.
Table 12-16 Tunnel Properties Window
Port
VSI on which the pseudowire is configured, hyperlinked to the VSI in logical inventory.
Peer
Hyperlinked entry to the pseudowire endpoint peer pseudowires in logical inventory.
Peer VC Label
MPLS label that is used by this router to identify or access the tunnel. It is inserted into the MPLS label stack by the peer router.
Tunnel Status
Operational state of the tunnel: Up or Down.
Local VC Label
MPLS label that is used to identify or access the tunnel. It is inserted into the MPLS label stack by the local router.
Local Router IP
IP address of this tunnel edge, which is used as the MPLS router identifier.
Tunnel ID
Identifier that, along with the router IP addresses of the two pseudowire endpoints, identifies the PWE3 tunnel.
Peer Router IP
IP address of the peer tunnel edge, which is used as the MPLS router identifier.
Local MTU
Size, in bytes, of the MTU on the local interface.
Remote MTU
Size, in bytes, of the MTU on the remote interface.
Signaling Protocol
Protocol used by MPLS to build the tunnel, such as LDP or TDP.
Pseudowire Type
Type of pseudowire, such as Ethernet, Ethernet Tagged, CESoPSN Basic, PPP, or SAToP.
For a complete list of pseudowire types, see the Cisco Active Network Abstraction 3.7.1 Theory of Operations Guide.
Viewing VPLS Access Ethernet Flow Point Properties
The ports that represent the attachment circuits to VPLS instances are displayed under VPLS instances in the Cisco ANA NetworkVision navigation pane.
To view the properties for the Access Ethernet Flow Points configured for a VPLS instance, right-click the required interface in the navigation pane, and choose Properties. (See Figure 12-16.)
Figure 12-16 VPLS Interface in Cisco ANA NetworkVision Navigation Pane
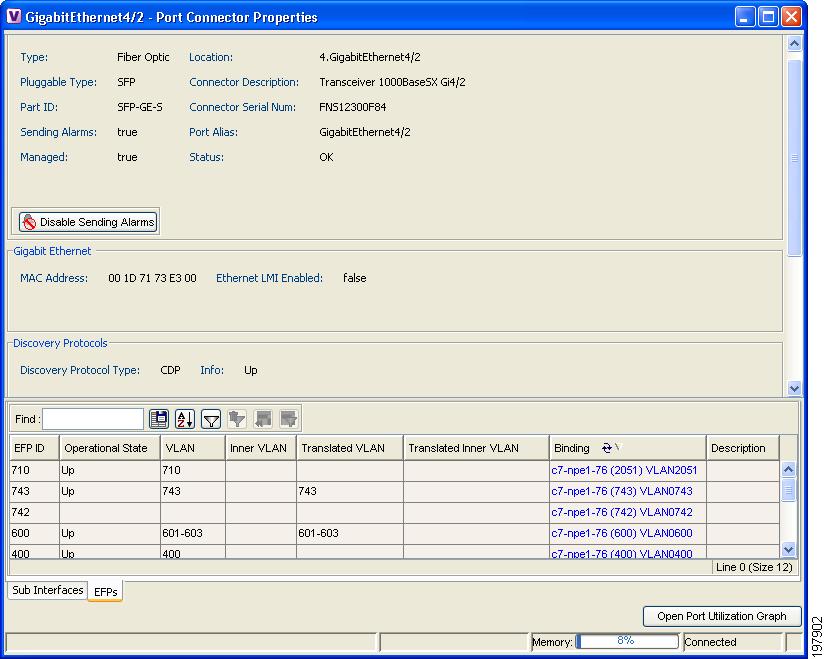
Figure 12-17 shows an example of the Port Connector Properties window.
Figure 12-17 Port Connector Properties Window
The information displayed in this window is the same as that displayed when the interface is selected in physical inventory.
The following information is displayed, depending on the interface and its configuration:
•
•
•
•
•
•
Viewing and Renaming Ethernet Flow Domains
An Ethernet flow domain represents an Ethernet access domain. The Ethernet flow domain holds all network elements between the CE (inclusive, if managed by the SP), up to the SP core (exclusive). This includes CE, access, aggregation, and distribution network elements.
An Ethernet flow domain can have no N-PEs (flat VLAN) or one or more N-PEs (N-PE redundancy configuration). The Ethernet flow domain is defined using physical connectivity at the port level, and not at the NE level. STP is used to mark the root bridge, root or blocked ports, and blocked VLAN links.
To view Ethernet flow domains:
Step 1
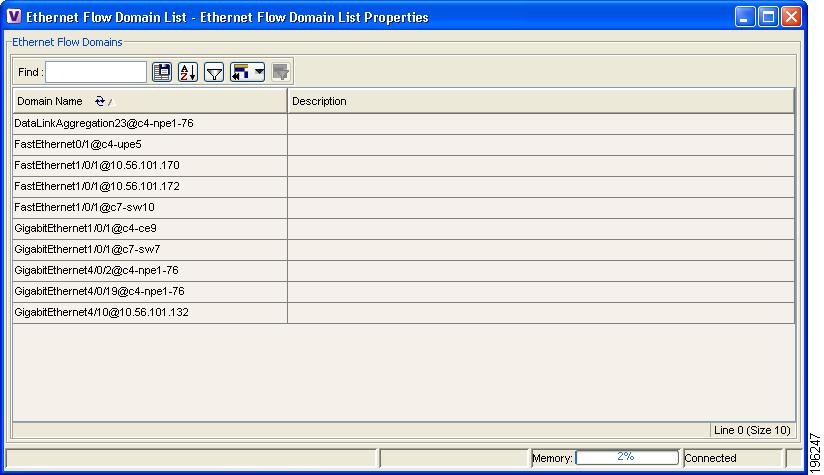
The Ethernet Flow Domain List window is displayed with the name and a brief description for each Ethernet flow domain as shown in Figure 12-18.
Figure 12-18 Ethernet Flow Domains in Logical Inventory
Step 2
a.
b.
c.
The window is refreshed, and the new name is displayed.
Step 3
•
•
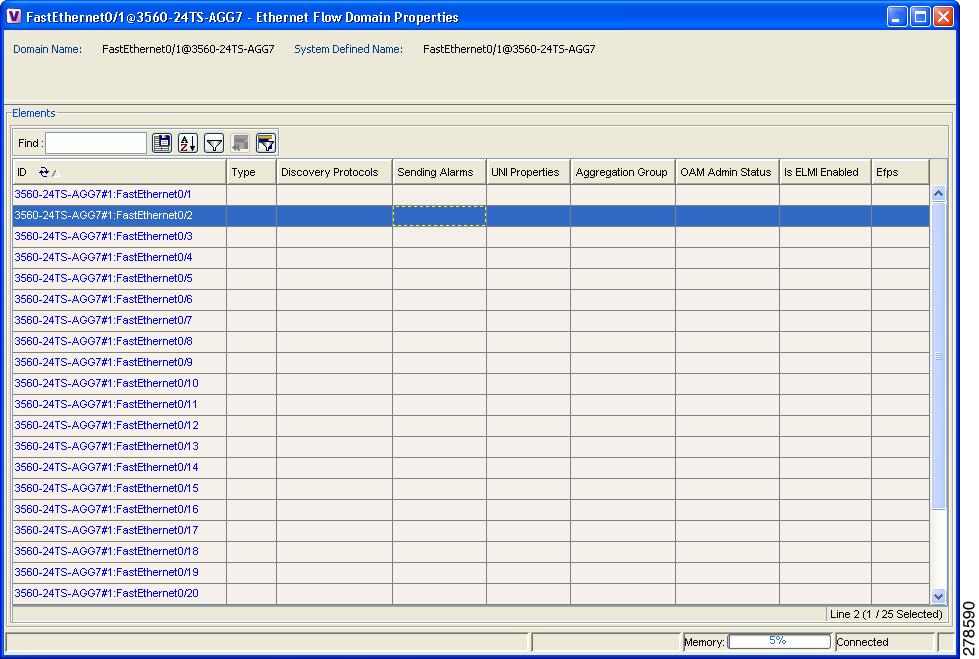
The Ethernet Flow Domain Properties window is displayed as shown in Figure 12-19.
Figure 12-19 Ethernet Flow Domain Properties Window
Table 12-17 describes the information displayed in the Ethernet Flow Domain Properties window.
Note
Step 4
The interface or link aggregation group properties are displayed in the inventory window.
Working with VLANs and VLAN Overlays
The following topics provide information and procedures for working with VLANs and VLAN overlays:
•
•
•
•
•
•
•
•
•
•
•
•
VLAN and EFD Discovery
When you start the Cisco ANA gateway the first time, Cisco ANA waits for two topology cycles to complete before discovering new VLANs, VLAN associations, and EFDs. The default configured time for two topology cycles to complete is one hour, but might be configured for longer periods of time on large setups. This delay allows the system to stabilize, and provides the time needed to model devices and discover links.
Similarly, when you restart the gateway, Cisco ANA uses this stabilization period to add existing information on VLANs, VLAN associations, and EFDs to maps and logical inventory. EFDs that were previously stored in the database can be viewed in inventory, and VLANs can be viewed in maps.
During this delay, Cisco ANA does not add VNEs or apply updates to existing VLANs or EFDs.
After the initial delay has passed, Cisco ANA discovers new VLANs, VLAN associations, and EFDs, applies updates to existing VLANs, VLAN associations, and EFDs, and updates the database accordingly.
VLAN Elements
The following concepts are important to understand when working with the representation of edge EFPs inside VLANs:
•
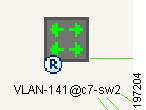
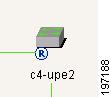
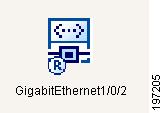
VLAN Elements in Cisco ANA NetworkVision
Table 12-18 describes the icons that Cisco ANA uses to represent VLAN elements.
Table 12-18 VLAN Elements and Icons in Cisco ANA NetworkVision
Network VLAN
None
Switching entity
Bridge
Ethernet Flow Point (EFP)
Ethernet port
VLANs
As described in the Cisco Active Network Abstraction 3.7.1 Theory of Operations Guide, Cisco ANA discovers and allows you to display maps with a network-level view of VLANs.
In Cisco ANA, a VLAN entity consists of one or more switching entities and the corresponding EFP elements.
A network VLAN represents the virtual LAN. The network VLAN holds its contained switching entities and can be associated to a customer. The network VLAN also holds the Ethernet flow points that are part of the network VLAN but not part of any switching entity. For example, a port that tags ingress flows after which the flow moves to a different VLAN.
Switching Entities
A switching entity represents a device-level Layer 2 forwarding entity (such as a VLAN or bridge domain) that participates in a network VLAN. A switching entity is associated to a network VLAN according to its relationship to the same Ethernet Flow Domain (EFD) and the VLAN identifier.
If you right-click a switching entity in Cisco ANA NetworkVision and then choose Inventory, the inventory window is displayed with the corresponding bridge selected in Logical Inventory.
A switching entity typically contains EFP elements.
Ethernet Flow Points
An Ethernet flow point (EFP) can represent a port that is configured for participation in a specific VLAN.
If you right-click an EFP in Cisco ANA NetworkVision and then choose Inventory, the inventory window is displayed with the corresponding port selected in Physical Inventory.
EFPs that are located in a switching entity represent Ethernet ports that are configured as switch ports (in either Access, Trunk, or Dot1Q tunnel mode).
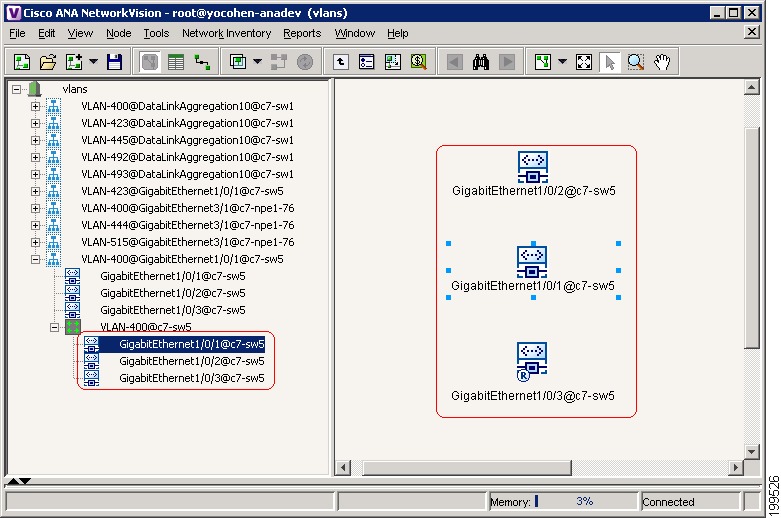
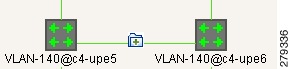
Figure 12-20 shows an example of EFPs configured as switch ports in Cisco ANA NetworkVision.
Figure 12-20 EFPs in a Cisco ANA NetworkVision Map
EFPs that are located directly inside a VLAN represent one of the following:
•
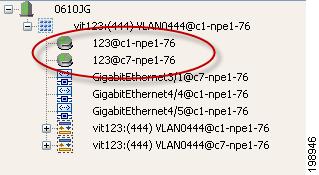
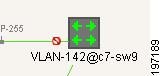
These EFPs are typically connected to a switching entity inside the VLAN by a VLAN link, as shown in Figure 12-21.
Figure 12-21 Termination Point EFP Inside a VLAN
•
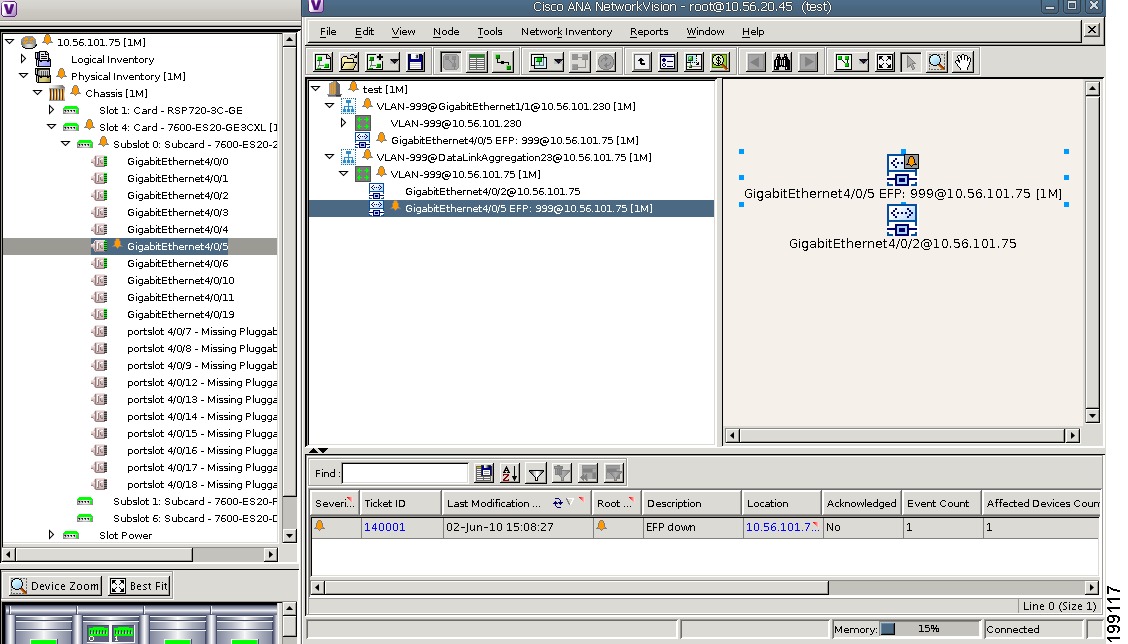
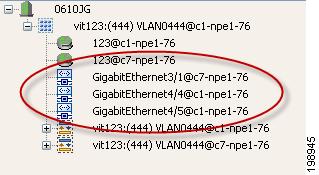
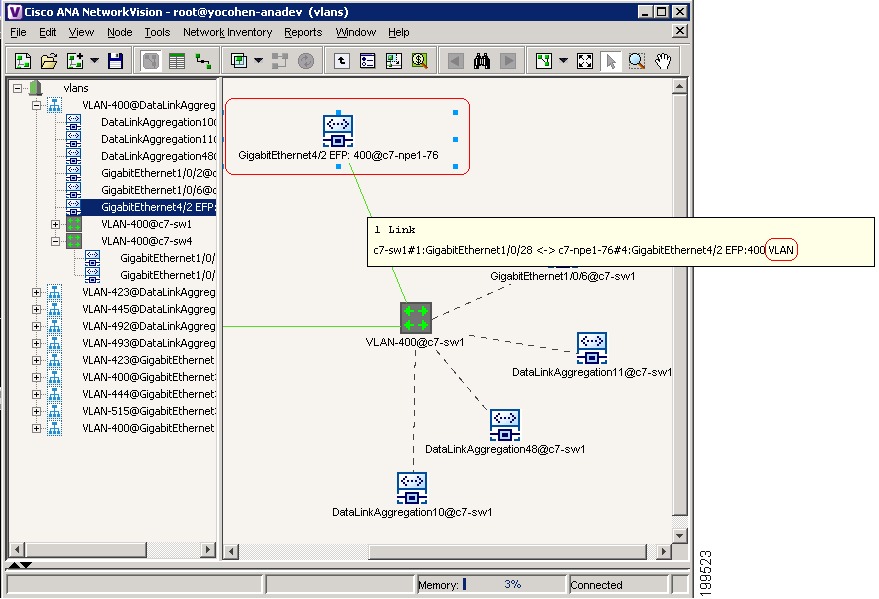
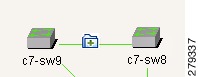
In Cisco ANA, edge EFPs are displayed directly under the VLAN at the same level as their switching entities and are connected to their corresponding switching entities by a dotted link, as shown in Figure 12-22.
Figure 12-22 Edge EFP Inside a VLAN
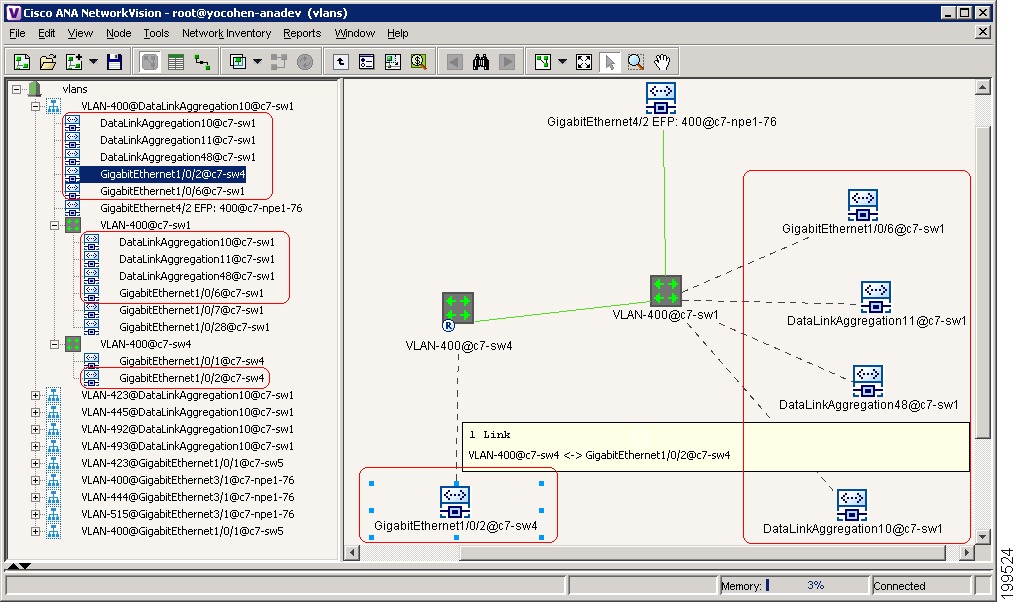
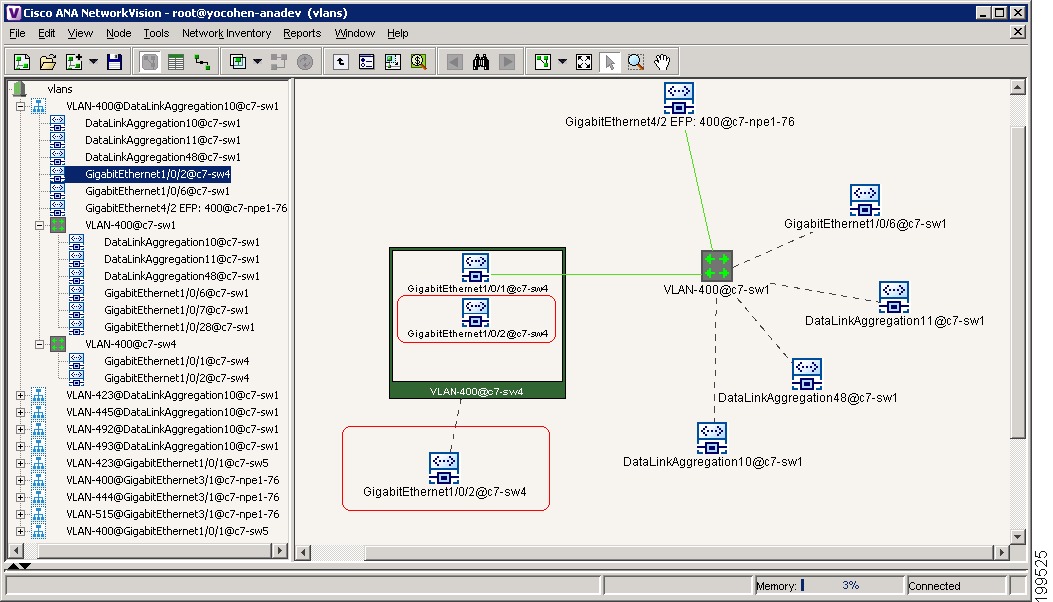
Expanding the switching entity VLAN-400@c7-sw4 in Figure 12-22 allows us to see in Figure 12-23 that the highlighted EFP (GigabitEthernet1/0/2@c7-sw4) is:
–
–
Figure 12-23 Edge EFP Displayed Inside and Outside of Switching Entity
You can delete EFPs and switching entities that have a reconciliation icon by right-clicking them and choosing Delete. After all switching entities and EFPs are deleted from a network VLAN, the empty network VLAN is automatically deleted from Cisco ANA NetworkVision after a few minutes.
Switching Entities Containing Termination Points
For some devices, such as Cisco 7600 series, Cisco GSR, and Cisco ASR 9000 series devices, the related switching entities can contain Ethernet flow point elements that serve as termination points on different network VLANs. If a single map contains both the switching entities and the network VLANs, a link is displayed between them.
Adding VLANs to a Map
You can add VLANs to a map if the VLANs were previously discovered by Cisco ANA and are not currently displayed in the map. For more information about VLANs, see the Cisco Active Network Abstraction 3.7.1 Theory of Operations Guide.
Note
To add VLANs to a map:
Step 1
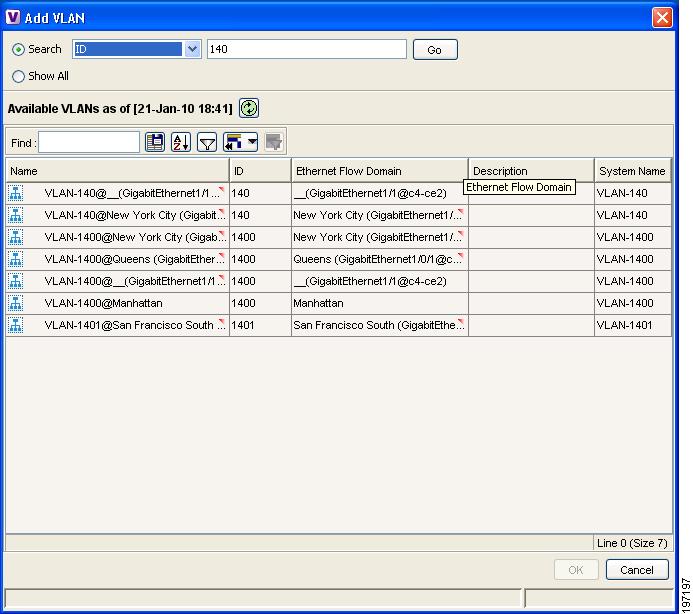
Step 2
Figure 12-24 Add VLAN Dialog Box
Step 3
•
The search condition is "contains." Search strings are case-insensitive. For example, if you choose the Name category and enter "net," Cisco ANA displays VLANs that have "net" anywhere in their names. The string "net" can be at the beginning, the middle, or end of the name, such as Ethernet.
•
Step 4
Tip
Step 5
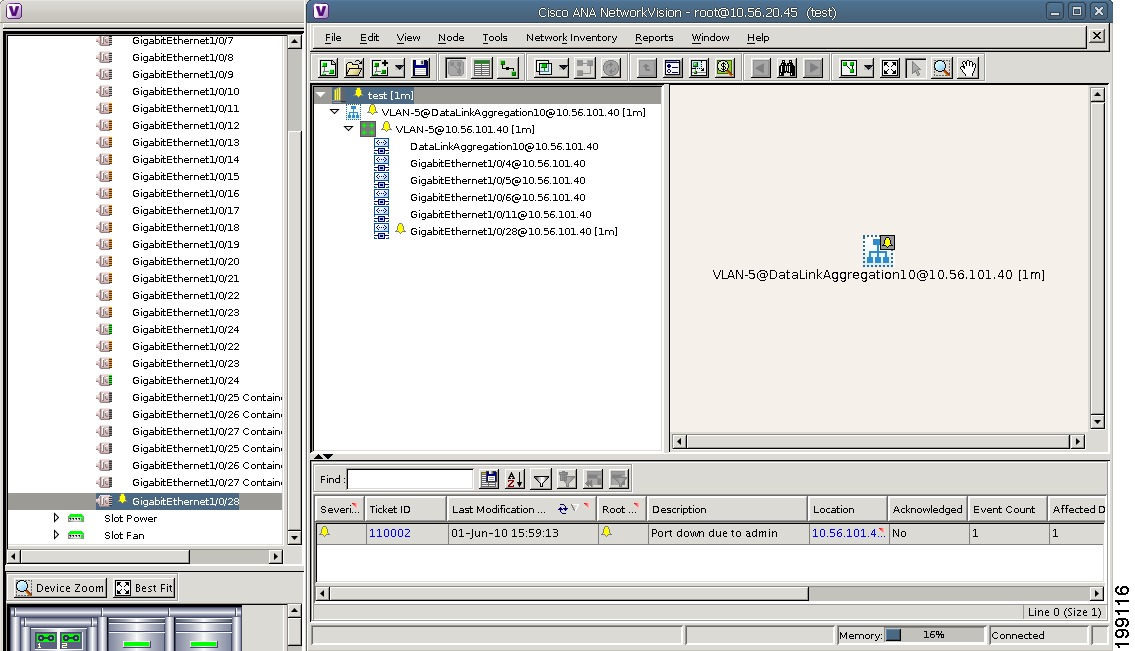
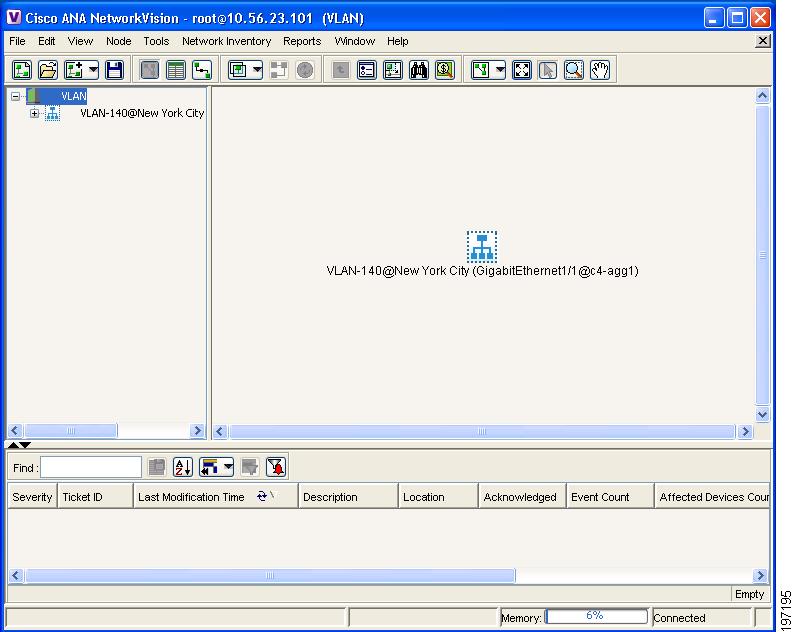
The VLANs are displayed in the Cisco ANA NetworkVision content pane as shown in Figure 12-25.
Any tickets that apply to the VLANs are displayed in the ticket pane.
Figure 12-25 Network VLAN in Cisco ANA NetworkVision Map View
After you add a VLAN to a map, you can use Cisco ANA NetworkVision to view its switching entities and Ethernet flow points. For more information, see:
•
You can view additional information about REP and STP in logical inventory, VLAN domain views, and VLAN overlays.
For REP, see:
•
•
•
For STP, see:
•
•
•
Removing VLANs from a Map
You can remove one or more VLANs from the current map. This change does not affect other maps. Removing a VLAN from a map does not remove it from the Cisco ANA database. You can add the VLAN to the map at any time.
When removing VLANs from maps, keep the following in mind:
•
•
•
To remove a VLAN, in the Cisco ANA NetworkVision navigation pane or map view, right-click the VLAN and choose Remove from Map.
The VLAN is removed from the navigation pane and map view along with all VLAN elements such as connected CE devices. Remote VLANs (extranets) are not removed.
Viewing VLAN Mappings
VLAN mapping, or VLAN ID translation, is used to map customer VLANs to service provider VLANs. VLAN mapping is configured on the ports that are connected to the service provider network. VLAN mapping acts as a filter on these ports without affecting the internal operation of the switch or the customer VLANs.
If a customer wants to use a VLAN number in a reserved range, VLAN mapping can be used to overlap customer VLANs by encapsulating the customer traffic in IEEE 802.1Q tunnels.
To view VLAN mappings:
Step 1
Step 2
Step 3
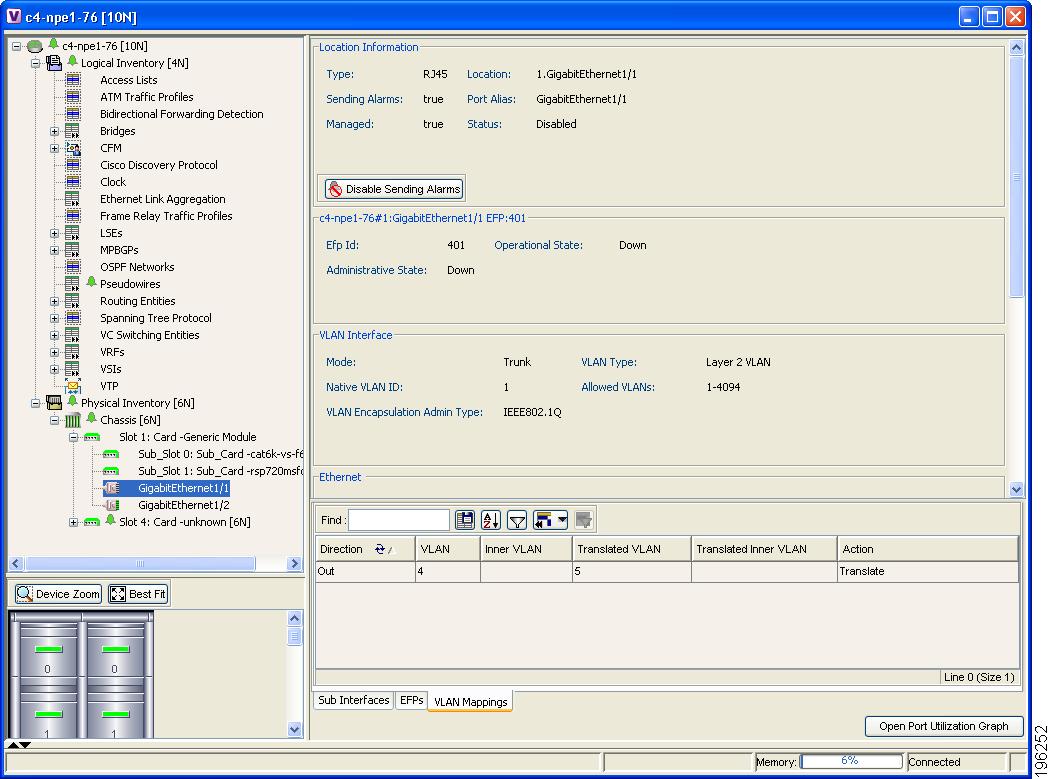
The VLAN Mappings tab is displayed as shown in Figure 12-26.
Figure 12-26 VLAN Mappings Tab in Physical Inventory
Table 12-19 describes the information that is displayed in the VLAN Mappings table.
Working with Associated VLANs
Cisco ANA discovers associations between network VLANs and displays the information in Cisco ANA NetworkVision. Network VLAN associations are represented by VLAN service links, and can be any of the tag manipulation types described in Table 12-20.
When working with VLANs, you can:
•
•
Adding an Associated VLAN
To add an associated VLAN to an existing VLAN in a map:
Step 1
Step 2
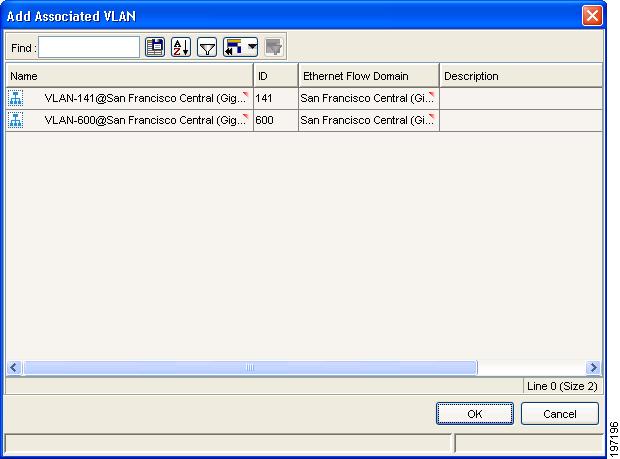
The Add Associated VLAN table is displayed as shown in Figure 12-27.
Figure 12-27 Add Associated VLAN Window
In this example, the selected network VLAN has two associated VLANs: VLAN-141 and VLAN-600.
Table 12-21 describes the information displayed in the Add Associated VLAN table.
Table 12-21 Add Associated VLAN Table
Name
Name of the VLAN.
ID
VLAN identifier.
Ethernet Flow Domain
Name of the Ethernet flow domain.
Description
Brief description of the VLAN.
Step 3
The associated network VLAN is added to the map in Cisco ANA NetworkVision.
Viewing Associated Network VLAN Service Links and VLAN Mapping Properties
After you add an associated network VLAN, you can:
•
•
To view associated network VLAN service links and VLAN mapping properties:
Step 1
Step 2
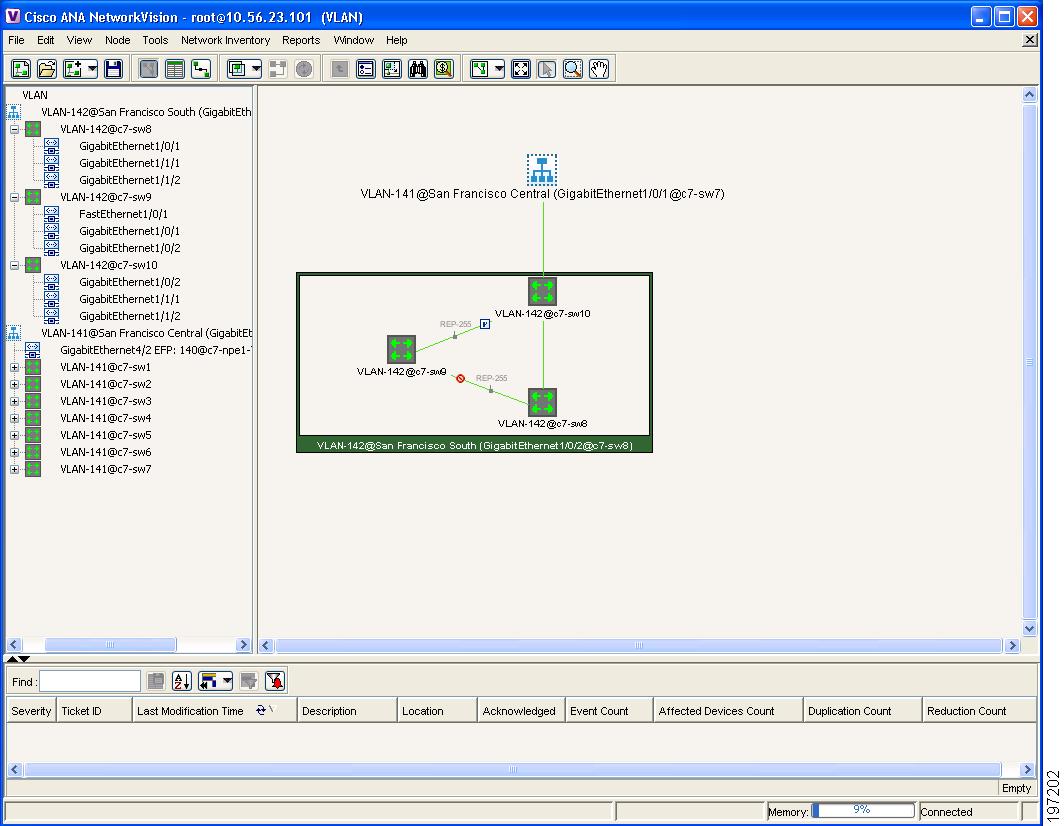
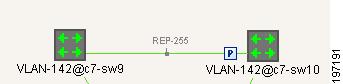
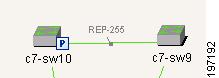
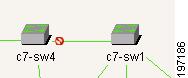
Figure 12-28 shows an example of a network VLAN in the thumbnail view.
The VLAN service links are displayed as lines between the associated network VLANs. The links represent the connections between the Ethernet flow points that are part of each network VLAN.
Figure 12-28 VLAN Service Links Between Associated Network VLANs
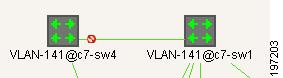
Step 3
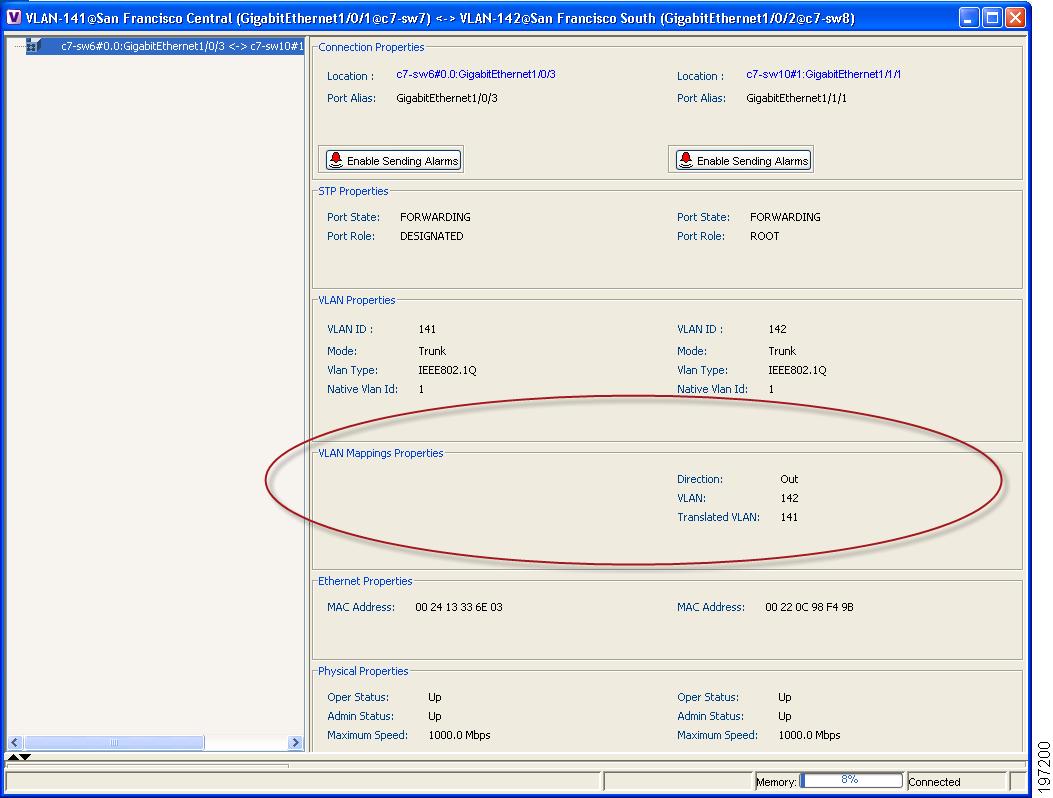
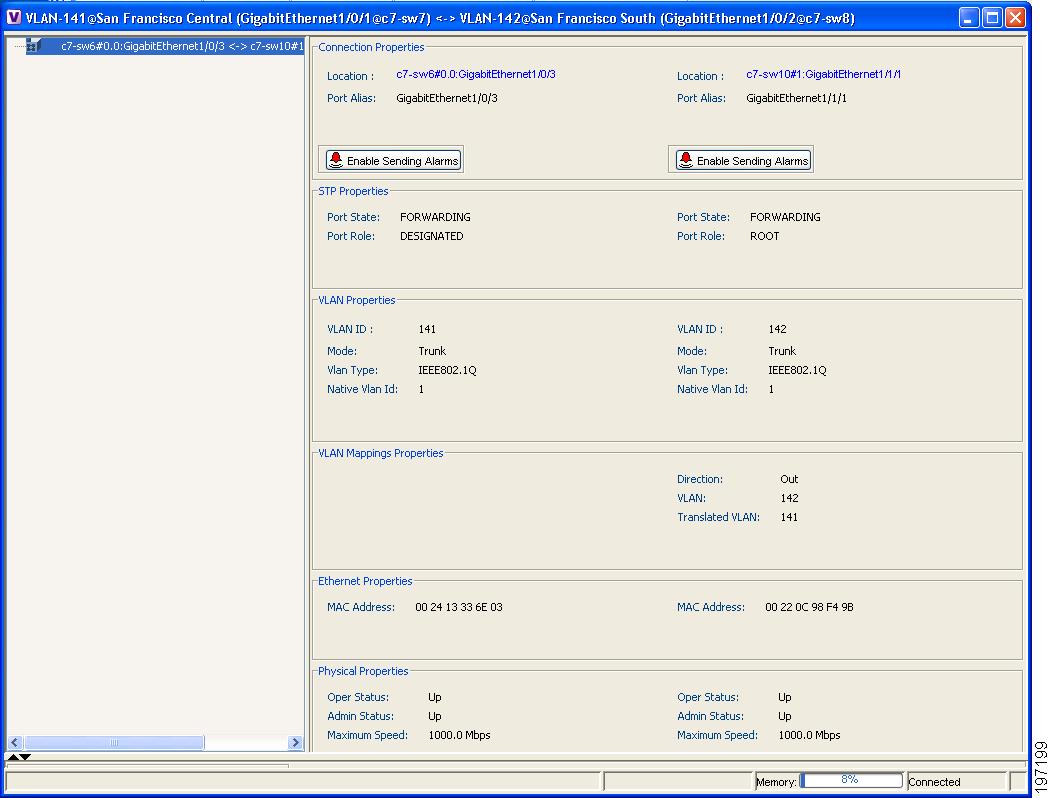
The Link Properties window is displayed as shown in Figure 12-29.
If VLAN tag manipulation is configured on the link, the VLAN Mapping Properties area in the Link Properties window displays the relevant information. For example, in Figure 12-29, the VLAN Mapping Properties area shows that a one-to-one VLAN mapping for VLAN tag 142 to VLAN tag 141 is configured on port GigabitEthernet1/1/1 on c7-sw10 on the egress direction.
Figure 12-29 VLAN Mapping Properties in Link Properties Window
For additional information about viewing network VLAN service link properties, see:
•
•
Viewing VLAN Links Between VLAN Elements and Devices
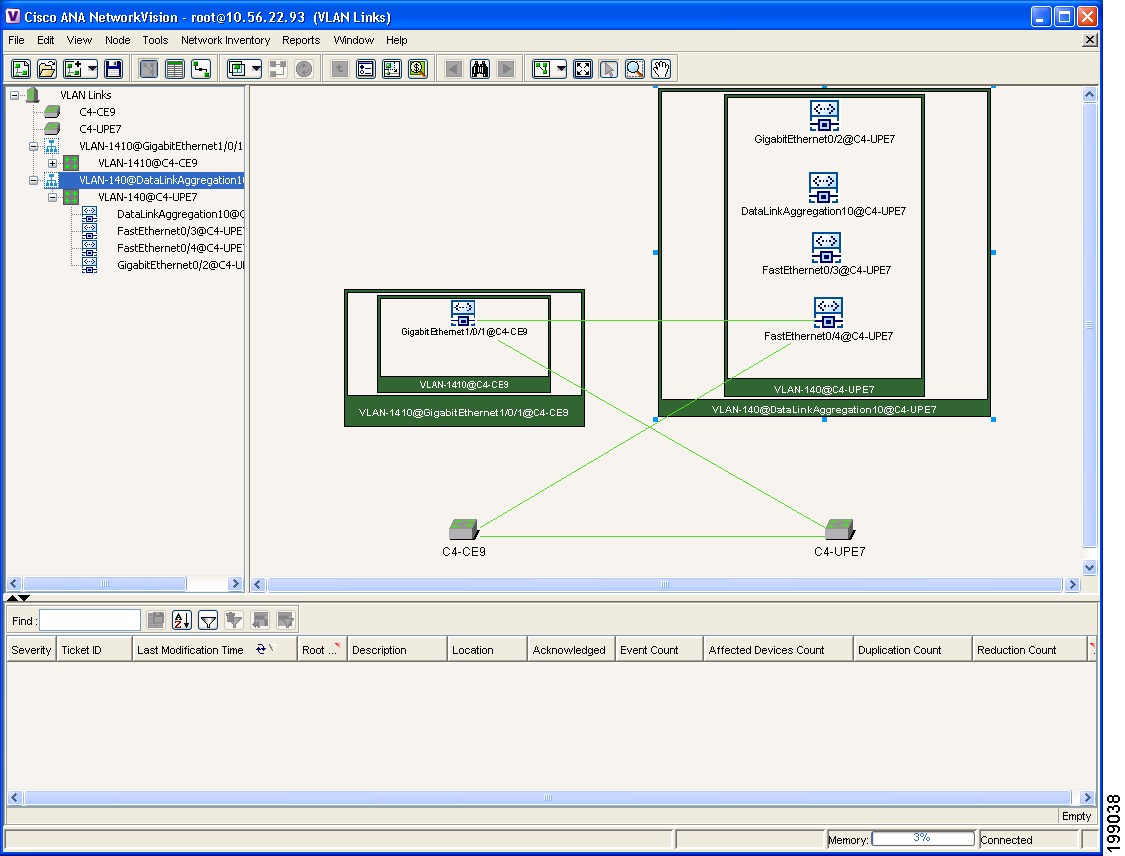
If a Cisco ANA NetworkVision map contains a VLAN and the network element on which the VLAN is configured, along with EFPs, switching entities, or network VLANs, you might see what appear to be multiple associations between the logical and physical entities. Actually, however, you are seeing other views of the original VLAN link.
For example, assume that you have the following situation, as shown in Figure 12-30 and described in the following paragraphs.
Figure 12-30 VLAN Elements and Devices in Cisco ANA NetworkVision
The elements are configured as follows:
•
•
•
•
In this example, VLAN discovery identified two network VLANs: VLAN-1410 and VLAN-140. Each of these network VLANs contains a switching entity and an EFP that represent the connected ports, GigaEthernet1/0/1 and FastEthernet0/4, respectively.
The four links in the map are identified in Figure 12-31 and described in the following table.
Figure 12-31 Links Between VLAN Elements and Devices
The key point is that a link between a VNE and EFP, switching entity, or network VLAN does not represent an association between the VNE and the logical element. Such a link is simply another view of the VLAN link.
If the thumbnail view is closed, instead of a link between the VNE and EFP, you will see a link between the VNE and the switching entity or network VLAN.
Adding a VLAN Overlay to a Map View
You can create an overlay of a specific VLAN on top of the physical network elements displayed in a map view. The overlay highlights the network elements and links that the selected VLAN and its associated VLANs traverse. Network elements and links that are not part of the VLAN are dimmed in the map view.
The VLAN overlay is a snapshot of the network to help you visualize the network elements and links connected to a VLAN. The overlay displays STP and REP link and port information.
If you select a network VLAN that is associated with other VLANs, the associated VLANs are included in the overlay.
The VLAN service overlay allows you to isolate the parts of a network that are being used by a particular service. This information can then be used for troubleshooting. For example, the overlay can highlight configuration or design problems when bottlenecks occur and all site interconnections use the same link. For more information about VLAN overlays, see the Cisco Active Network Abstraction 3.7.1 Theory of Operations Guide.
To add a VLAN overlay:
Step 1
Step 2
Step 3
•
The search condition is "contains." Search strings are case-insensitive. For example, if you choose the Name category and enter "net," Cisco ANA displays overlays that have "net" in their names. The string "net" can be at the beginning, middle, or end of the name, such as Ethernet.
•
Step 4
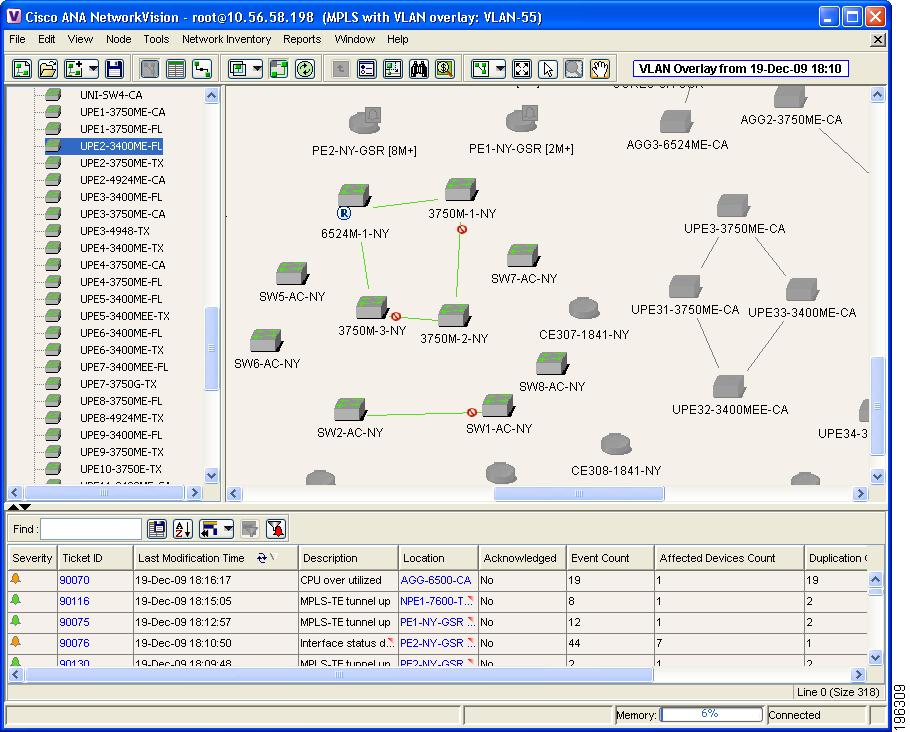
The network elements and physical links used by the selected VLAN overlay are highlighted in the network map. All other network elements and links are dimmed. The VLAN name is displayed in the title of the window. See Figure 12-32.
Figure 12-32 VLAN Overlay Example
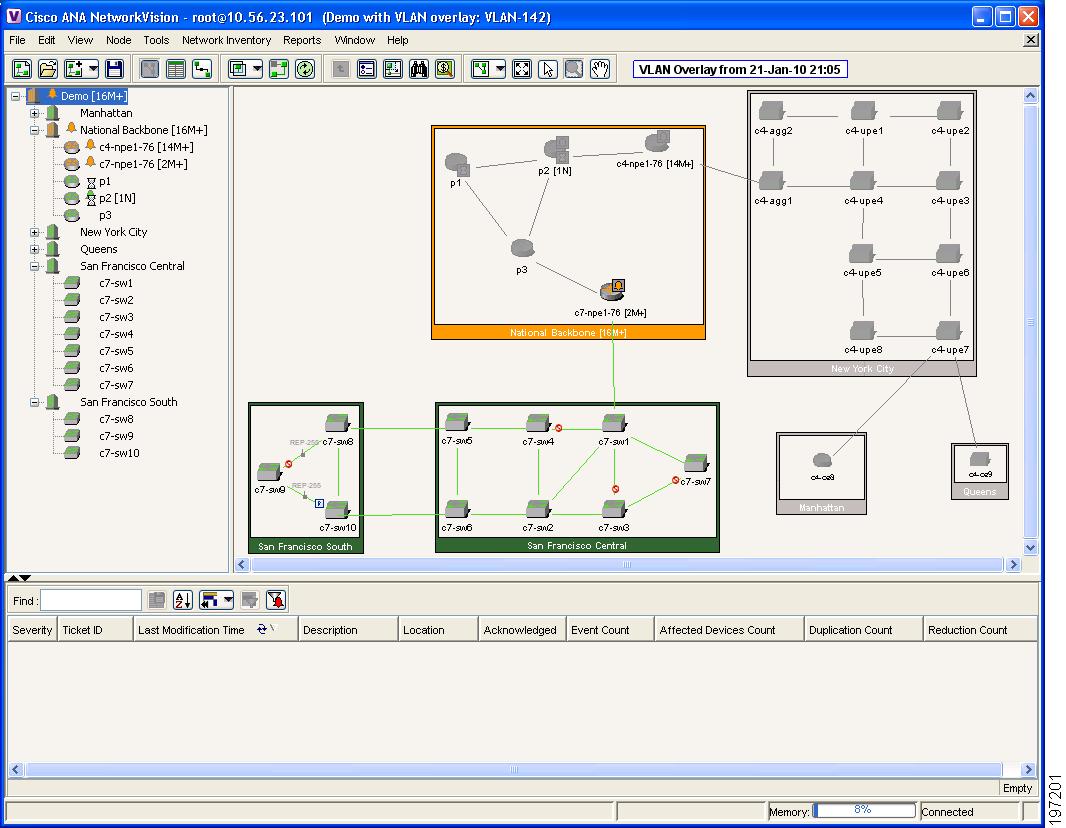
Figure 12-33 shows an example of a VLAN with associated VLANs. In this example:
•
•
Figure 12-33 VLAN Overlay with VLAN Associations
Note
Displaying or Hiding VLAN Overlays
After you create a VLAN overlay, you can hide it by clicking Hide Overlay in the toolbar. All previously dimmed network elements and links are displayed. To display the overlay, click Show Overlay.
Note
Removing a VLAN Overlay
To remove a VLAN overlay from a map, choose Choose Overlay Type > None in the toolbar. The overlay is removed from the map, and the Show Overlay/Hide Overlay icon is dimmed.
Viewing VLAN Service Link Properties
See the following topics for information on viewing VLAN service link properties:
•
•
•
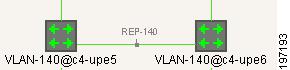
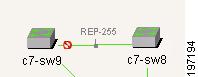
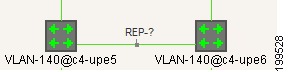
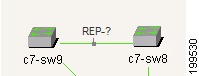
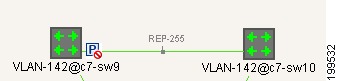
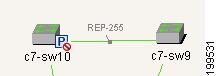
Viewing REP Information in VLAN Domain Views and VLAN Overlays
You can view REP segment and port information in Cisco ANA NetworkVision in the map view. The icons displayed depend on whether you view the REP information in the VLAN domain view or in a VLAN overlay. Table 12-22 describes the icons and badges used to represent REP segment and port information.
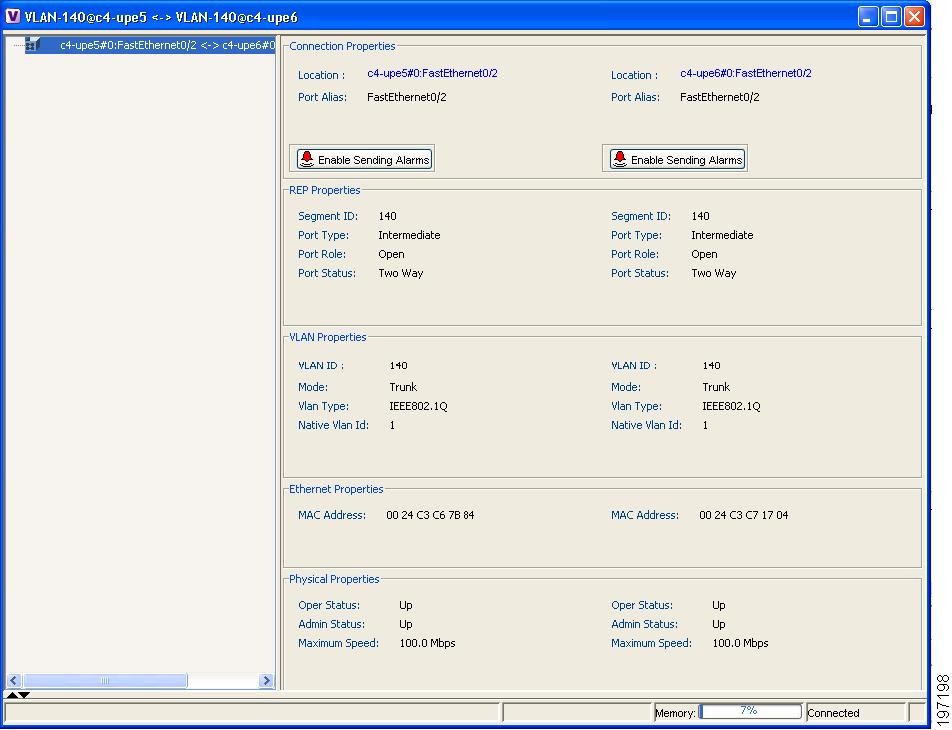
Viewing REP Properties for VLAN Service Links
To view REP properties for a VLAN service link, open the Link Properties window in either of the following ways:
•
•
Figure 12-34 shows an example of the Link Properties window with REP information.
Figure 12-34 VLAN Service Link Properties Window with REP Information
Table 12-23 describes the information that is displayed for REP for each end of the link.
Viewing STP Information in VLAN Domain Views and VLAN Overlays
You can view STP segment and port information in Cisco ANA NetworkVision in the map view. The icons displayed depend on whether you view the STP information in the VLAN domain view or in a VLAN overlay. Table 12-22 describes the icons and badges used to represent STP link and port information.
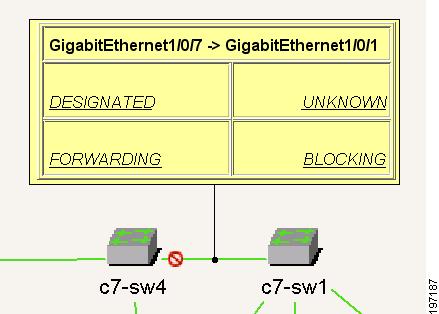
To view additional STP information in a VLAN overlay, right-click an STP link and choose Show Callouts. The following STP port information is displayed as shown in Figure 12-35:
•
•
•
Figure 12-35 STP Link Information in a VLAN Overlay
•
•
Viewing STP Properties for VLAN Service Links
To view STP properties for a VLAN service link, open the Link Properties window in either of the following ways:
•
•
Figure 12-36 shows an example of the Link Properties window with STP information.
Figure 12-36 STP Properties in VLAN Service Link Properties Window
Table 12-25 describes the information that is displayed for STP for the VLAN service link.
Viewing VLAN Trunk Group Properties
VTP is a Layer 2 multicast messaging protocol that manages the addition, deletion, and renaming of VLANs on a switched network-wide basis.
Cisco ANA displays VTP information in the Cisco ANA NetworkVision logical inventory. VTP information is shown only for Cisco devices that support VTP, and support is provided only for VTP Version 1 and 2. Support for Version 3 is limited to the additional attributes that are supported by the version, such as primary and secondary server. No support is provided for the display of VTP information at the port (trunk) level.
Cisco ANA shows all VTP modes: Server, Client, Transparent, and Off. For each mode, Cisco ANA displays the relevant mode information such as VTP domain, VTP mode, VTP version, VLAN trunks, and the trunk encapsulation. Cisco ANA also displays VTP domain information in a view that includes a list of all switches that are related to these domains, their roles (server, client, and so on), and their VTP properties.
For additional information about VTP, see the Cisco Active Network Abstraction 3.7.1 Theory of Operations Guide.
To view VTP properties:
Step 1
Step 2
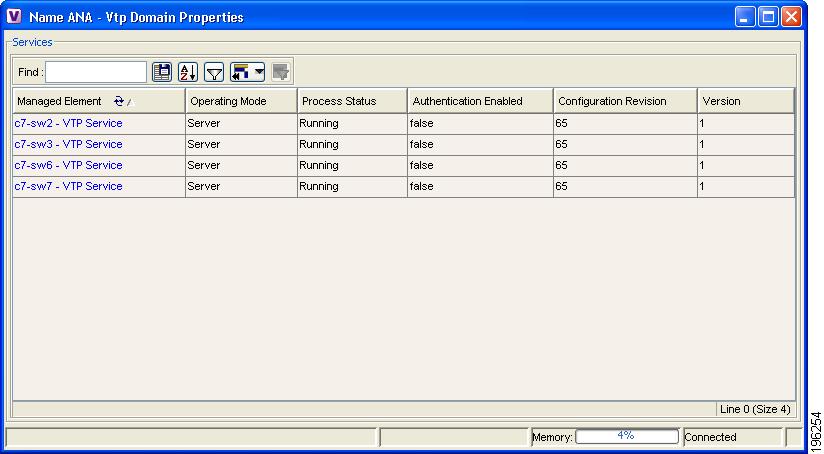
The VTP Domain Properties window is displayed as shown in Figure 12-37.
Figure 12-37 VTP Domain Properties Window in Logical Inventory
Table 12-26 describes the information that is displayed in the VTP Domain Properties window.
Step 3
Table 12-27 describes the VTP information that is displayed in the inventory window content pane.
Step 4
Viewing VLAN Bridge Properties
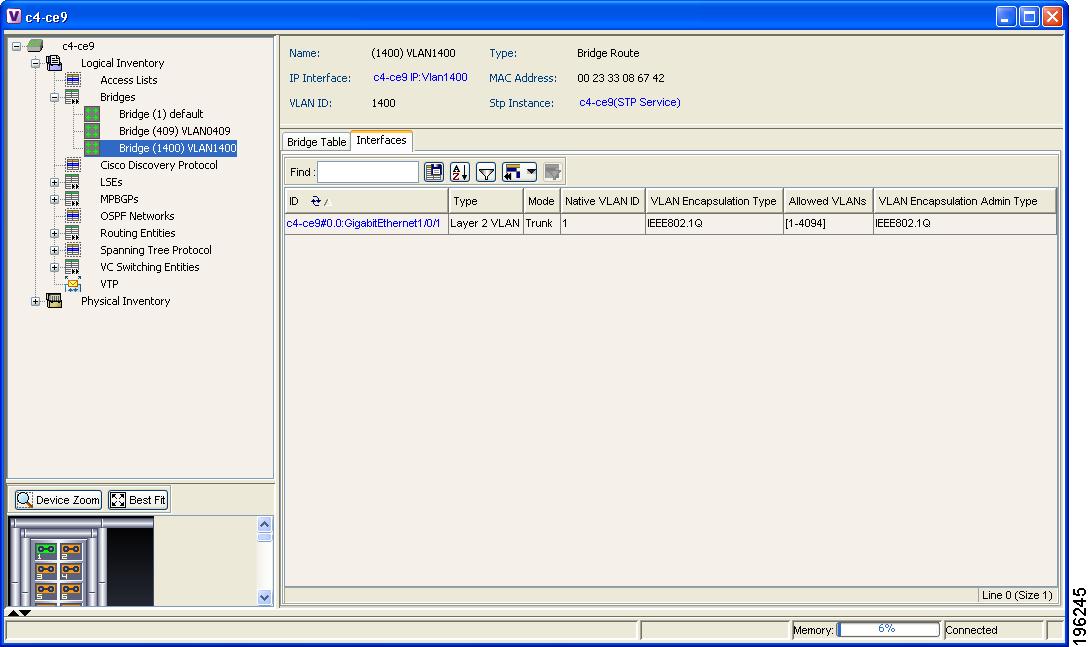
You can view VLAN bridges provisioned on a device by displaying the device in the Cisco ANA NetworkVision inventory window and choosing Bridges in the Logical Inventory tree. To view VLAN bridge properties:
Step 1
Step 2
VLAN bridge properties are displayed as shown in Figure 12-38.
Figure 12-38 VLAN Bridge Properties in Logical Inventory
Table 12-28 describes the information that is displayed. Depending on the bridge configuration, any of the tabs might be displayed for the selected bridge.
Step 3
Understanding Unassociated Bridges
Some switching entities might not belong to a flow domain, such as a network VLAN, a VPLS instance, or a network pseudowire. These switching entities are referred to as unassociated bridges.
In addition, a switching entity that belongs to a network VLAN is considered an unassociated bridge if it meets both of the following criteria:
•
•
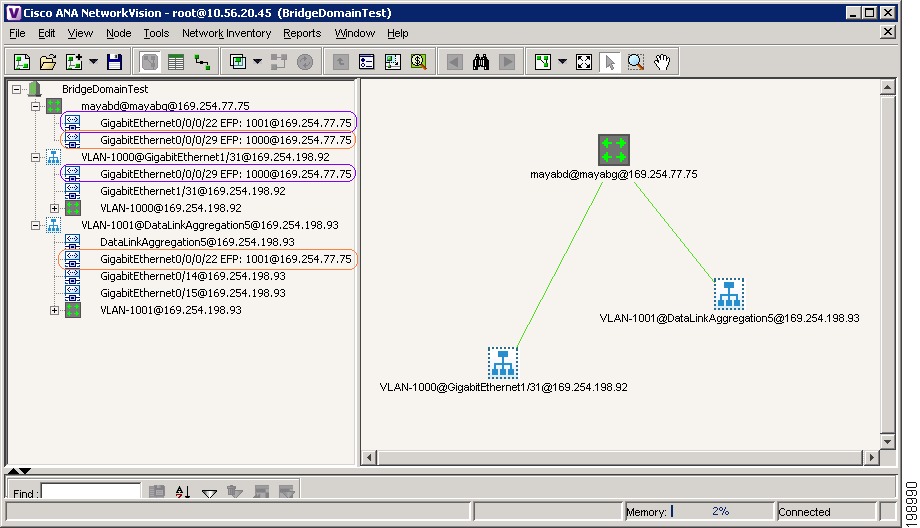
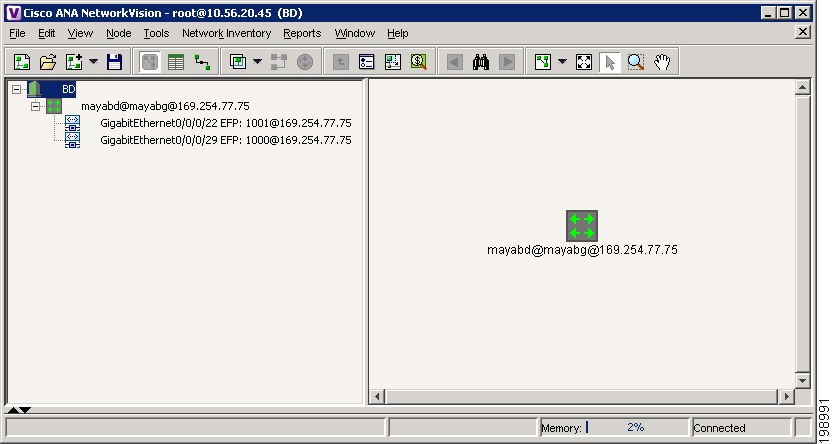
Unassociated bridge switching entities can hold Ethernet flow points that serve as termination points on different network VLANs. If these switching entities are added to a map with the relevant VLANs, the links are displayed as shown in Figure 12-39.
Figure 12-39 Switching Entity with EFPs on Different Network VLANs
Adding Unassociated Bridges
Cisco ANA enables you to add unassociated bridges to maps and to view their properties in Cisco ANA NetworkVision.
To add an unassociated bridge to a map:
Step 1
Step 2
•
•
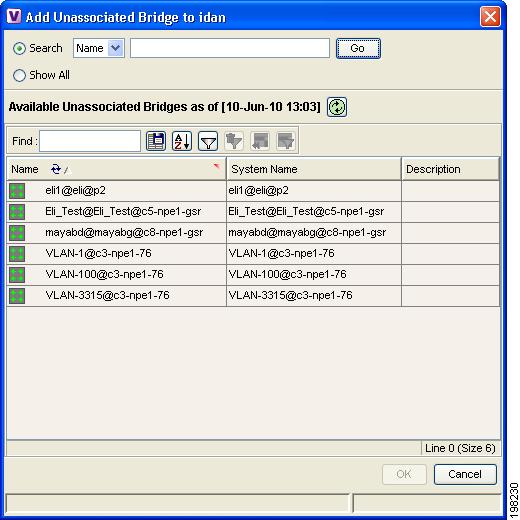
Figure 12-40 shows an example of the Add Unassociated Bridge dialog box.
Figure 12-40 Add Unassociated Bridge Dialog Box
Step 3
The map is refreshed and displays the newly added bridge as shown in Figure 12-41.
Figure 12-41 Unassociated Bridge in Cisco ANA NetworkVision
Working with Ethernet Flow Point Cross-Connects
Cisco ANA automatically discovers Ethernet flow point (EFP) cross-connects, also known as locally switched EFPs. Cisco ANA also identifies changes in already identified EFP cross-connects, such as cross-connect deletions or changes. Cross-connect changes can occur when one side of the cross-connect is removed or replaced.
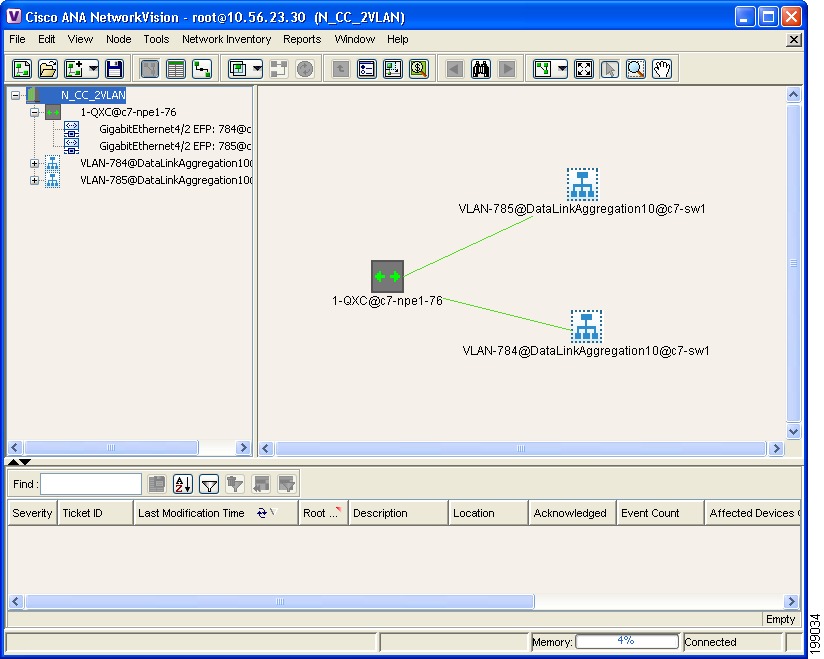
Cisco ANA also associates the VLANs that contain the EFPs that are part of the cross-connects. If the cross-connect contains a range EFP, which represents a range of VLANs, and you add the related VLANs to a map, Cisco ANA displays the links between them and the cross-connect as well. Figure 12-42 shows an example of a cross-connect, two related VLANs, and the links between the cross-connect and the VLANs.
Figure 12-42 EFP Cross-Connect Linked to VLANs in Cisco ANA NetworkVision
Cisco ANA enables you to add EFP cross-connects to maps and to view their properties in inventory, as described in the following topics:
•
Adding EFP Cross-Connects
To add an EFP cross-connect to a map:
Step 1
Step 2
•
•
Step 3
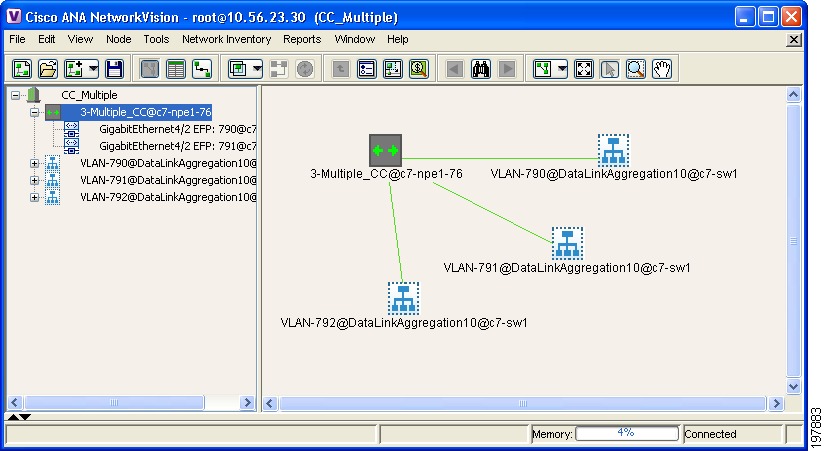
The map is refreshed and displays the newly added EFP cross-connect as shown in Figure 12-43.
Figure 12-43 EFP Cross-Connect in Cisco ANA NetworkVision
Viewing EFP Cross-Connect Properties
To view EFP cross-connect properties:
Step 1
Step 2
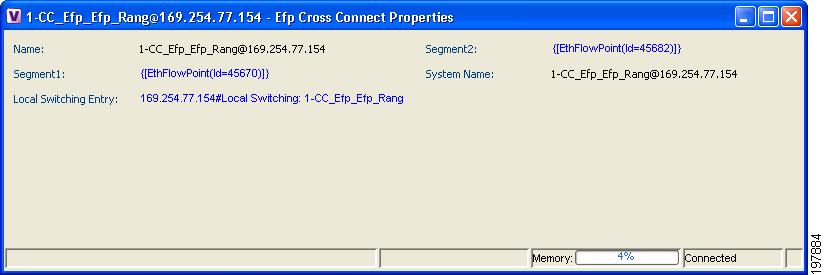
Figure 12-44 shows an example of the EFP Cross-Connect Properties window.
Figure 12-44 EFP Cross-Connect Properties Window
Table 12-29 describes the information displayed in the EFP Cross-Connect Properties window.
Step 3
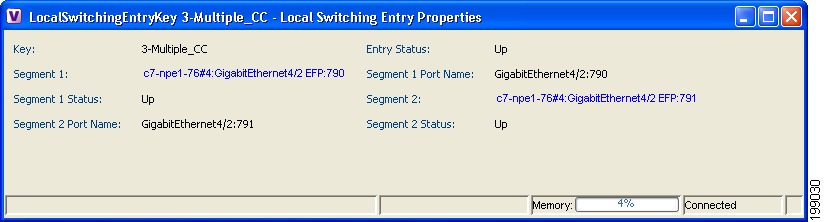
Figure 12-45 shows an example of the Local Switching Entry Properties window.
Figure 12-45 Local Switching Entry Properties Window
Table 12-30 describes the information displayed for the EFP cross-connect in the Local Switching Entry Properties window.
Step 4
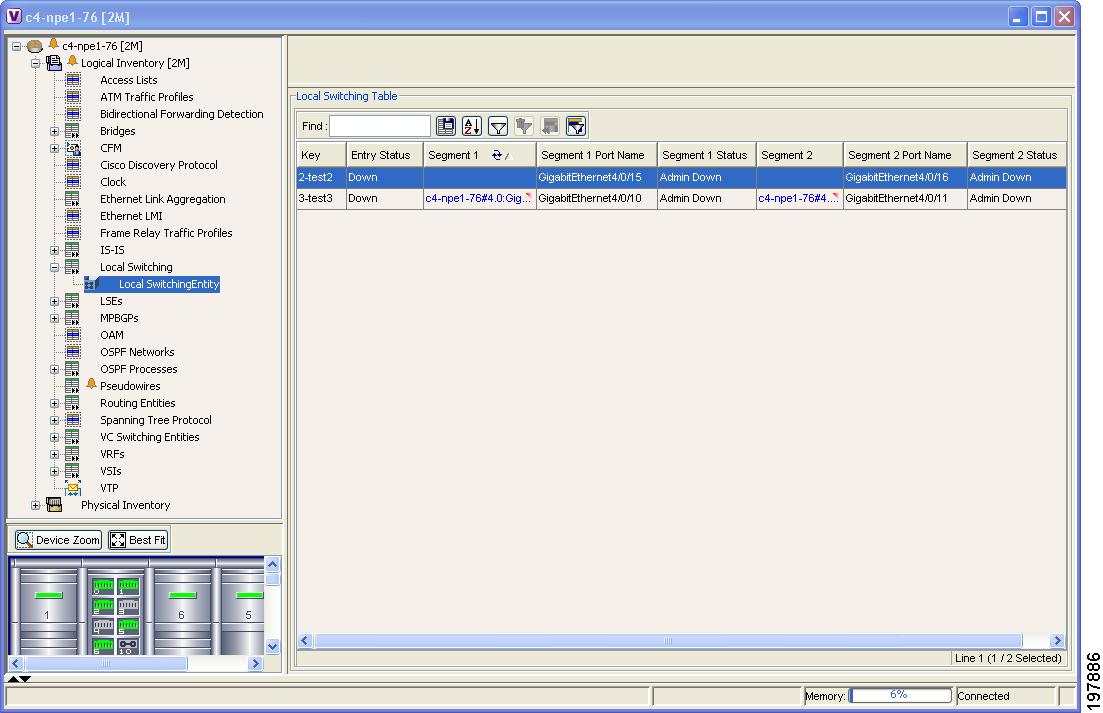
Figure 12-46 shows an example of the Local Switching Table.
Figure 12-46 Local Switching Table in Logical Inventory
Table 12-31 describes the information displayed in the Local Switching Table.
Working with VPLS and H-VPLS Instances
Virtual Private LAN Service (VPLS) is a Layer 2 VPN technology that provides Ethernet-based multipoint-to-multipoint communication over MPLS networks. VPLS allows geographically dispersed sites to share an Ethernet broadcast domain by connecting sites through pseudowires. The network emulates a LAN switch or bridge by connecting customer LAN segments to create a single bridged Ethernet LAN.
Hierarchical VPLS (H-VPLS) partitions the network into several edge domains that are interconnected using an MPLS core. The edge devices learn only of their local n-PE devices and therefore do not need large routing table support. The H-VPLS architecture provides a flexible architectural model that enables Ethernet multipoint and point-to-point Layer 2 VPN services, as well as Ethernet access to Layer 3 VPN services, enabling service providers to offer multiple services across a single high-speed architecture.
Cisco ANA discovers the following VPLS-related information from the network and constructs VPLS instances:
•
•
•
•
By using the identified VPLS instances, you can:
•
•
•
•
•
You can delete a VPLS forward from Cisco ANA if it is displayed with the reconciliation icon.
Adding VPLS Instances to a Map
You can add the VPLS instances that Cisco ANA discovers to maps as required.
To add a VPLS instance to a map:
Step 1
Step 2
•
•
Step 3
•
a. Choose Search.
b. To narrow the display to a range of VPLS instances or a group of VPLS instances, enter a search string in the search field.
c. Click Go.
For example, if you enter VPLS1, the VPLS instances that have names containing the string VPLS1 are displayed.
•
The VPLS instances that meet the specified search criteria are displayed in the Add VPLS Instance dialog box in table format. The dialog box also displays the date and time at which the list was generated. To update the list, click Refresh.
Note
For information about sorting and filtering the table contents, see Working with Cisco ANA Tables, page 2-40.
Step 4
Step 5
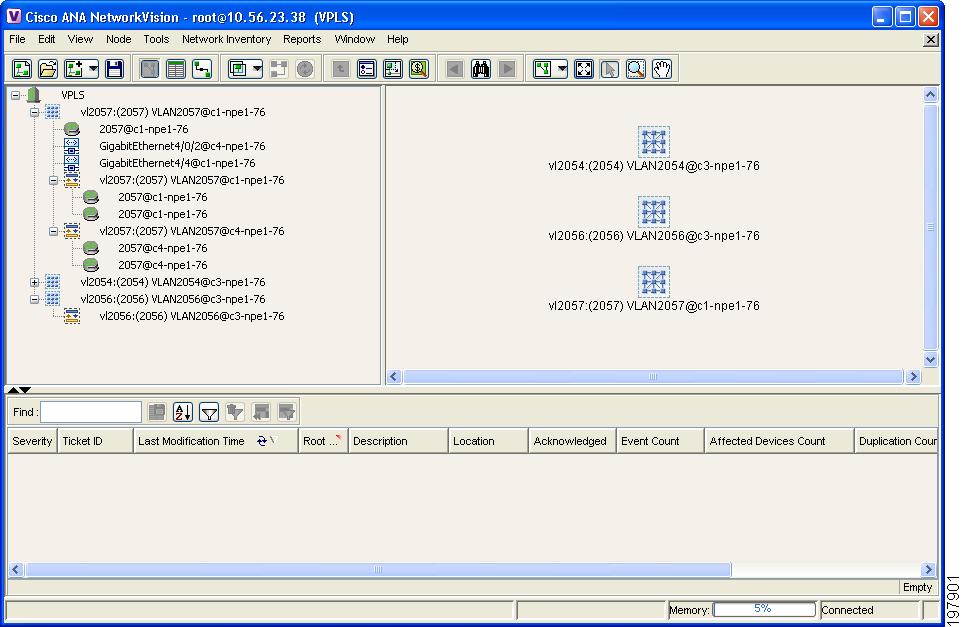
The VPLS instance is displayed in the navigation pane and in the content area. In addition, any associated tickets are displayed in the ticket pane. See Figure 12-47.
Figure 12-47 VPLS Instance in Cisco ANA NetworkVision Map
The VPLS instance information is saved with the map in the Cisco ANA database.
Using VPLS Instance Overlays
An VPLS instance overlay allows you to isolate the parts of a network that are being used by a specific VPLS instance.
To apply a VPLS instance overlay:
Step 1
Step 2
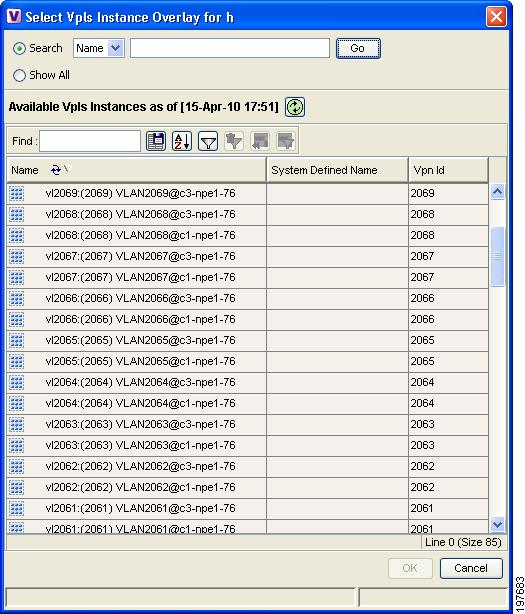
Figure 12-48 shows an example of the Select VPLS Instance Overlay for map dialog box.
Figure 12-48 Select VPLS Instance Overlay Dialog Box
Step 3
Step 4
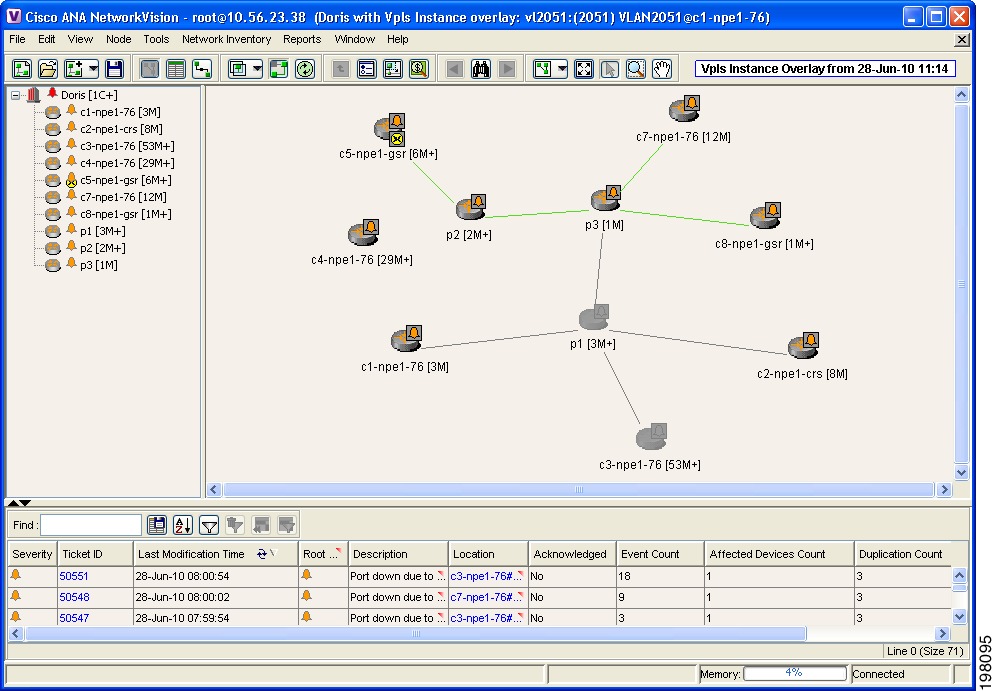
The elements being used by the selected VPLS instance are highlighted in the map while the other elements are dimmed, as shown in Figure 12-49.
Figure 12-49 VPLS Instance Overlay in Cisco ANA NetworkVision
Step 5
Step 6
Viewing Pseudowire Tunnel Links in VPLS Overlays
When a VPLS overlay is applied to a map in Cisco ANA NetworkVision, you can view the details of the pseudowires that are interconnected through selected links.
To view unidirectional or bidirectional pseudowire traffic links when a VPLS overlay is applied to a map:
Step 1
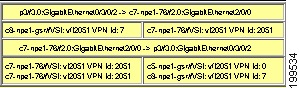
Link information is displayed as shown in Figure 12-50.
Figure 12-50 Link Callout Window for a VPLS Overlay
The callout window displays the following information for each link represented by the selected link:
•
•
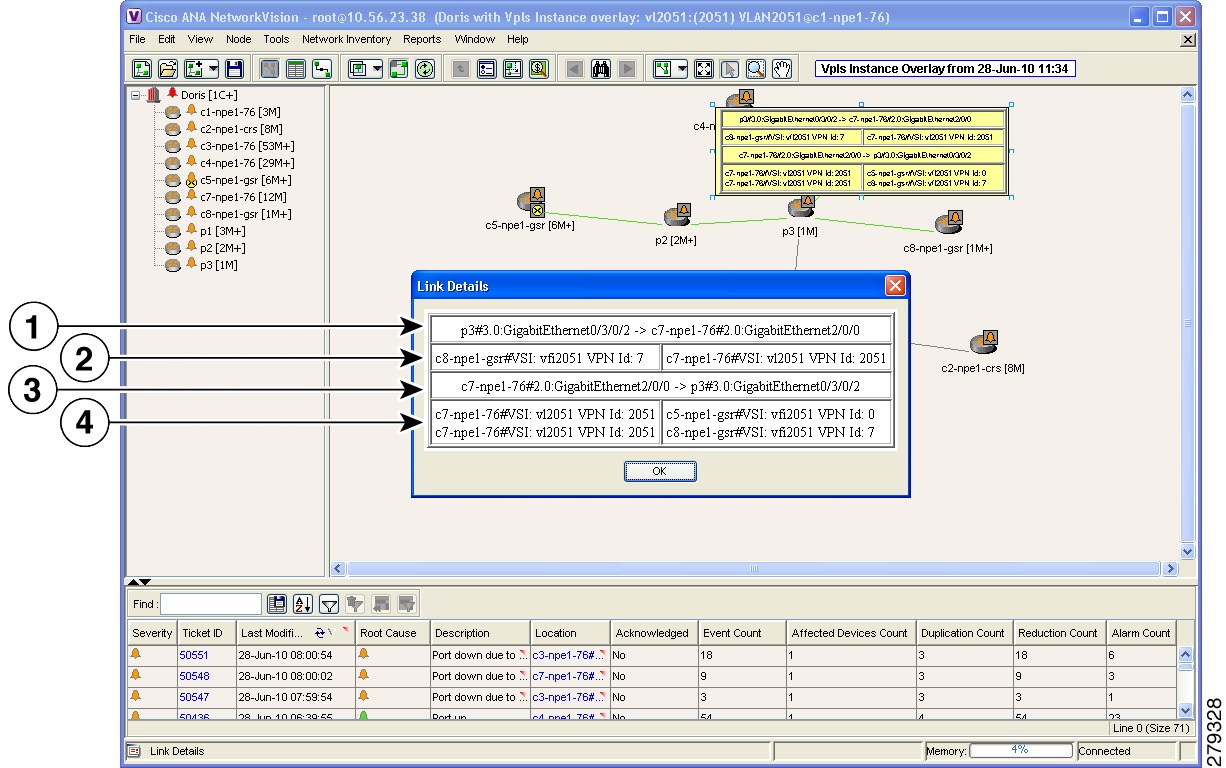
Step 2
The details about the link are displayed in the Link Details window as shown in Figure 12-51.
Figure 12-51 Link Details Window for a VPLS Overlay
The Link Details window provides the following information:
Step 3
Step 4
Viewing VPLS-Related Properties
Cisco ANA NetworkVision enables you to view the properties of the following VPLS-related elements:
•
•
•
Viewing VPLS Instance Properties
To view the properties of a VPLS instance in Cisco ANA NetworkVision, open the VPLS Instance Properties window in either of the following ways:
•
•
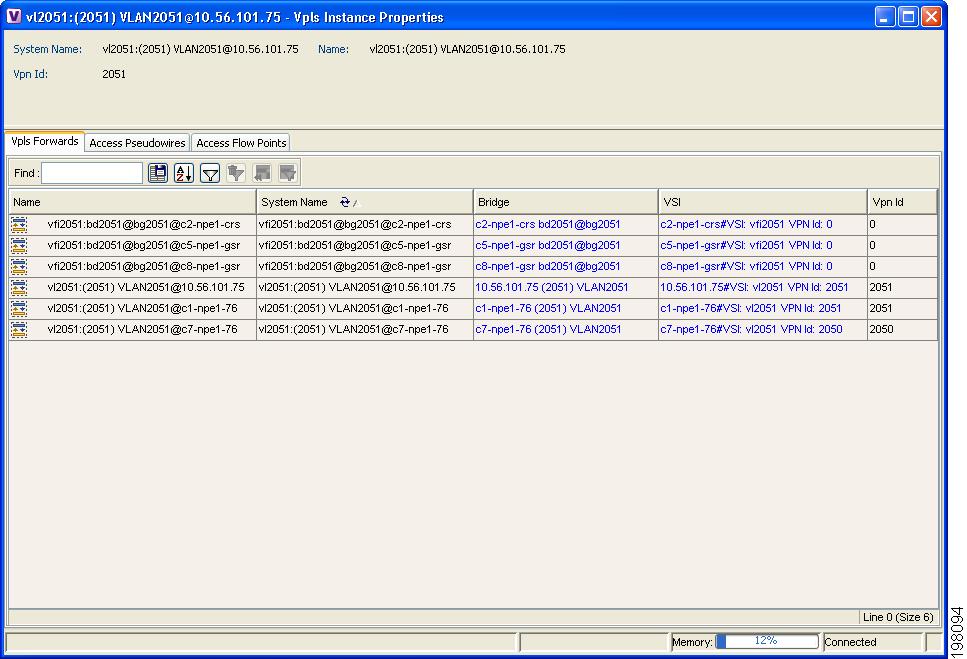
Figure 12-52 shows an example of the VPLS Instance Properties window.
Figure 12-52 VPLS Instance Properties Window
Table 12-32 describes the information that is displayed for VPLS instance properties.
The tabs that appear in the window depend on the VPLS instance and its configuration.
Table 12-32 VPLS Instance Properties
System Name
Name that Cisco ANA assigns to the VPLS instance.
Name
User-defined name of the VPLS instance.
When the VPLS instance is created, the system name and this name are the same. If you change the name of the VPLS instance (right-click, then choose Rename), the changed name appears in this field whereas the system name retains the original name.
VPN ID
VPN identifier used in an MPLS network to distinguish between different VPLS traffic.
Name
User-defined name of the VPLS forward.
System Name
Name that Cisco ANA assigns to the VPLS forward.
Bridge
Bridge that the VSI is configured to use, hyperlinked to the bridge table in logical inventory.
VSI
VSI hyperlinked to the relevant entry in logical inventory.
VPN ID
VPN identifier for the VSI.
Name
Pseudowire name.
Port
VSI on which the pseudowire is configured, hyperlinked to the entry in logical inventory.
Local Router IP
Local router IP address on which the pseudowire is configured.
Tunnel ID
Virtual circuit identifier of the pseudowire.
PTP Tunnel
Hyperlinked entry to the pseudowire properties in logical inventory.
Peer Router IP
Peer router IP address on which the pseudowire is configured.
Peer OID
Hyperlinked entry to the pseudowire properties of the peer.
Pseudowire Type
Type of pseudowire, such as Ethernet, Ethernet Tagged, CESoPSN Basic, PPP, or SAToP.
For a complete list of pseudowire types, see the Cisco Active Network Abstraction 3.7.1 Theory of Operations Guide.
Pseudowire Edge Binding Type
Pseudowire endpoint association:
•
•
•
•
•
•
Name
Access flow point name. Double-click to view port connector properties.
Port
Interface configured as a flow point, hyperlinked to the interface in physical inventory.
Working with Pseudowires and Pseudowire Overlays
Cisco ANA supports the discovery and modeling of Any Transport over MPLS (AToM) and Ethernet over MPLS (EoMPLS) domains that span multisegment pseudowires. This support enables you to:
•
•
•
•
•
Adding Pseudowires to a Map
You can add a pseudowire that Cisco ANA discovers to maps as required.
To add a pseudowire to a map:
Step 1
Step 2
•
•
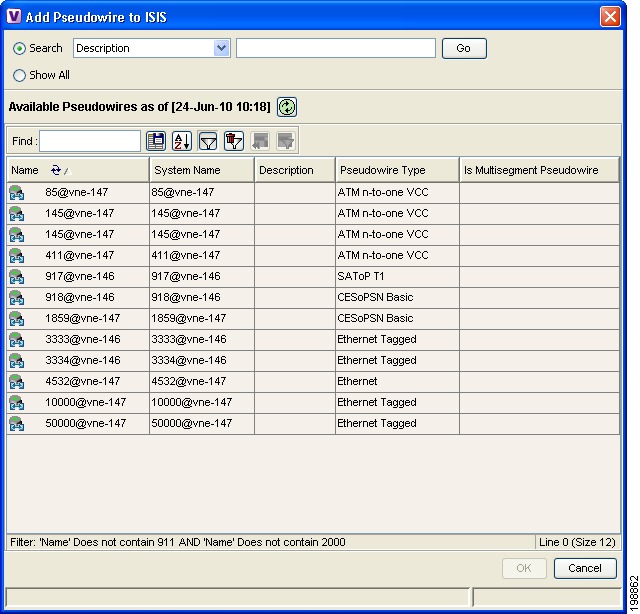
Figure 12-53 shows an example of the Add Pseudowire dialog box.
Figure 12-53 Add Pseudowire Dialog Box
Step 3
•
a. Choose Search.
b. To narrow the display to a range of pseudowire or a group of pseudowires, enter a search string in the search field.
c. Click Go.
For example, if you enter pseudo1, the pseudowires that have names containing the string "pseudo1" are displayed.
•
The pseudowires that meet the specified search criteria are displayed in the Add Pseudowire dialog box in table format. The dialog box also displays the date and time at which the list was generated. To update the list, click Refresh.
Note
For information about sorting and filtering the table contents, see Working with Cisco ANA Tables, page 2-40.
Step 4
Step 5
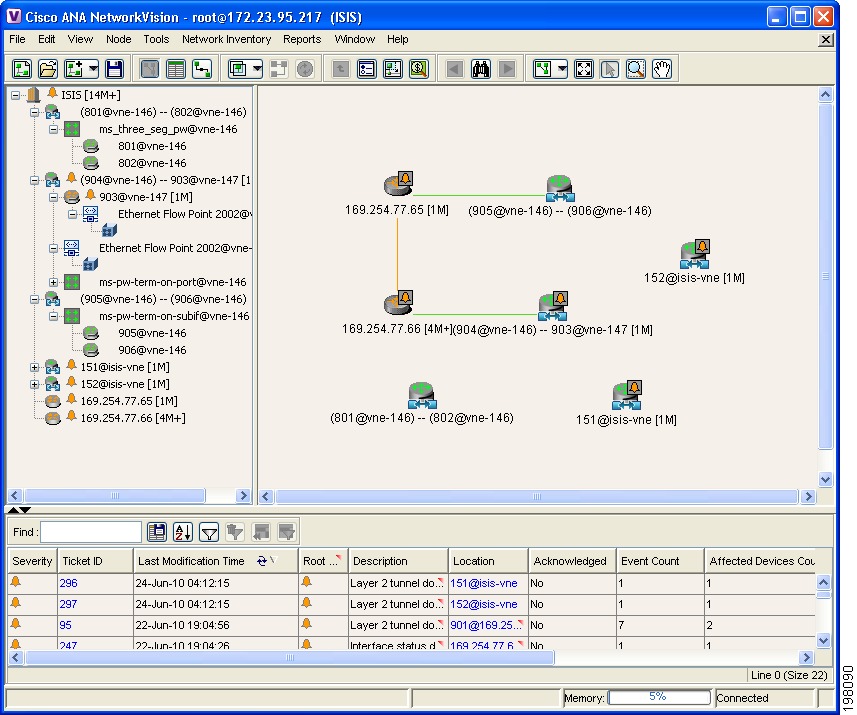
The pseudowire is displayed in the navigation pane and in the content area. In addition, any associated tickets are displayed in the ticket pane. See Figure 12-54.
Figure 12-54 Pseudowire in Cisco ANA NetworkVision Map
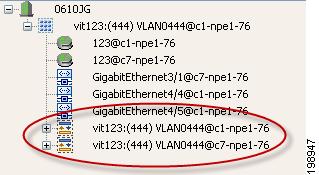
Step 6
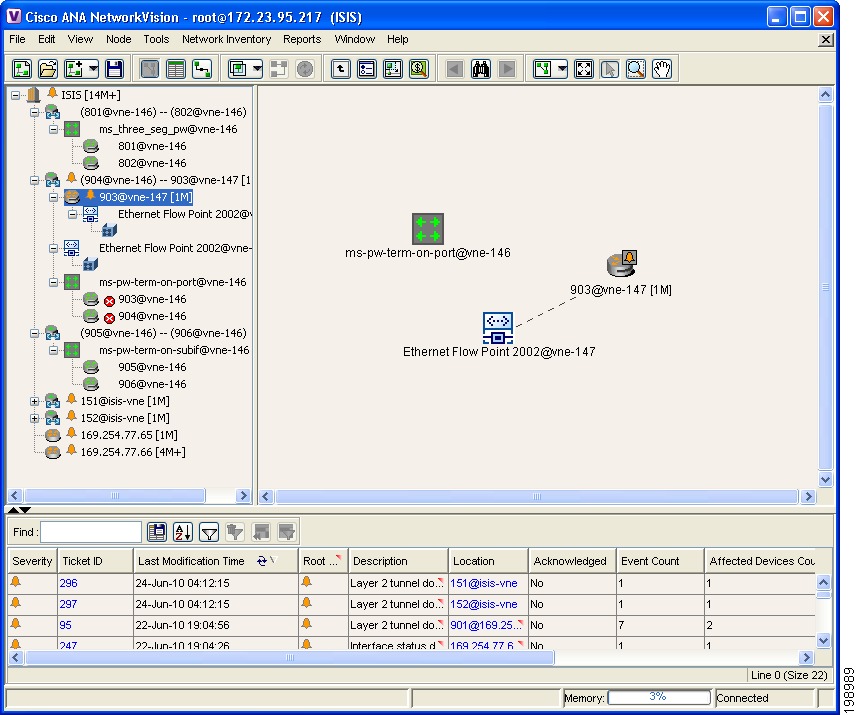
Figure 12-55 shows an example of an expanded pseudowire in Cisco ANA NetworkVision.
Figure 12-55 Pseudowire Components in Cisco ANA NetworkVision Maps
The pseudowire information is saved with the map in the Cisco ANA database.
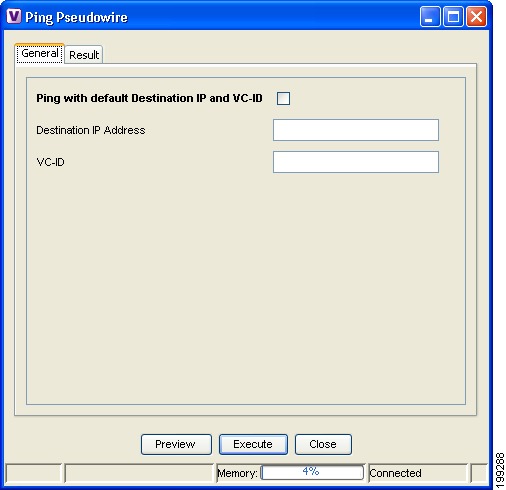
Pinging a Pseudowire
Cisco ANA enables you to ping a peer router to ensure that the pseudowire tunnel is available.
To ping a pseudowire peer router:
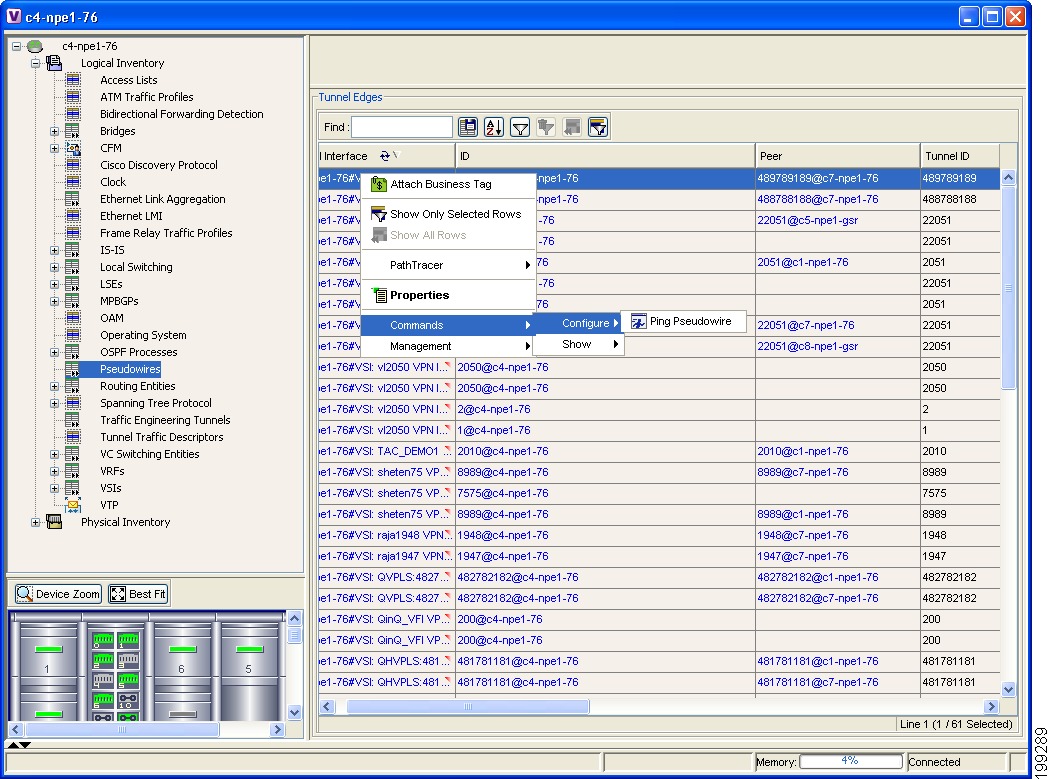
Step 1
Step 2
Step 3
Step 4
Figure 12-56 Ping Pseudowire Command
The Ping Pseudowire dialog box is displayed with the General tab as shown in Figure 12-57.
Figure 12-57 Ping Pseudowire Dialog Box - General Tab
Step 5
•
•
•
Step 6
The command is displayed in the Result tab for your review.
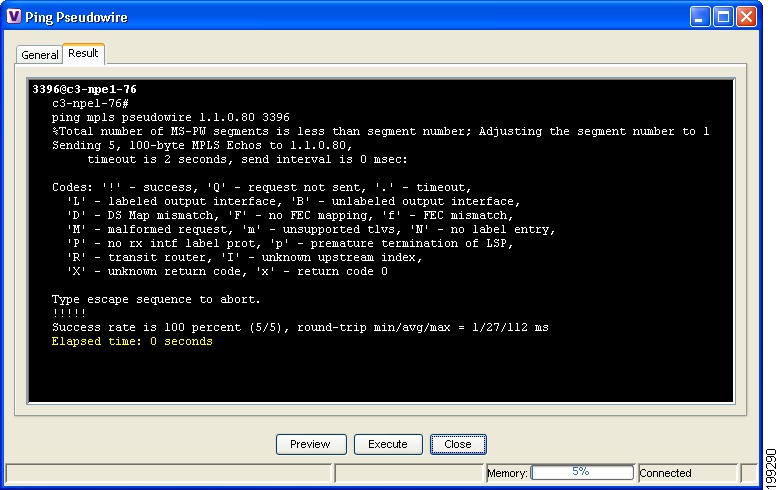
Step 7
The result of the command is displayed in the Result tab, as shown in Figure 12-58.
Figure 12-58 Ping Pseudowire Dialog Box - Result Tab
Step 8
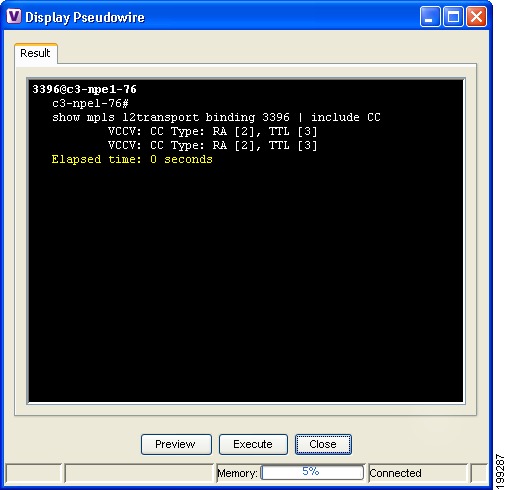
Displaying Pseudowire Information
To view Virtual Circuit Connectivity Verification (VCCV) and Control Channel (CC) information for a pseudowire endpoint:
Step 1
Step 2
Step 3
Step 4
•
•
When you click Execute, the results are displayed in the dialog box as shown in Figure 12-59.
Figure 12-59 Display Pseudowire Dialog Box
Step 5
•
•
•
–
- CW [1]—Control Word
- RA [2]—Router Alert
- TTL [3]—Time to Live
- Unkn [x]—Unknown
–
Step 6
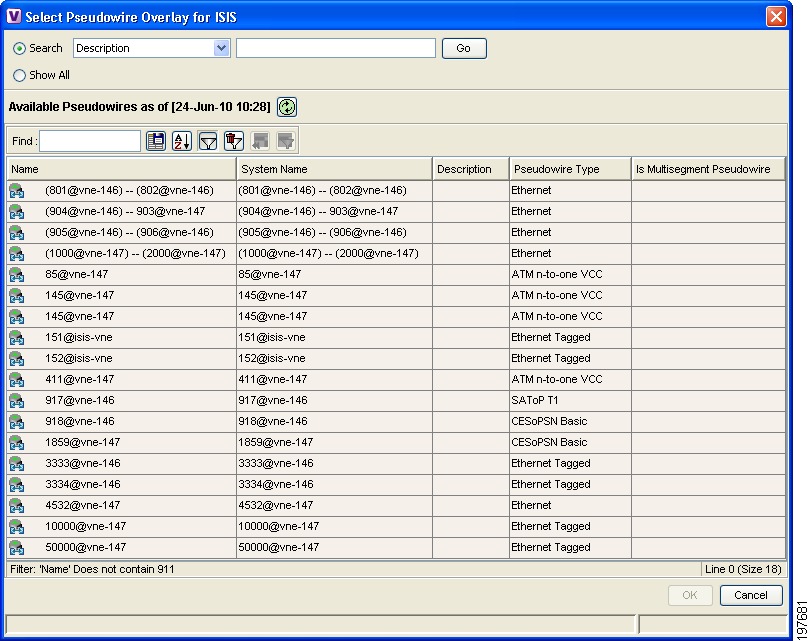
Applying Pseudowire Overlays
A pseudowire overlay allows you to isolate the parts of a network that are being used by a specific pseudowire.
To apply a pseudowire overlay:
Step 1
Step 2
Figure 12-60 shows an example of the Select Pseudowire Overlay for map dialog box.
Figure 12-60 Select Pseudowire Overlay Dialog Box
Step 3
Step 4
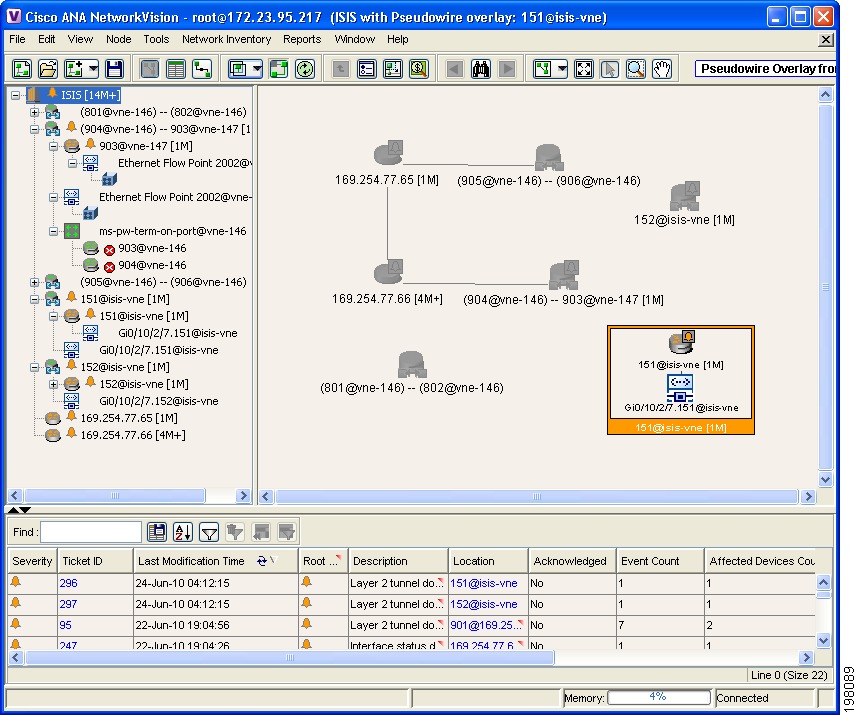
The elements being used by the selected pseudowire are highlighted in the map while the other elements are dimmed, as shown in Figure 12-61.
Figure 12-61 Pseudowire Overlay in Cisco ANA NetworkVision
Step 5
Step 6
Viewing Pseudowire Properties
To view pseudowire properties:
Step 1
Step 2
a.
b.
The Tunnel Edges table is displayed, listing the pseudowire endpoints configured on the selected element. For a description of the information contained in the Tunnel Edges table, see Table 17-15 on page 17-36.
Step 3
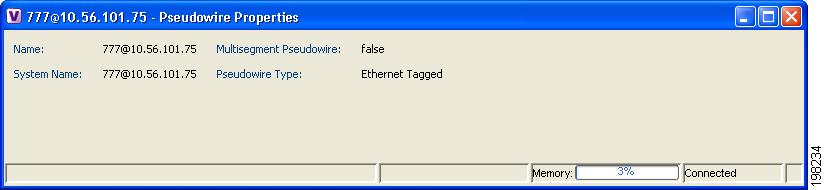
The Pseudowire Properties window is displayed as shown in Figure 12-62.
Figure 12-62 Pseudowire Properties Window
Table 12-33 describes the information presented in the Pseudowire Properties window.
Table 12-33 Pseudowire Properties Window
Name
Name of the pseudowire.
Multisegment Pseudowire
Whether or not the pseudowire is multisegment: True or False.
System Name
Internal or system-generated name of the pseudowire.
Pseudowire Type
Type of pseudowire, such as Ethernet, Ethernet Tagged, CESoPSN Basic, PPP, or SAToP.
For a complete list of pseudowire types, see the Cisco Active Network Abstraction 3.7.1 Theory of Operations Guide.
Step 4
The Tunnel Properties window containing the pseudowire endpoint properties is displayed as shown in Figure 12-15 and described in Table 12-16.
Step 5
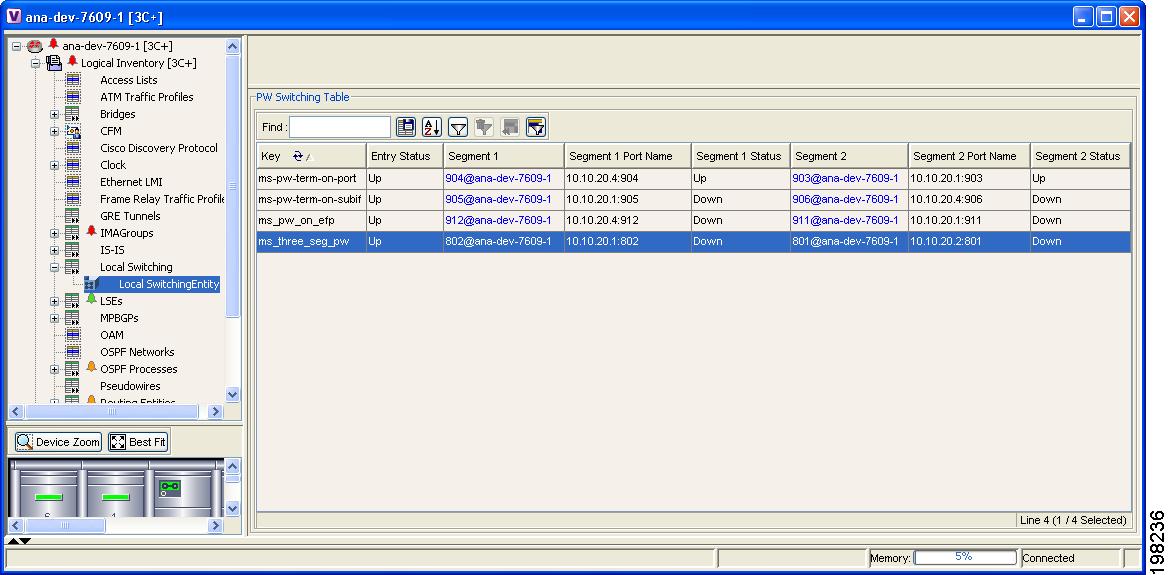
The PW Switching table is displayed as shown in Figure 12-63.
Figure 12-63 PW Switching Table in Logical Inventory
Table 12-34 describes the information displayed in the PW Switching table.
Step 6
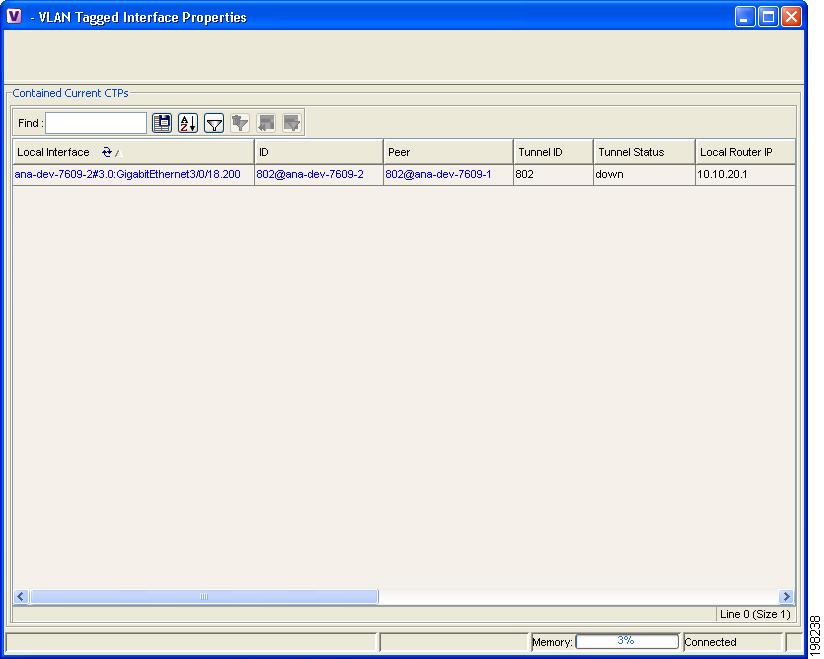
The Contained Current CTPs table is displayed as shown in Figure 12-64.
Note
Figure 12-64 Contained Current CTPs Table
Table 12-35 describes the information displayed in the Contained Current CTPs table.
Table 12-35 Contained Current CTPs Table
Local Interface
The name of the subinterface or port, hyperlinked to the interface in physical inventory.
ID
The tunnel identifier, hyperlinked to Pseudowires Tunnel Edges table in logical inventory.
Peer
The peer tunnel identifier, hyperlinked to the peer pseudowire tunnel in logical inventory.
Tunnel ID
The identifier that, along with the router IP addresses of the two tunnel edges, identifies the tunnel.
Tunnel Status
The operational state of the tunnel: Up or Down.
Local Router IP
The IP address of this tunnel edge, which is used as the router identifier.
Peer Router IP
The IP address of the peer tunnel edge, which is used as the router identifier.
Pseudowire Type
Type of pseudowire, such as Ethernet, Ethernet Tagged, CESoPSN Basic, PPP, or SAToP.
For a complete list of pseudowire types, see the Cisco Active Network Abstraction 3.7.1 Theory of Operations Guide.
Local MTU
The size, in bytes, of the MTU on the local interface.
Remote MTU
The size, in bytes, of the MTU on the remote interface.
Local VC Label
The MPLS label that is used by this router to identify or access the tunnel. It is inserted in the MPLS label stack by the local router.
Peer VC Label
The MPLS label that is used by this router to identify or access the tunnel. It is inserted in the MPLS label stack by the peer router.
Signaling Protocol
The protocol used to build the tunnel, such as LDP or TDP.
Preferred Path Tunnel
The path to be used for pseudowire traffic.
Step 7
See Viewing EFP Properties for the information that is displayed for EFPs.
Working with Ethernet Services
Ethernet services are created when the following business elements are linked to one another:
•
•
–
–
•
–
–
•
•
•
If a VPLS, network pseudowire, cross-connect, or network VLAN object is not connected to another business element, it resides alone in an Ethernet service.
For more information about Cisco ANA and Ethernet services, see the Cisco Active Network Abstraction 3.7.1 Theory of Operations Guide.
Cisco ANA discovers Ethernet services and enables you to add them to maps, apply overlays, and view their properties. See the following topics for more information:
•
•
•
Adding Ethernet Services to a Map
You can add the Ethernet services that Cisco ANA discovers to maps as required.
To add an Ethernet service to a map:
Step 1
Step 2
•
•
Step 3
•
a. Choose Search, and then choose a search category: EVC Terminating EFPs, Name, or System Name.
b. To narrow the display to a range of Ethernet services or a group of Ethernet services, enter a search string in the search field.
c. Click Go.
For example, if you choose Name and enter EFP1, the network elements that have names beginning with EFP1 are displayed.
•
The available elements that meet the specified search criteria are displayed in the Add Ethernet Service dialog box in table format. The dialog box also displays the date and time at which the list was generated. To update the list, click Refresh.
Note
For information about sorting and filtering the table contents, see Working with Cisco ANA Tables, page 2-40.
Step 4
Step 5
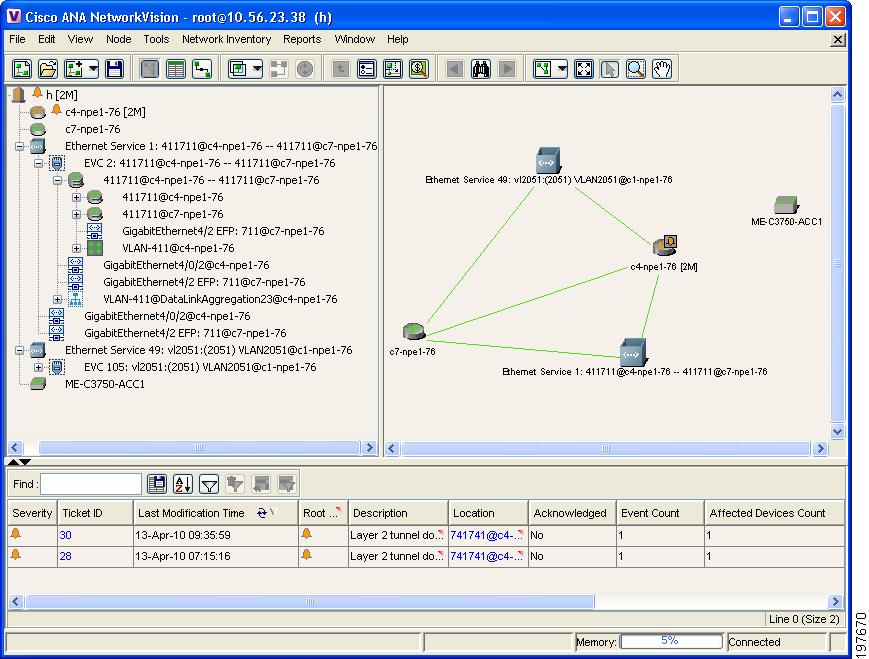
The Ethernet service is displayed in the navigation pane and in the content area. In addition, any associated tickets are displayed in the ticket pane. See Figure 12-65.
Figure 12-65 Ethernet Service in Cisco ANA NetworkVision Map
The Ethernet service information is saved with the map in the Cisco ANA database.
Using Ethernet Service Overlays
An Ethernet service overlay allows you to isolate the parts of a network that are being used by a specific Ethernet service.
To apply an Ethernet service overlay:
Step 1
Step 2
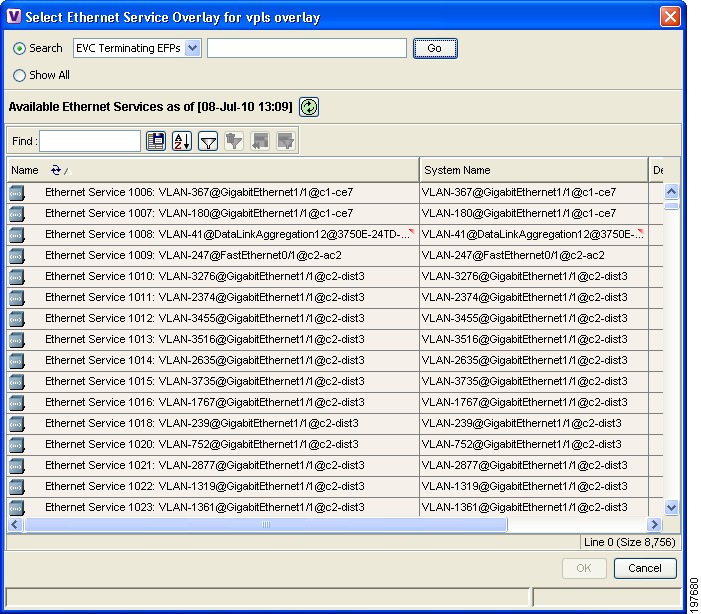
Figure 12-66 shows an example of the Select Ethernet Service Overlay for map dialog box.
Figure 12-66 Select Ethernet Service Overlay Dialog Box
Step 3
Step 4
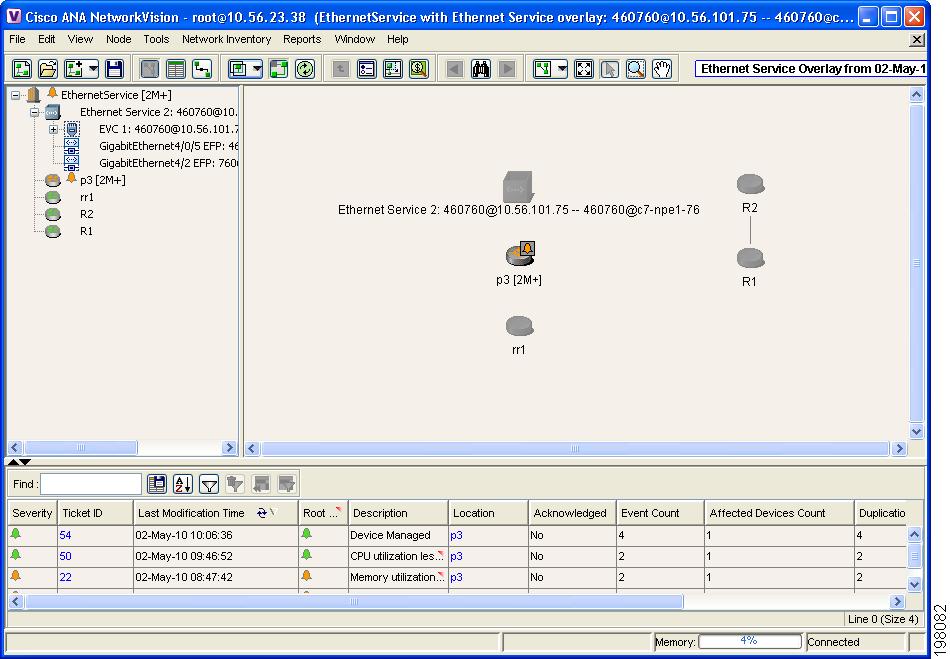
The elements being used by the selected Ethernet service are highlighted in the map while the other elements are dimmed, as shown in Figure 12-67.
Figure 12-67 Ethernet Service Overlay in Cisco ANA NetworkVision
Step 5
Step 6
Viewing Ethernet Service Properties
To view Ethernet service properties:
Step 1
Step 2
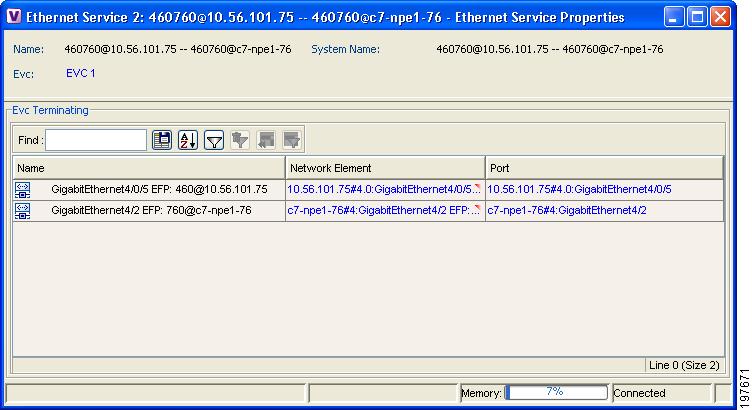
Figure 12-68 shows an example of an Ethernet Service Properties window.
Figure 12-68 Ethernet Service Properties Window
Table 12-36 describes the information that is displayed for an Ethernet service.
Step 3
Figure 12-69 shows an example of the EVC Properties window.
Figure 12-69 EVC Properties Window
Table 12-37 describes the information that is displayed in the EVC Properties window. The tabs that are displayed in the window depend on the EVC links.
Table 12-37 EVC Properties Window
System Name
Name of the system on which the EVC is configured.
Name
EVC name.
Name
VLAN name.
ID
VLAN identifier.
Ethernet Flow Domain
Name of the Ethernet flow domain.
System Name
VLAN system name.
Description
Brief description of the VLAN.
Name
Pseudowire name.
System Name
System on which the pseudowire is configured.
Description
Brief description of the pseudowire.
Pseudowire Type
Type of pseudowire. For a complete list of pseudowire types, see the Cisco Active Network Abstraction 3.7.1 Theory of Operations Guide.
Is Multisegment Pseudowire
Whether or not the pseudowire is multisegment: True or False.
Name
VPLS name.
System Defined Name
VPLS system name.
VPN ID
Identifier of associated VPN.
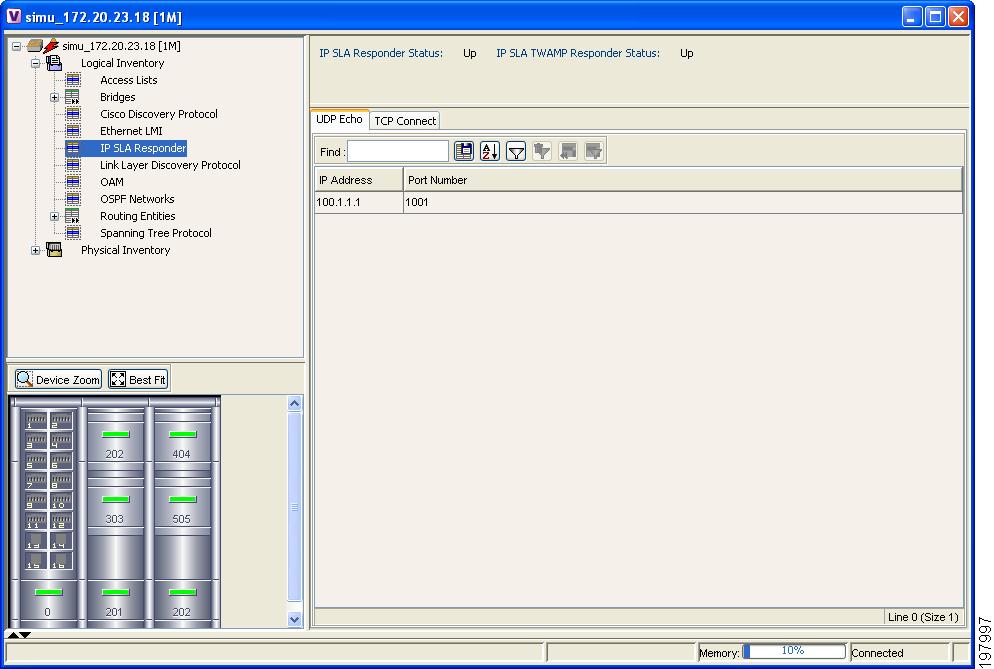
Viewing IP SLA Responder Service Properties
Cisco IOS Service Level Agreements (SLAs) software allows you to analyze IP service levels for IP applications and services by using active traffic monitoring to measure network performance.
The IP SLA responder is a component embedded in the destination Cisco device that allows the system to anticipate and respond to IP SLAs request packets. The responder provides accurate measurements without requiring dedicated probes. The responder uses the Cisco IOS IP SLAs Control Protocol to provide a mechanism through which it can be notified on which port it should listen and respond.
Two-Way Active Measurement Protocol (TWAMP) defines a standard for measuring round-trip network performance between any two devices that support the protocol.
In Cisco ANA 3.7.1, IP SLA Responder service is supported on the following devices:
•
•
To view IP SLA Responder service properties:
Step 1
Step 2
IP SLA Responder properties are displayed as shown in Figure 12-70.
Figure 12-70 IP SLA Responder in Logical Inventory
Table 12-38 describes the properties displayed for IP SLA Responder service.
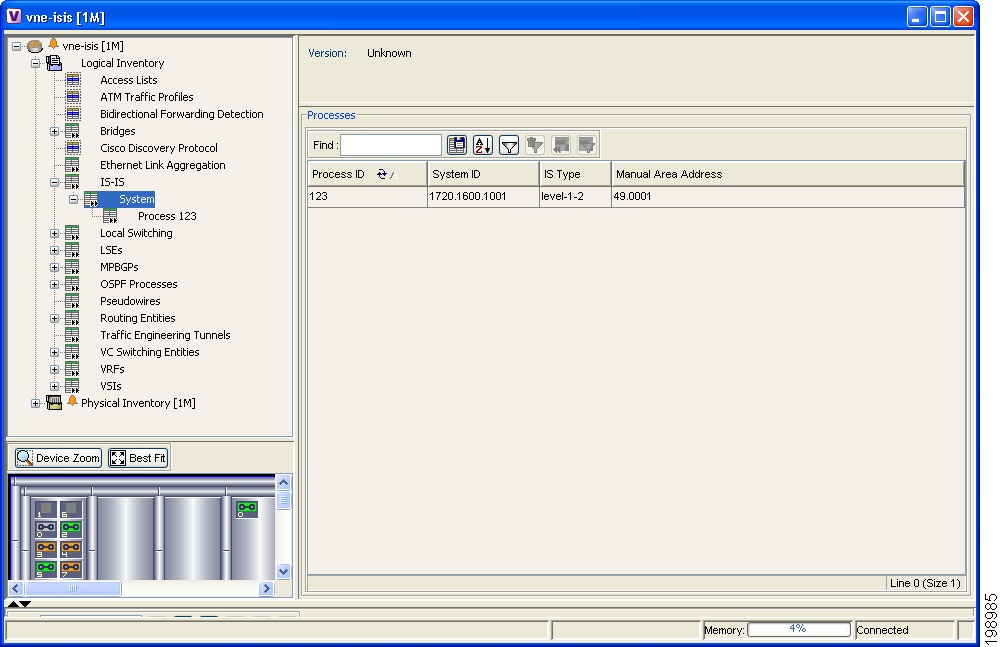
Viewing IS-IS Properties
Intermediate System-to-Intermediate System (IS-IS) protocol is a routing protocol developed by the ISO. It is a link-state protocol where IS routers exchange routing information based on a single metric to determine network topology. It behaves in a manner similar to OSPF in the TCP/IP network.
IS-IS networks contain end systems, intermediate systems, areas, and domains. End systems are user devices. Intermediate systems are routers. Routers are organized into local groups called areas, and areas are grouped into a domain.
To view IS-IS properties:
Step 1
Step 2
Figure 12-71 shows an example of the ISIS window with the Process table in logical inventory.
Figure 12-71 ISIS Window in Logical Inventory
Table 12-39 describes the information that is displayed in this window and the Processes table.
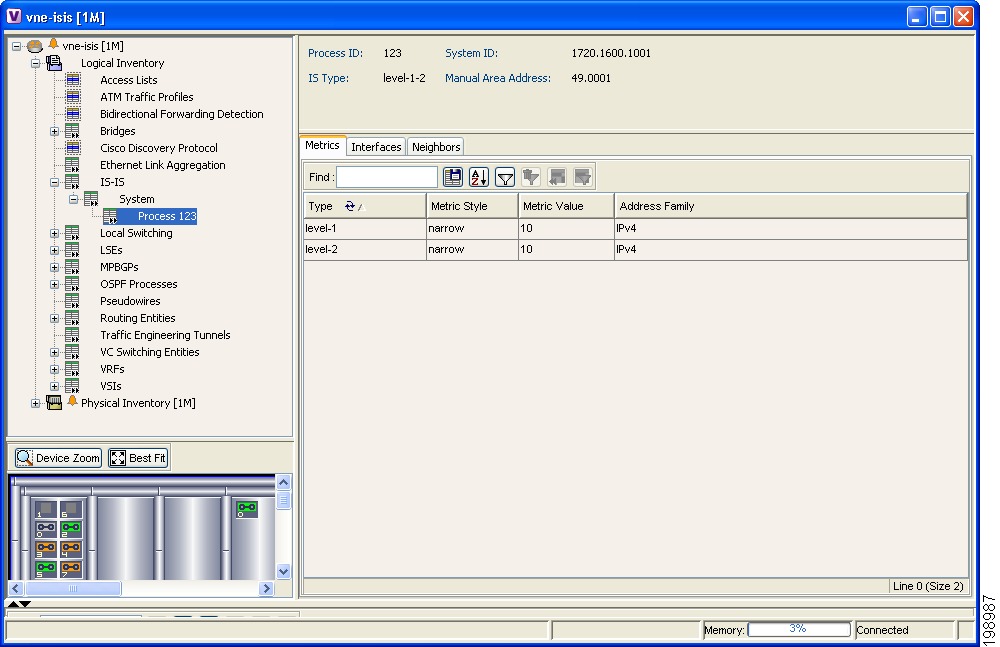
Step 3
Figure 12-72 shows an example of the information that is displayed for the IS-IS process.
Figure 12-72 IS-IS Process Properties in Logical Inventory
Table 12-40 describes the information that is displayed for the selected IS-IS process.
Viewing OSPF Properties
Cisco ANA supports the following versions of OSPF:
•
•
•
Using Cisco ANA NetworkVision you can view OSPF properties for:
•
•
•
To view OSPF properties:
Step 1
Step 2
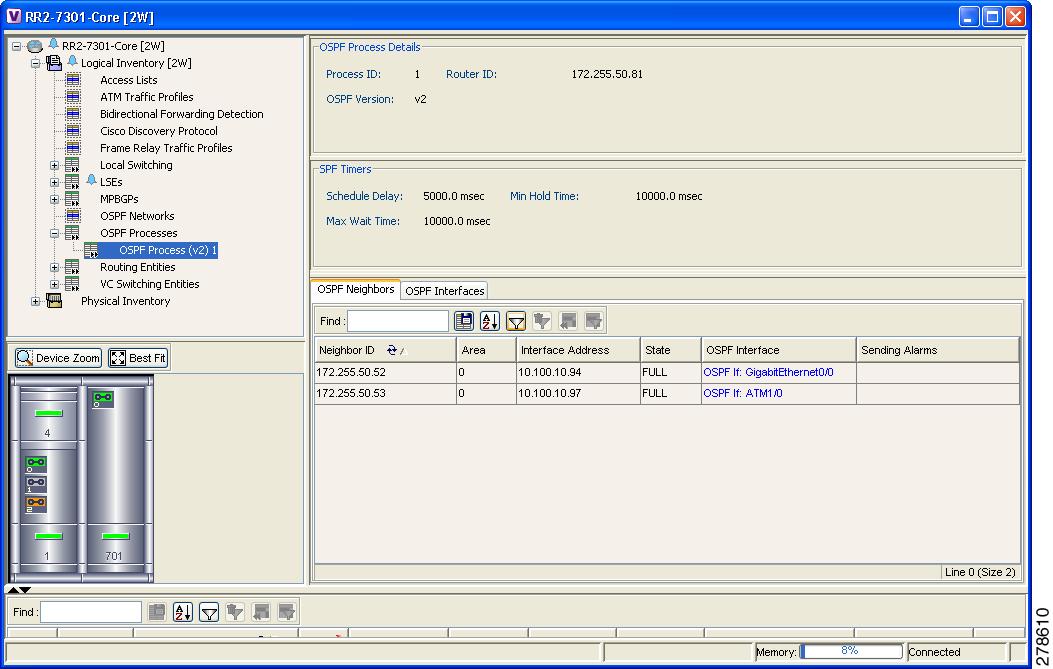
For example, in Figure 12-73, the entry in the navigation tree is OSPF Process (v2) 1.
Figure 12-73 OSPF Processes in Logical Inventory
Table 12-41 describes the information that is displayed for OSPF processes.
Table 12-41 OSPF Processes in Logical Inventory
Process ID
Unique process identifier.
Router ID
Router IP address.
OSPF Version
OSPF version: v1, v2, or v3.
Schedule Delay
Number of milliseconds to wait after a change before performing the shortest path first (SPF) calculation.
Min Hold Time
Minimum number of milliseconds to wait between two consecutive SPF calculations.
Max Wait Time
Maximum number of milliseconds to wait between two consecutive SPF calculations.
Neighbor ID
OSPF neighbor IP address
Area
OSPF area identifier.
Interface Address
IP address of the interface on the neighbor configured for OSPF.
State
State of the communication with the neighbor: Down, Attempt, Init, 2-Way, Exstart, Exchange, Loading, and Full.
OSPF Interface
Hyperlinked entry to the OSPF Interface Properties window.
The OSPF Interfaces window displays the same information as in the OSPF Interfaces Table below.
Sending Alarms
Status of sending alarms on the interface: True or False.
IP Interface
OSPF interface, hyperlinked to relevant entry in the routing entity IP Interfaces table in logical inventory.
For more information about the IP Interfaces table, see Table 17-6.
Internet Address
OSPF interface IP address.
Area ID
OSPF area identifier.
Priority
Eight-bit unsigned integer that specifies the priority of the interface. Values range from 0 to 255. Of two routers, the one with the higher priority takes precedence.
Cost
Specified cost of sending a packet on the interface, expressed as a metric. Values range from 1 to 65535.
Status
State of the interface: Up or Down.
State
OSPF state: BDR, DR, DR-Other, Waiting, Point-to-Point, or Point-to-Multipoint.
Network Type
Type of OSPF network: Broadcast, Nonbroadcast Multiple Access (NBMA), Point-to-Multipoint, Point-to-Point, or Loopback.
DR Address
Designated router IP address.
BDR Address
Backup designated router IP address.
Sending Alarms
Status of sending alarms on the interface: True or False.