-
Cisco Active Network Abstraction User Guide, 3.7.1
-
Preface
-
Cisco ANA Client Overview
-
Working with the Cisco ANA NetworkVision Client
-
Viewing Network Element Properties
-
Working with Cisco ANA NetworkVision Maps
-
Working with Links
-
Working with Business Tags and Business Elements
-
Working with the Cisco ANA EventVision Client
-
Tracking Faults Using Cisco ANA EventVision
-
Working with Tickets in Cisco ANA NetworkVision
-
Working with Reports
-
Using Cisco ANA PathTracer to Diagnose Problems
-
Monitoring Carrier Ethernet Services
-
Monitoring Carrier-Grade NAT Properties
-
Monitoring DWDM Properties
-
Viewing Ethernet Operations, Administration, and Maintenance Tool Properties
-
IPv6 and IPv6 VPN over MPLS
-
Monitoring MPLS Services
-
Monitoring MToP Services
-
Viewing SBC Properties
-
Icon Reference
-
Index
-
 Feedback
Table Of Contents
Tracking Faults Using Cisco ANA EventVision
User Roles Required to Work with Cisco ANA EventVision
Viewing Events and Tickets in Cisco ANA EventVision
Working in Cisco ANA EventVision
Refreshing Cisco ANA EventVision Information
Tracking Faults Using Cisco ANA EventVision
The following topics describe how to use Cisco ANA EventVision to track faults:
•
User Roles Required to Work with Cisco ANA EventVision
•
•
Note
User Roles Required to Work with Cisco ANA EventVision
Table 8-1 identifies the roles that are required to work with Cisco ANA EventVision. Cisco ANA determines whether you are authorized to perform a task as follows:
•
•
For more information on user authorization, see the Cisco Active Network Abstraction 3.7.1 Administrator Guide.
Viewing Events and Tickets in Cisco ANA EventVision
Events are displayed according to event categories, which are represented by tabs in the Cisco ANA EventVision window. Each tab displays an events list log that provides event information for the specific event category. Events can be of system type or network type.
The Ticket tab displays the tickets that have been generated for correlated events.
Events and tickets are sorted by date, with the latest item displayed first and the oldest item displayed last. You can define a filter to be used as well as the number of items to be displayed in the list, by using the Cisco ANA EventVision Options dialog box. Each tab displays the specified number of entries per page as defined in the Cisco ANA EventVision Options dialog box.
For more information, see Selecting Cisco ANA EventVision Viewing Options, page 7-8.
Because the lists of events and tickets can be lengthy, you can use the left and right arrows on the navigation toolbar to move through the records. You can also use the submenus that are available from View > Go To in the main menu.
All Tab
The All tab displays information about all events. Additional information specific to the event category can be viewed in the Event Properties window or individual category tabs.
When you launch Cisco ANA EventVision, the All tab is not displayed. You can view this tab by choosing File > Open All Tab.
Note
You can disable the All tab by following the instructions provided in the Cisco Active Network Abstraction 3.7.1 Installation Guide.Table 8-2 describes the information that is displayed in the All tab.
Table 8-2 All Tab
Severity
Icon of a bell, colored according to the severity of the alarm on the event (the color and type of alarm are displayed in the Properties window Severity field). See Event Status Indicators, page 7-4.
Event ID
Event identifier, assigned sequentially.
Time
Date and time when the event occurred and was logged and recorded.
Description
Description of the event.
Location
Entity that triggered the event.
Event Type
Type of event: Audit, Provisioning, Security, Service, Syslog, System, V1 Trap, V2 Trap, or V3 Trap.
System Event Tabs
The following tabs in the Cisco ANA EventVision window display the system events:
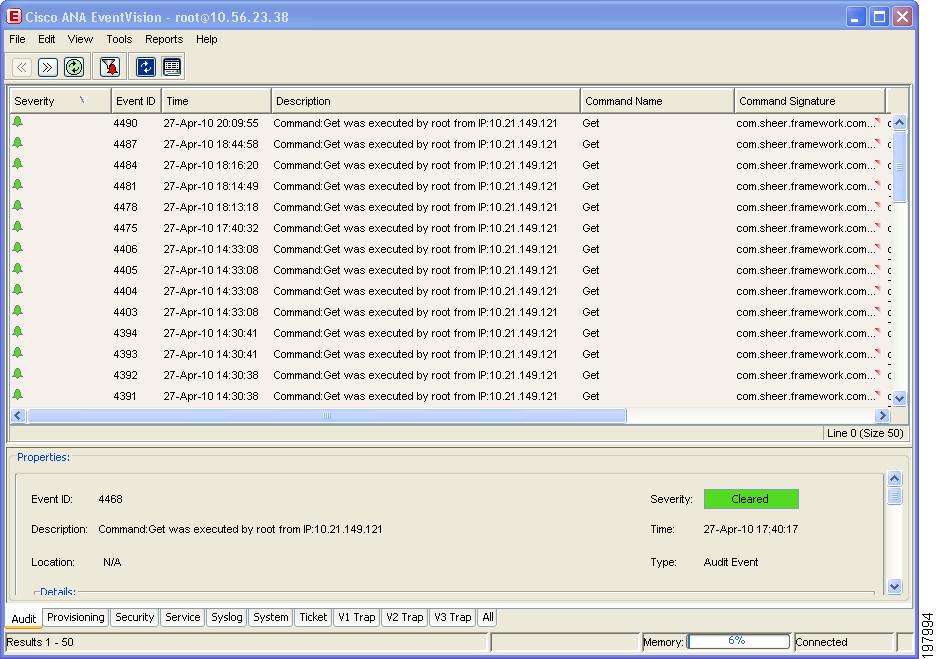
Audit Tab
The Audit tab displays all events generated for each command or request in Cisco ANA; for example, opening Cisco ANA EventVision displays the Get command as shown in Figure 8-1.
Figure 8-1 Audit Tab
Table 8-3 describes the information that is displayed in the Audit tab.
Table 8-3 Audit Tab
Severity
Icon of a bell, colored according to the severity of the alarm on the event (the color and type of alarm are displayed in the Properties window Severity field). See Event Status Indicators, page 7-4.
Event ID
Sequential ID number of the event.
Time
Date and time when the event happened and was logged and recorded.
Description
Aggregation of portions of the same fields in the Audit Command fields.
Command Name
Audit-specific command name, prefaced by, for example, Get, Update, or Find.
Command Signature
Actual command run by Cisco ANA, such as GetEventViewerProperties.
Command Parameters
Command parameters issued with the command identified in the Command Name column.
Originating IP
IP address of the client that issued the command
User Name
Name of the user who initiated the command.
The audit service enables you to audit all the commands executed in the system; for example, the Get command can be audited. The Audit tab then displays this information.
Provisioning Tab
Events displayed in the Provisioning tab are events triggered during the configuration of a device. Cisco ANA sends an event explaining the configuration operation, such as configuring the cross-connect table in a device. The Provisioning tab displays detailed information specific to this event category. It contains events from both Cisco ANA Command Builder and Cisco ANA Workflow Editor1 .
Additional information specific to this event category can be viewed in the Event Properties window.
If a provisioning event is the result of an activation script, the provisioning event can include an extremely long description. This description is displayed in the Event Properties window in the Details field. If the description exceeds the size of the Details field, Cisco ANA truncates the description in the database and Details field, and displays the following line to indicate that the description has been truncated:
=====CONTENT TRUNCATED BY CISCO ANA=====
For more information about activation scripts, see the Cisco Active Network Abstraction 3.7.1 Integration Developer Guide.
Table 8-4 describes the information that is displayed in the Provisioning tab.
Table 8-4 Provisioning Tab
Severity
Icon of a bell, colored according to the severity of the alarm on the event (the color and type of alarm are displayed in the Properties window Severity field). See Event Status Indicators, page 7-4.
Event ID
Sequential ID number of the event.
Time
Date and time when the event happened and was logged and recorded.
Description
Description of the event, such as "Script Show has failed."
Location
Entity that triggered the event.
Username
Name of the user who performed the provisioning operations.
Status
Status, such as Success or Fail.
Security Tab
The Security tab displays detailed information specific to this event category. Security events are related to client login and user activity when managing the system and the environment. Additional information specific to this event category can be viewed in the Event Properties window.
Table 8-5 describes the information that is displayed in the Security tab.
Table 8-5 Security Tab
Severity
Icon of a bell, colored according to the severity of the alarm on the event (the color and type of alarm are displayed in the Properties window Severity field). See Event Status Indicators, page 7-4.
Event ID
Sequentially assigned identifier of the event.
Time
Date and time when the event happened and was logged and recorded.
Description
Description of the event, such as "Successful login root."
Location
Entity that triggered the event.
Username
Name of the user who triggered the event.
Originating IP
IP address of the client where the event was triggered.
For more information about the system security events displayed in this tab, see the Cisco Active Network Abstraction 3.7.1 Reference Guide.
System Tab
The System tab displays all the system events related to the everyday working of the internal system and its components. These events can be related to Cisco ANA and Cisco ANA gateway resources, representing the system log. Additional information specific to this event category can be viewed in the Event Properties window.
Table 8-6 describes the information that is displayed in the System tab.
Table 8-6 System Tab
Severity
Icon of a bell, colored according to the severity of the alarm on the event (the color and type of alarm are displayed in the Properties window Severity field). See Event Status Indicators, page 7-4.
Event ID
Sequential ID number of the event.
Time
Date and time when the event happened and was logged and recorded.
Description
Description of the event, such as "Dropped Events Report."
Location
Entity that triggered the event.
For more information about the system error and event messages displayed in this tab, see the Cisco Active Network Abstraction 3.7.1 Reference Guide.
Network Event Tabs
The following topics describe the information displayed in Cisco ANA EventVision for network events:
Service Tab
The Service tab displays all the events generated by Cisco ANA, such as Link Down. Service events are related to the alarms that are generated by the Cisco ANA system. Additional information specific to this event category can be viewed in the Event Properties window.
Table 8-7 describes the information that is displayed in the Service tab.
Table 8-7 Service Tab
Severity
Icon of a bell, colored according to the severity of the alarm on the event (the color and type of alarm are displayed in the Properties window Severity field). See Event Status Indicators, page 7-4.
Event ID
Calculated correlation identifier.
Time
Date and time when the event happened and was logged and recorded.
Description
Description of the event, such as "BGP neighbor found."
Location
Hyperlink to the entity that triggered the event.
Alarm ID
Hyperlinked identifier of the alarm associated with the event. Click the link to view the Ticket Properties window.
Ticket ID
Hyperlinked identifier of the ticket associated with the event. Click the link to view the Ticket Properties window.
Causing Event ID
Identifier of the causing event.
Duplication Count
For network events, the duplication count is calculated by the VNE and pertains only to flapping events. The duplication count represents the number of noncleared events aggregated by the flapping event.
Reduction Count
For network events, the reduction count is calculated by the VNE and pertains only to flapping events. The reduction count represents the number of events that are aggregated by the flapping event.
For more information about the service alarms that are displayed in this tab, see the Cisco Active Network Abstraction 3.7.1 Reference Guide.
Syslog Tab
The Syslog tab displays all the syslog events. These events are related to the predefined set of syslogs received from the devices by the VNEs, which are used to generate the syslog events. Additional information specific to this event category can be viewed in the Event Properties window.
Table 8-8 describes the information that is displayed in the Syslog tab.
Table 8-8 Syslog Tab
Severity
Icon of a bell, colored according to the severity of the alarm on the event (the color and type of alarm are displayed in the Properties window Severity field). See Event Status Indicators, page 7-4.
Event ID
Calculated correlation identifier.
Time
Date and time when the event happened and was logged and recorded.
Description
Description of the event, such as "Device configuration changed."
Location
Entity that triggered the event.
Alarm ID
Identifier of the alarm associated with the event.
Ticket ID
Identifier of the ticket associated with the event.
Causing Event ID
Identifier of the causing event.
Duplication Count
For network events, the duplication count is calculated by the VNE and pertains only to flapping events. The duplication count represents the number of noncleared events aggregated by the flapping event.
Reduction Count
For network events, the reduction count is calculated by the VNE and pertains only to flapping events. The reduction count represents the number of events that are aggregated by the flapping event.
Ticket Tab
The Ticket tab displays detailed information specific to tickets. A ticket contains a single root alarm (the root cause alarm can be of any alarm type, such as syslog or service), and all its subsequent correlated alarms. Additional information specific to tickets can be viewed in the Ticket Properties window.
A Tickets capacity overflow, red threshold reached system alarm is generated when the maximum number of tickets is exceeded. The alarm severity is defined as critical.
Table 8-9 describes the information that is displayed in the Ticket tab.
Table 8-9 Ticket Tab
Severity
Icon of a bell, colored according to the severity of the alarm on the ticket (the color and type of alarm are displayed in the Ticket Properties window Severity field). See Event Status Indicators, page 7-4.
Ticket ID
Sequentially assigned identifier of the ticket, hyperlinked to the Ticket Properties window.
Last Modification Time
Date and time when the ticket was last modified.
Description
Description of the event, such as "BGP neighbor found."
Location
Hyperlink to the entity that triggered the event.
Acknowledged
Status of the ticket: Acknowledged or Not Acknowledged.
Event Count
Number of events associated with the ticket.
Affected Devices Count
Number of devices affected by the ticket (the sources of the alarm and their subsequent alarms).
Duplication Count
For tickets, the duplication count is the sum of the duplication counts of all events that are associated with the root alarm.
Reduction Count
Ticket reduction count is the sum of reduction counts of all the events that are associated to the ticket. The History tab in the Ticket Properties window displays one reduction count for each event listed. For more information, see Chapter 9, "Working with Tickets in Cisco ANA NetworkVision."
Alarm Count
Total number of alarms associated with the ticket, including the root alarm.
For information about viewing ticket properties, see Viewing Ticket Properties.
V1 Trap Tab
This event is triggered when the network element sends a trap message to Cisco ANA because of a network event, such as Link Down. The V1 Trap tab displays detailed information specific to this category. Additional information specific to each event category can be viewed in the Event Properties window.
Table 8-10 describes the information that is displayed in the V1 Trap tab.
Table 8-10 V1 Trap Tab
Severity
Icon of a bell, colored according to the severity of the alarm on the event (the color and type of alarm are displayed in the Properties window Severity field). See Event Status Indicators, page 7-4.
Event ID
Calculated correlation identifier.
Time
Date and time when the event happened and was logged and recorded.
Description
Description of the event, such as "Enterprise generic trap."
Location
Hyperlink to the entity that triggered the trap.
Alarm ID
Identifier of the alarm associated with the event, hyperlinked to the Alarm Properties window.
Ticket ID
Hyperlinked sequential identifier of the ticket. Click the link to view the Ticket Properties window.
Causing Event ID
Identifier of the causing event, hyperlinked to the Network Event Properties window.
Duplication Count
For network events, the duplication count is calculated by the VNE and pertains only to flapping events. The duplication count represents the number of noncleared events aggregated by the flapping event.
Reduction Count
For network events, the reduction count is calculated by the VNE and pertains only to flapping events. The reduction count represents the number of events that are aggregated by the flapping event.
For more information about the Cisco IOS and Cisco IOX traps displayed in one of these tabs, see the Cisco Active Network Abstraction 3.7.1 Reference Guide.
V2 Trap Tab
This event is triggered when the network element sends a trap message to Cisco ANA because of a network event. The V2 Trap tab displays detailed information specific to this category. Additional information specific to each event category can be viewed in the Event Properties window.
Table 8-10 describes the information that is displayed in the V2 Trap tab.
Table 8-11 V2 Trap Tab
Severity
Icon of a bell, colored according to the severity of the alarm on the event (the color and type of alarm are displayed in the Properties window Severity field). See Event Status Indicators, page 7-4.
Event ID
Calculated correlation identifier.
Time
Date and time when the event happened and was logged and recorded.
Description
Description of the event, such as "Enterprise generic trap."
Location
Hyperlink to the entity that triggered the trap.
Alarm ID
Identifier of the alarm associated with the event, hyperlinked to the Alarm Properties window.
Ticket ID
Sequential identifier of the ticket, hyperlinked to the Ticket Properties window.
Causing Event ID
Identifier of the causing event, hyperlinked to the Network Event Properties window.
Duplication Count
For network events, the duplication count is calculated by the VNE and pertains only to flapping events. The duplication count represents the number of noncleared events aggregated by the flapping event.
Reduction Count
For network events, the reduction count is calculated by the VNE and pertains only to flapping events. The reduction count represents the number of events that are aggregated by the flapping event.
Translated Enterprise
Translation of the OID using the MIB. For example, an enterprise OID of .1.3.6.1.2.1.88.2 is displayed in this column as .iso.org.dod.internet.mgmt.mib-2.dismanEventMIB.dismanEventMIBNotificationPrefix.
Trap Type OID
Trap object identifier.
Enterprise
Enterprise OID for the trap, representing the company or organization that is associated with the trap.
For more information about the Cisco IOS and Cisco IOX traps displayed in this tab, see the Cisco Active Network Abstraction 3.7.1 Reference Guide.
V3 Trap Tab
This event is triggered when the network element sends a trap message to Cisco ANA because of a network event. The V3 Trap tab displays detailed information specific to this category. Additional information specific to each event category can be viewed in the Event Properties window.
Table 8-12 describes the information that is displayed in the V3 Trap tab.
Table 8-12 V3 Trap Tab
Severity
Icon of a bell, colored according to the severity of the alarm on the event (the color and type of alarm are displayed in the Properties window Severity field). See Event Status Indicators, page 7-4.
Event ID
Calculated correlation identifier.
Time
Date and time when the event happened and was logged and recorded.
Description
Description of the event, such as "Enterprise generic trap."
Location
Hyperlink to the entity that triggered the trap.
Alarm ID
Identifier of the alarm associated with the event, hyperlinked to the Alarm Properties window.
Ticket ID
Sequential identifier of the ticket, hyperlinked to the Ticket Properties window.
Causing Event ID
Identifier of the causing event, hyperlinked to the Network Event Properties window.
Duplication Count
For network events, the duplication count is calculated by the VNE and pertains only to flapping events. The duplication count represents the number of noncleared events aggregated by the flapping event.
Reduction Count
For network events, the reduction count is calculated by the VNE and pertains only to flapping events. The reduction count represents the number of events that are aggregated by the flapping event.
Translated Enterprise
Translation of the OID using the MIB. For example, an enterprise OID of .1.3.6.1.2.1.88.2 is displayed in this column as .iso.org.dod.internet.mgmt.mib-2.dismanEventMIB.dismanEventMIBNotificationPrefix.
Trap Type OID
Trap object identifier.
Enterprise
Enterprise OID for the trap, representing the company or organization that is associated with the trap.
For more information about the Cisco IOS and Cisco IOX traps displayed in this tab, see the Cisco Active Network Abstraction 3.7.1 Reference Guide.
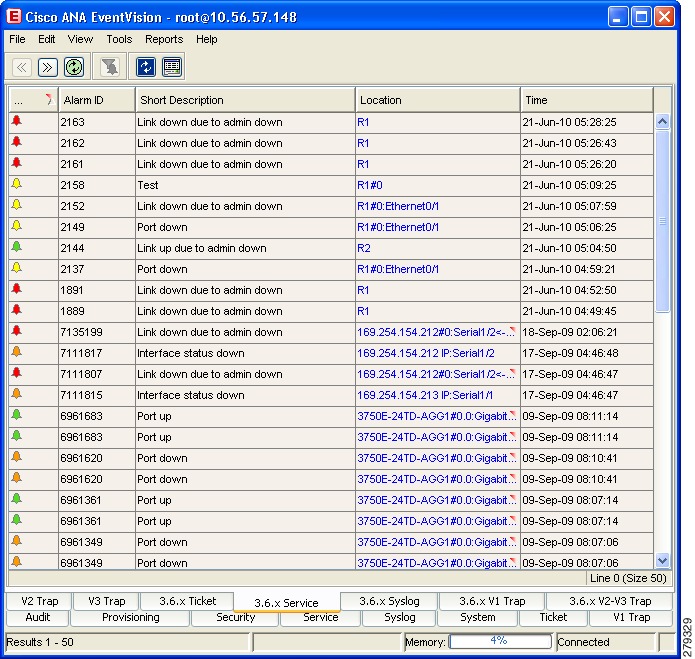
Viewing 3.6.x Tabs
If you upgrade to Cisco ANA 3.7 or 3.7.1 from version 3.6.7, you can view the following tabs by choosing File > Open 3.6.x Tabs:
•
•
•
•
•
Figure 8-2 shows an example Cisco ANA EventVision when the 3.6.x tabs are displayed.
Figure 8-2 Cisco ANA EventVision with 3.6.x Tabs
Table 8-13 describes the information that is displayed in each of the 3.6.x tabs.
Table 8-13 3.6.x Tab Contents in EventVision
Severity
Icon of a bell, colored according to the severity of the alarm on the ticket. For more information, see Event Status Indicators, page 7-4.
Ticket ID
Sequentially assigned identifier of the ticket.
Short Description
Description of the event.
Location
Hyperlink to the entity that triggered the event.
Last Modification Time
Date and time when the ticket was last modified.
Time
Date and time recorded when the first event happened.
Acknowledged
Status of the ticket: Acknowledged, Not Acknowledged, or Partly Acknowledged.
Affected Devices Count
Number of devices affected by the ticket (the sources of the alarm and their subsequent alarms).
Correlation Count
Number of correlated alarms included in the ticket.
Reduction Count
Ticket reduction count is the sum of reduction counts of all the events that are associated to the ticket. The History tab in the Ticket Properties window displays one reduction count for each event listed. For more information, see Chapter 9, "Working with Tickets in Cisco ANA NetworkVision."
Duplication Count
For tickets, the duplication count is the sum of the duplication counts of all events that are associated with the root alarm.
Severity
Icon of a bell, colored according to the severity of the alarm. For more information, see Event Status Indicators, page 7-4.
Alarm ID
Sequentially assigned identifier of the alarm.
Short Description
Description of the event.
Location
Hyperlink to the entity that triggered the event.
Time
Date and time recorded when the first event happened.
Suppress Display
Whether or not the display of the alarm is suppressed.
Working in Cisco ANA EventVision
The following sections describe how to view, filter, and display the properties of specific events and tickets, and how to refresh and export events:
•
Viewing Event Properties
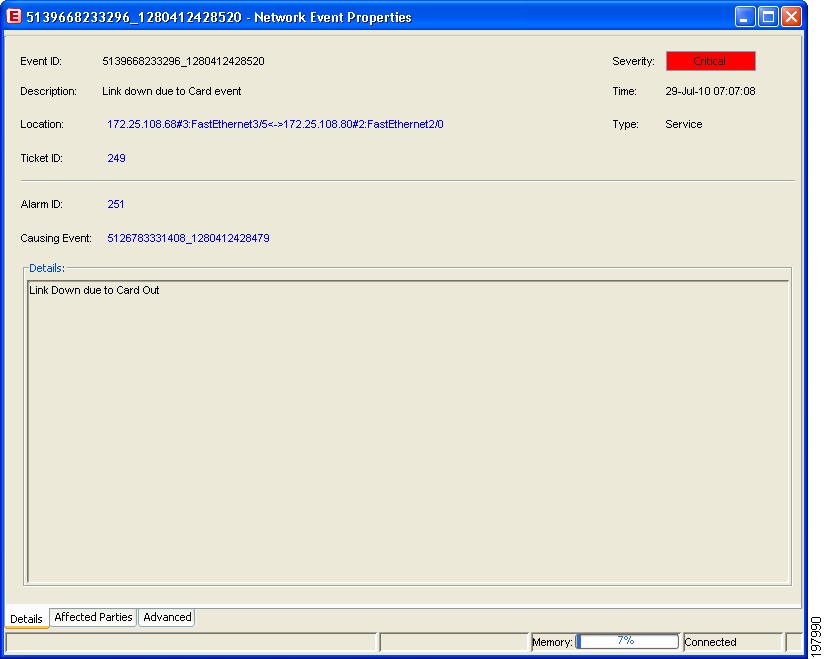
Cisco ANA EventVision enables you to view the properties of a specific event type. The Event Properties window displays detailed information about the event; for example, the severity and the number of affected parties.
Tip
To view event properties:
Step 1
Step 2
•
•
•
The Event Properties tabbed window is displayed for the selected event, as shown in Figure 8-3. The Details tab is displayed by default.
Figure 8-3 Event Properties Window - Details Tab
Table 8-14 describes the information that is displayed in the Event Properties window in the Details tab.
Step 3
Table 8-15 identifies the tabs that are available for each type of event and a link to the relevant information.
Audit Tab
Table 8-16 describes the information that is displayed in the Audit tab for audit-related events.
Provisioning Tab
Table 8-17 describes the information that is displayed in the Provisioning tab for provisioning-related events.
Table 8-17 Provisioning Tab
User Name
Name of the user who performed the provisioning operation.
Status
Status of the operation: Success or Fail.
Security Tab
Table 8-18 describes the information that is displayed in the Security tab for security-related events.
Trap Tab
Table 8-19 describes the information that is displayed in the Trap tab for trap-related events.
The properties of a selected ticket can be viewed in the Ticket Properties window. For a detailed description of the Ticket tab properties, see Viewing Ticket Properties, page 9-7.
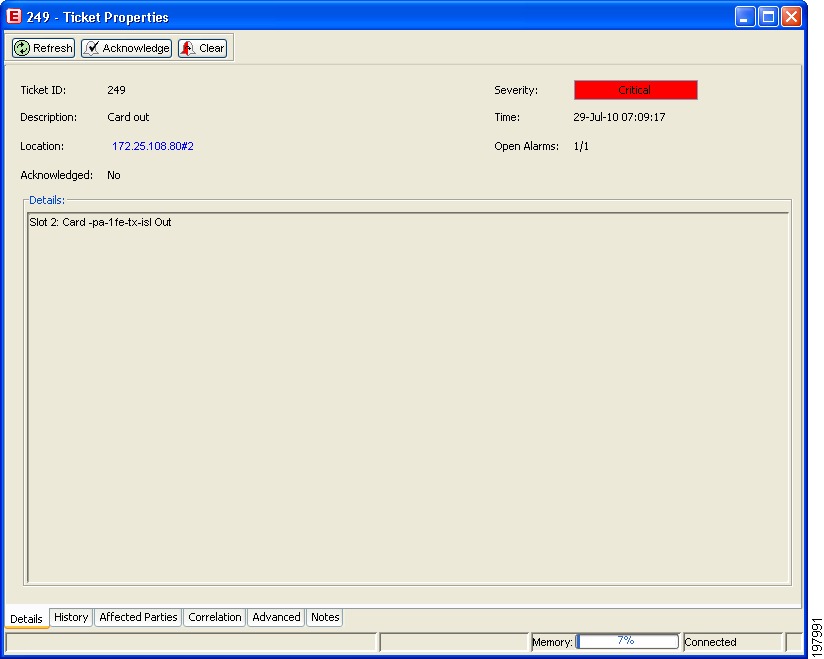
Viewing Ticket Properties
The properties of a selected ticket can be viewed in detail by displaying the Ticket Properties window.
To view ticket properties:
Step 1
Step 2
•
•
•
The Ticket Properties tabbed window is displayed for the selected ticket, as shown in Figure 8-4.
Figure 8-4 Ticket Properties Window - Details Tab
Table 8-20 describes the information that is displayed in the Details tab in the Ticket Properties window.
Step 3
Table 8-21 identifies the additional tabs that are displayed in the Ticket Properties window and links to the relevant information.
Table 8-21 Ticket Properties Window - Additional Tabs
History
Contains the history of the ticket, including all the events.
For more information, see History Tab, page 9-10.
Affected Parties
The services (affected pairs) that are potentially affected (potential impact analysis) by the ticket.
For more information, see Affected Parties Tab, page 9-11.
Correlation
Displays all the alarms that are correlated to the selected ticket.
For more information, see Correlation Tab, page 9-14.
Advanced
The number of affected devices, correlations, duplications, and reductions for the selected ticket. In addition, it provides any other additional information available about the ticket.
For more information, see Advanced Tab, page 9-15.
Notes
Enables you to add and save notes for the selected ticket.
The Notes tab is not available for tickets that have been archived.
For more information, see Notes Tab, page 9-15.
Refreshing Cisco ANA EventVision Information
Cisco ANA EventVision displays current information in lists in each tab. While you view a list, the information is not updated unless you manually refresh the list or activate autorefresh. The default autorefresh setting is 60 seconds and can be adjusted (see Selecting Cisco ANA EventVision Viewing Options, page 7-8). Your filter settings remain intact.
Table 8-22 shows the refresh icons.
To manually refresh a list, do one of the following:
•
•
To automatically refresh a list, click Auto Refresh in the toolbar.
Filtering Events and Tickets
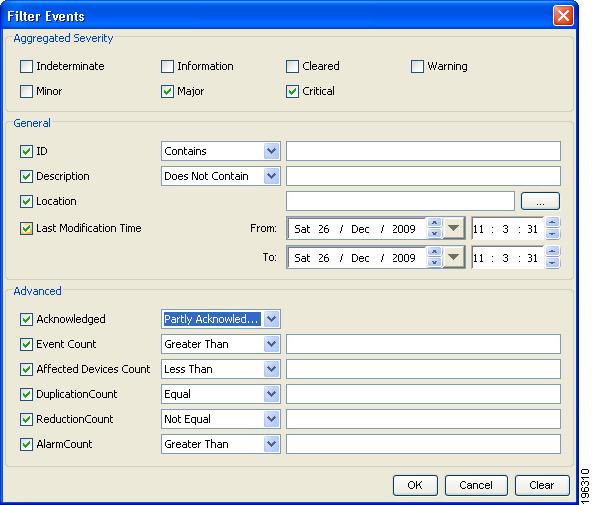
The Filter Events dialog box allows you to filter events and tickets according to severity, identifier, date and time, and text in the description field. You may also use the filter to search for information in the database.
The Filter icon toggles to indicate that a filter has been applied.
The following settings in the Cisco ANA EventVision Options dialog box also affect your filters:
•
•
For more information, see Selecting Cisco ANA EventVision Viewing Options, page 7-8.
See the following topics for more information about filtering events and tickets:
Defining Filters
To define a filter:
Step 1
•
•
Figure 8-5 Cisco ANA EventVision Filter Events Dialog Box
Step 2
Step 3
Removing Filters
To remove a filter:
Step 1
Step 2
Step 3
Exporting Displayed Data
Cisco ANA EventVision enables you to export the currently displayed data from the Cisco ANA EventVision table according to the criteria defined in the Cisco ANA EventVision Options dialog box. You can then import and view at a later time.
To export a table to a file:
Step 1
Step 2
Step 3
Step 4
1 The Workflow Editor is based on LiquidBPM by Autonomy, Inc.