Feedback
Table Of Contents
Severity Values for Affected Parties
Impact Analysis (Affected Parties) Windows
Viewing a Detailed Report for the Affected Pair
Accumulating the Affected Parties in an Alarm
Accumulating the Affected Parties in the Correlation Tree
Updating Affected Severity over Time
Ticket Status in the Ticket Pane
Working with Tickets
These topics describe the impact analysis of faults, and how to manage tickets that represent fault scenarios of selected devices or network elements:
Note
For detailed information about alarms and event management, see Chapter 5, "Understanding Fault Management."
•
•
•
•
•
•
•
•
•
•
•
•
•
Cisco ANA NetworkVision enables you to view and acknowledge tickets using the ticket pane. For more information, see Ticket Pane, page 2-11.
Impact Analysis Options
Impact analysis is available in two modes:
•
Note
•
Note
Note
Impact Report Structure
The impact report contains a list of pairs of endpoints when the service between them has been affected.
Each endpoint has the following details:
•
•
Note
Severity Values for Affected Parties
In automatic mode, the affected parties can be marked with one of the following severities:
•
•
•
The initial impact report might mark the services as either potentially or real affected. As time progresses and more information is accumulated from the network, the system might issue additional reports to indicate which of the potentially affected parties are real or recovered.
The indications for these states are available both through the API and in the GUI.
Note
Note
Impact Analysis (Affected Parties) Windows
The Impact Analysis windows are available in Cisco ANA NetworkVision and display the list of affected service resources that are embedded in the ticket information. This section describes this list.
Affected Parties Tab
The Affected Parties tab displays the service resources (pairs) that are affected by an event, an alarm, or a ticket depending on which properties window is opened. In the case of an alarm or a ticket, Cisco ANA NetworkVision automatically calculates the accumulation of affected parties of all the subsequent events. For more information about accumulating affected parties, see Viewing a Detailed Report for the Affected Pair.
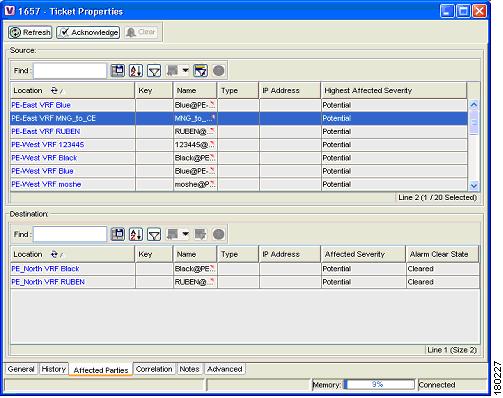
The Affected Parties tab is displayed in Figure 15-1.
Figure 15-1 Affected Parties Tab
The Affected Parties tab is divided into two areas, Source and Destination. The Source area displays the set of affected elements, A side and Z side. The following columns are displayed in the Affected Parties tab and provide information about the affected parties:
•
•
•
•
•
•
–
–
–
–
When an affected side (a row) is selected in the Source area, the list of all the endpoints where the services between them and the selected endpoint have been affected is displayed in the Destination area. For example, in Figure 15-1 when the PE-East row is selected in the Source area, there are two pairs:
•
•
The following columns are displayed in the Destination area table in the Ticket Properties window:
•
•
–
–
In addition, for every affected pair, you can view a detailed report that includes a list of the events that contributed to this affected pair.
Viewing a Detailed Report for the Affected Pair
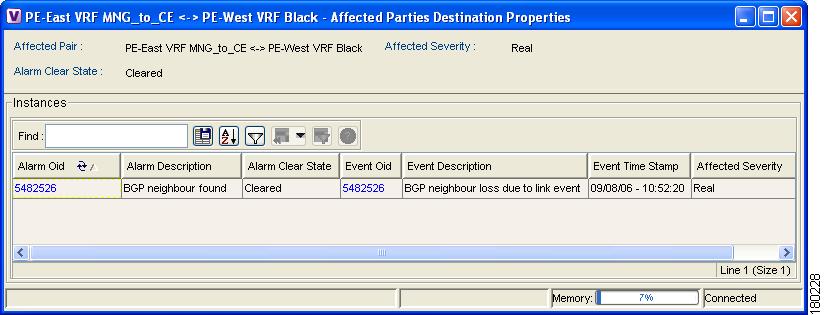
You can view a detailed report for every affected pair in Cisco ANA NetworkVision. The detailed report includes a list of the events that contributed to the affected pair.
The Affected Parties Destination Properties dialog box is displayed.
Figure 15-2 Detailed Report for the Affected Pair
The following fields are displayed at the top of the Affected Parties Destination Properties dialog box:
•
•
–
–
•
•
Each row in the Instances table represents an event that was reported for the affected pair. The following columns are displayed in the Instances table of the Affected Parties Destination Properties dialog box:
•
•
•
•
•
•
•
Disabling Impact Analysis
You can disable impact analysis for a specific alarm. This option can be set in the Cisco ANA Registry. If impact analysis is disabled the system will report the event with no impact information. The settings can be changed dynamically during system runtime.
Impact analysis for the following alarms can be disabled:
•
•
•
•
•
•
•
Accumulating Affected Parties
This section describes how Cisco ANA NetworkVision automatically calculates the accumulation of affected parties during automatic impact analysis. This information is embedded in the ticket along with all the correlated faults.
In the following example, these alarm types exist in the correlation tree:
•
•
•
An event sequence is correlated to each of these alarms.
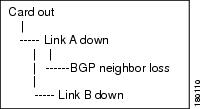
Figure 15-3 Correlation Tree Example
Cisco ANA NetworkVision provides a report of the affected parties for each type of alarm. This report includes the accumulation of:
•
•
Each report includes the accumulation of the affected report of all the events in its own correlation tree.
For example, in Figure 15-3:
•
•
Accumulating the Affected Parties in an Alarm
When there are two events that form part of the same event sequence in a specific alarm, the recurring affected pairs are only displayed once in the Affected Parties tab. Where there are different affected severities reported for the same pair, the pair is marked with the severity that was reported by the latest event, according to the time stamp.
Accumulating the Affected Parties in the Correlation Tree
Where there are two or more alarms that are part of the same correlation tree, that report on the same affected pair of edgepoints, and have different affected severities, then the recurring affected pairs are displayed only once in the Affected Parties tab. Where there are different affected severities reported for the same pair, the pair is marked with the highest severity.
In this example, X and Y are the OIDs of edgepoints in the network and there is a service running between them. Both of the alarms, link B down and BGP neighbor loss, report on the pair X < > Y as affected:
•
•
The affected severity priorities are:
•
•
•
Card out reports on X < > Y as real, affected only once.
Updating Affected Severity over Time
Cisco ANA can update the affected severity of the same alarm report over time because in some cases, the effect of the fault on the network cannot be determined until the network has converged.
For example, a link-down alarm creates a series of affected severity updates over time. These updates are added to the previous updates in the system database. In this case, the system provides the following reports:
•
•
•
•
This functionality is currently only available in the link-down scenario in MPLS networks.
Filtering Tickets by Device
Cisco ANA NetworkVision enables you to filter the tickets that are shown in the ticket pane so that only the tickets of a selected device or network element are displayed.
To filter tickets for a specific network element:
Step 1
Step 2
Note
The filter can be removed to display all the tickets in the system. For more information about removing a filter, see Filtering Tickets by Criteria.
Filtering Tickets by Criteria
Cisco ANA NetworkVision enables you to define a filter for the tickets displayed in the ticket pane according to various criteria; for example, tickets can be filtered according to the number of affected parties or acknowledged tickets.
To define the ticket filter:
Step 1
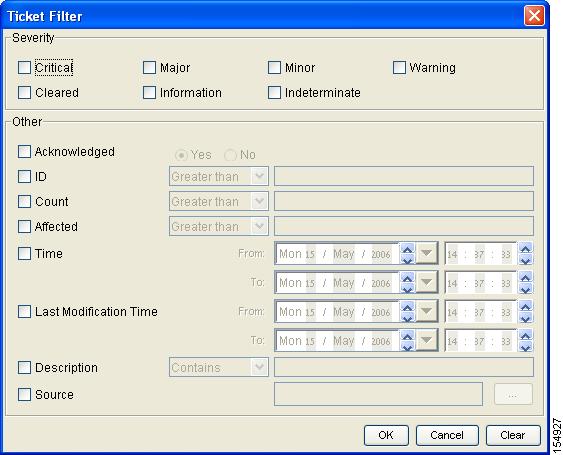
Figure 15-4 Ticket Filter Dialog Box
The Severity area in the Ticket Filter dialog box enables the user to filter the tickets displayed in the ticket pane by selecting one or more options. For more information about severities, see Network Element Status Indicators, page 2-13.
The check boxes displayed in the Other area reflect the columns displayed in the ticket pane and enable the user to filter the tickets according to any of these criteria. For more information about the columns displayed in the ticket pane, see Ticket Pane, page 2-11.
The Source check box (selected by default) enables the user to filter the tickets that are shown in the ticket pane so that only the tickets of a selected device or network element are displayed by selecting a source.
Step 2
Step 3
Note
To remove the ticket filter:
Step 1
Step 2
Step 3
Opening Ticket Properties
The properties of a selected ticket can be viewed by displaying the Ticket Properties dialog box. For example, you can view alarm severity, correlated alarms, active alarms, alarm history or the source of the alarm.
To open ticket properties, do one of the following:
•
•
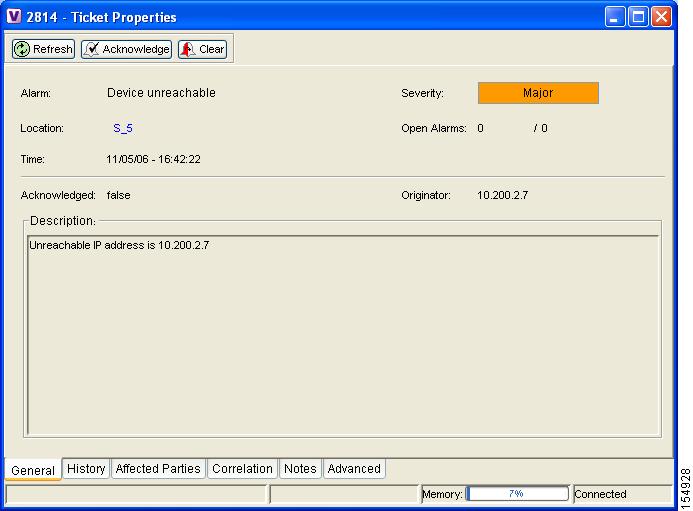
Figure 15-5 shows the Ticket Properties dialog box.
Figure 15-5 Ticket Properties Dialog Box
The information displayed in the Ticket Properties dialog box corresponds with the information displayed in the ticket pane. The ID number displayed in the header corresponds to the ID number of the ticket selected in the ticket pane.
The Ticket Properties dialog box is divided into the following areas:
Tabbed Pane
The Ticket Properties dialog box is divided into the following tabs:
•
•
•
•
•
•
General Tab
The following fields are displayed in the General tab and provide information about the compiled alarm:
•
•
•
•
•
•
•
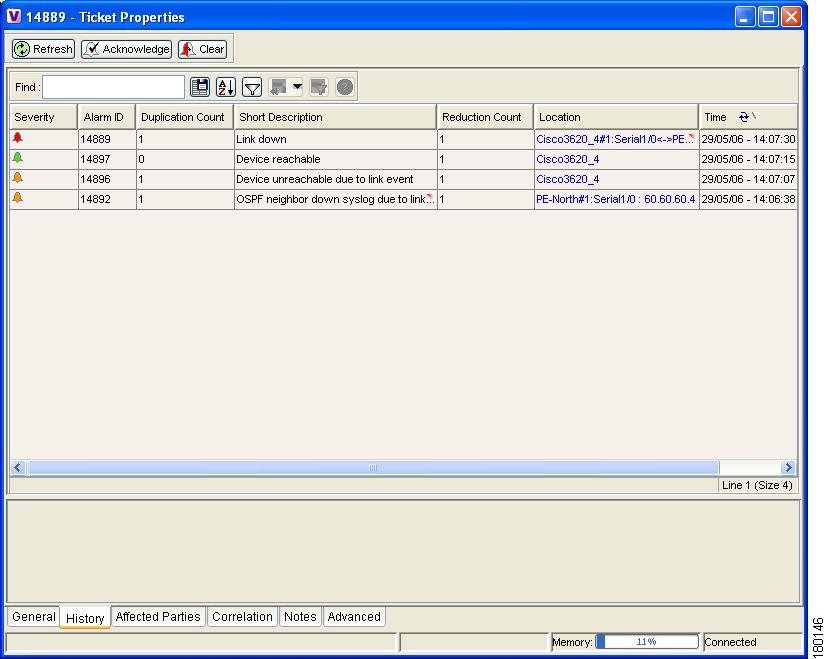
History Tab
The History tab enables you to display the history of the ticket, including all the events. Figure 15-6 shows the History tab.
Figure 15-6 History Tab
The following columns are displayed in the History tab and provide information about the compiled alarm:
•
•
•
•
•
•
•
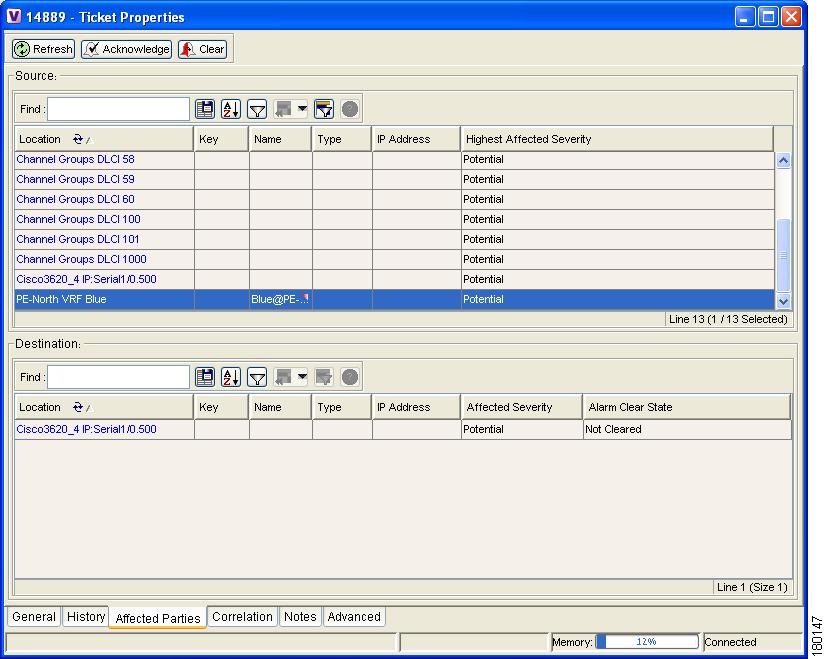
Affected Parties Tab
When a fault occurs, Cisco ANA automatically calculates the affected parties (automatic impact analysis), for example, when a link goes down, and embeds this information in the ticket along with all the correlated faults. You can view a list of all the endpoints that are affected. For more information about proactive impact analysis, see Impact Analysis Options.
The Affected Parties tab displays the service resources (affected pairs) that are affected (automatic impact analysis) by the ticket. For more information about accumulating affected parties, see Filtering Tickets by Device.
The Affected Parties tab is displayed.
Figure 15-7 Affected Parties Tab
The Affected Parties tab is divided into two areas: Source and Destination. The Source area displays the set of affected elements (A side and Z side). The following columns are displayed in the Affected Parties tab and provide information about the affected parties:
•
•
•
•
•
•
–
–
–
–
When an affected side (a row) is selected in the Source area, the selected element's related affected pairs are displayed in the Destination area.
The following additional columns are displayed in the Destination area table in the Ticket Properties window:
•
•
–
–
In addition, you can view a detailed report for every affected pair that includes a list of the events that contributed to this affected pair. For more information about viewing a detailed report, see Acknowledging a Ticket.
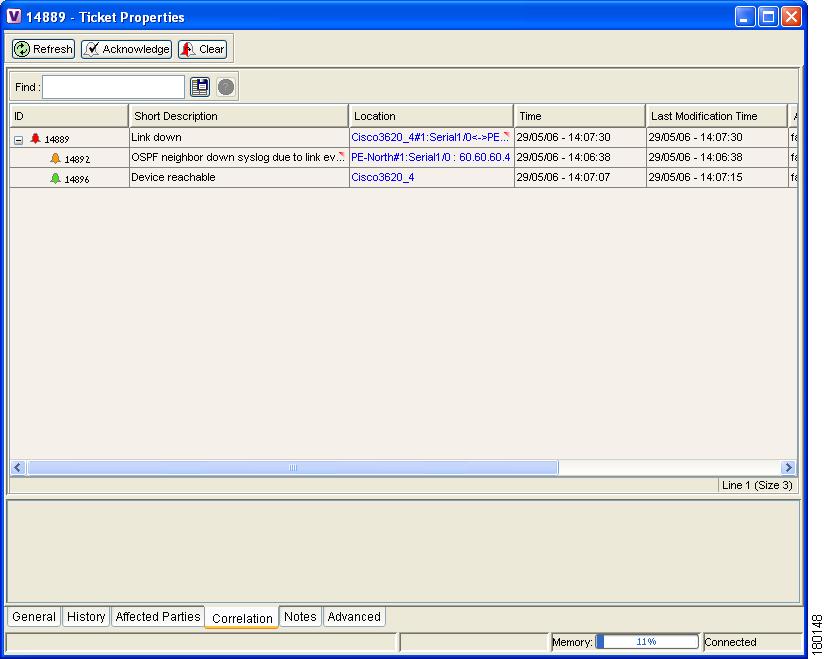
Correlation Tab
The Correlation tab displays all the alarms that are correlated to the selected ticket.
Figure 15-8 Correlation Tab
Each branch provides a short description of the alarm, a severity icon, ID, location, and time of the alarm. For more information about the columns displayed in the Correlation tab, see Ticket Pane, page 2-11.
The following columns are displayed in the Correlation tab and provide information about the alarm as follows:
•
•
•
•
•
•
•
The Find field on the toolbar enables you to search for information in the Correlated Alarms table.
Notes Tab
The Notes tab enables you to add and save notes for the selected ticket. To add text, enter text in the Notes field and click Save Notes. The new text is added to any previously existing text.
Note
•
Advanced Tab
The Advanced tab enables you to view all the affected devices, correlation, duplication and reduction counts for the selected ticket. In addition, it provides any other additional information available about the ticket.
The following fields are displayed in the Advanced tab and provide information about the compiled alarm:
•
•
•
•
•
•
•
Toolbar
The Ticket Properties dialog box contains the following tools:
Refreshes the information displayed in the Ticket Properties dialog box.
Acknowledges that the ticket is being handled. The status of the ticket is displayed as true in the ticket pane and in the Ticket Properties dialog box. For more information, see Acknowledged Ticket.
If a ticket was acknowledged, and some events were correlated to it afterward, then the ticket is considered to have not been acknowledged.
Note
Requests the relevant Cisco ANA to remove the faulty network element from the Cisco ANA networking inventory. In addition, it sets the ticket to Cleared severity or status (the icon is displayed in green) and automatically changes the acknowledged status of the ticket to true. For more information, see Cleared Ticket.
Note
Saves the notes for the selected ticket.
Note
Acknowledging a Ticket
When an alarm occurs, a warning or ticket is displayed in the ticket pane. Cisco ANA NetworkVision enables you to handle the status of a ticket by acknowledging it. This acknowledges the fault.
The change is reported to the Cisco ANA Gateway and all open Cisco ANA NetworkVision applications. Several tickets can be acknowledged at the same time. For more information, see Ticket Status in the Ticket Pane.
Note
An acknowledged ticket will change back to not acknowledged when a new event is correlated to it.
Note
To acknowledge a ticket, do one of the following:
•
•
For more information, see Ticket Status in the Ticket Pane.
Clearing a Ticket
When an alarm occurs, a warning or ticket is displayed in the ticket pane. Cisco ANA NetworkVision enables you to handle the reported ticket by verifying the report of what is faulty and clearing the faulty network element. The change is reported to the Cisco ANA Gateway and all open Cisco ANA NetworkVision applications. This operation cannot be reversed.
Note
Clearing an open ticket performs the following operations:
•
•
•
Note
To clear a ticket, do one of the following:
•
•
For more information, see Ticket Status in the Ticket Pane.
Removing a Ticket
When an alarm occurs, a warning or ticket is displayed in the ticket pane. Cisco ANA NetworkVision enables you to completely remove the ticket and all its active alarms and business tags. The change is reported to the Cisco ANA Gateway and all open Cisco ANA NetworkVision applications. In addition, several tickets can be removed at the same time. When a ticket has been cleared or when an `Up Alarm' occurs, then the ticket can be removed.
Note
Removing an alarm performs the following operations:
•
•
•
•
Note
To remove a ticket, right-click the ticket in the ticket pane and choose Remove.
For more information, see Ticket Status in the Ticket Pane.
In addition, an uncleared ticket (which has a severity higher than Cleared or Normal) can be cleared and removed by right-clicking in the ticket pane and choosing Clear and Remove. For more information about the Ticket shortcut menu, see Ticket Shortcut Menu, page 2-26.
Ticket Status in the Ticket Pane
The appearance of a ticket displayed in the ticket pane depends on the status or severity of the (ticket) alarm and what operations have been performed on the ticket. Tickets detailed in the ticket pane change when:
•
•
•
•
•
•
•
Generated Ticket
Table 15-1 shows an example of the appearance of the ticket pane when a ticket is generated.
Table 15-1 Generated Ticket
(Major)
27
Port down
False (Not Acknowledged)
Cleared Ticket
Table 15-2 shows an example of the appearance of the ticket pane when a ticket is cleared.
Table 15-2 Cleared Ticket
(Normal)
27
Cleared due to Force Clear
True (Acknowledged)
A ticket that has been cleared can then be removed from the ticket pane. For more information, see Removing a Ticket.
When a ticket is cleared, its definition automatically changes to acknowledged in the ticket pane and its definition in the Acknowledged column is True.
Acknowledged Ticket
Table 15-3 shows an example of the appearance of the ticket pane when a ticket is acknowledged. When a ticket is acknowledged it can then be cleared and the severity changes to Normal.
Table 15-3 Acknowledged Ticket
(Major)
27
Port up
True
Note
Generated Up Ticket
The cause of the alarm is fixed; therefore an Up ticket is automatically generated with a Normal severity. Table 15-4 shows an example of the appearance of the ticket pane when an Up ticket is generated.
Table 15-4 Generated Up Ticket
(Normal)
27
Port up
True
Clearing and Removing Tickets
Approves the reported faulty ticket and clears the faulty networking entity from Cisco ANA.