Feedback
Table Of Contents
Advanced Correlation Scenarios
Lab Setup for the Scenarios in These Topics
Device Unreachable Correlation Scenarios
Device Unreachable on Device Reload or Device Down Event
Description of Fault Scenario in the Network
Device Unreachable on Another Device Unreachable Event
Description of Fault Scenario in the Network
Device Unreachable on Link Down Event
Description of Fault Scenario in the Network
Multiroute Correlation Scenarios
Description of Fault Scenario in the Network
BGP Neighbor Loss Correlation Scenarios
BGP Neighbor Loss Due to Port Down
Description of Fault Scenario in the Network
Description of Fault Scenario in the Network
IP Interface Failure Scenarios
Correlation of Syslogs and Traps
Ethernet, Fast Ethernet, Gigabit Ethernet Examples
GRE Tunnel Down Correlation Example 1
GRE Tunnel Down Correlation Example 2
Advanced Correlation Scenarios
These topics describe the specific alarms which use advanced correlation logic on top of the root cause analysis flow:
•
Lab Setup for the Scenarios in These Topics—Describes the lab setup for the scenarios described in these topics.
•
•
•
•
•
•
Lab Setup for the Scenarios in These Topics
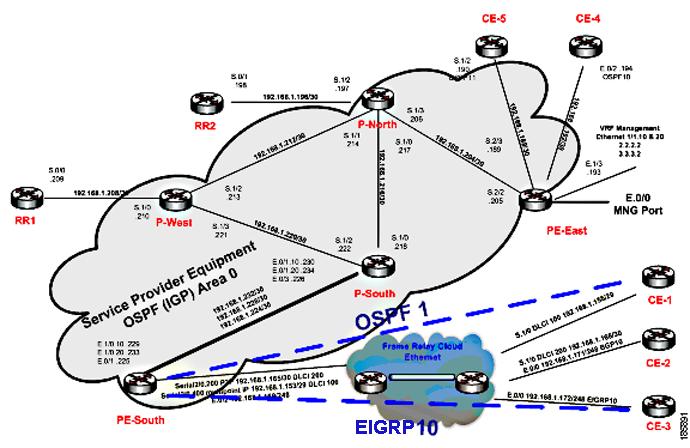
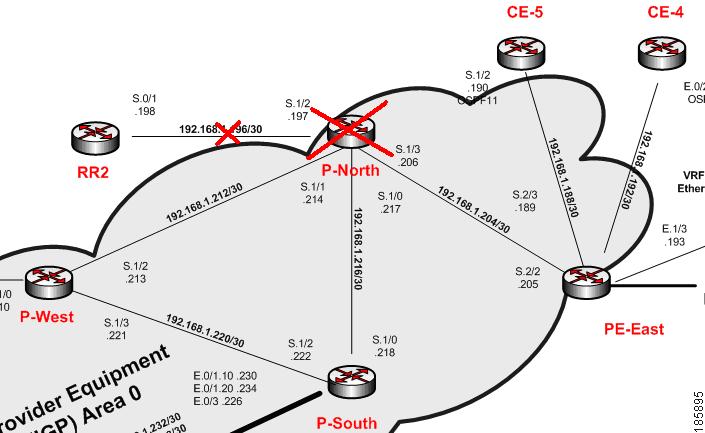
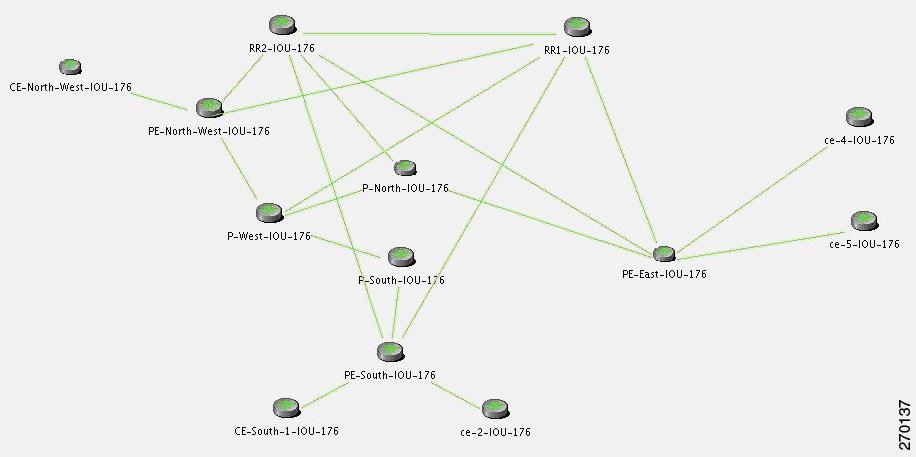
This section describe the lab's functionality and the applied technologies. The diagram illustrates the lab setup for the scenarios described in these topics.
Figure 6-1 Lab Setup
The lab simulates a network that is used by the service provider (SP). The core is based on MPLS technology and runs the OSPF routing protocol as Interior Gateway Protocol (IGP).
The P-network is topologically contiguous, whereas the C-network is delineated into a number of sites (contiguous parts of the customer network that are connected in some way other than through the VPN service). Note that a site does not need to be geographically contained.
The devices that link the customer sites to the P-network are called customer edge (CE) devices, whereas the service provider devices to which the CE routers connect are called provider edge (PE) devices. Where the provider manages an Ethernet access network, the CE devices will be connected to the PE devices, which are usually LAN switches with L3 capabilities.
The access network can be any L2 technology.
In this lab there are two L2 technologies in the access network:
•
•
The access network in the lab is unmanaged (a cloud).
In most cases, the P-network is made up of more than just the PE routers. These other devices are called P-devices (or, if the P-network is implemented with Layer 3 technology, P-routers). Similarly, the additional Layer 3 devices at the customer sites that have no direct connectivity to the P-network are called C-routers. In this example, C-routers are not part of the lab setup and are not managed by Cisco ANA.
The CE devices are located at the customer site and can be managed by the SP. All other devices (PEs, Ps, and RRs) are located at the SP site. These devices are maintained by the SP.
An end-to-end MPLS VPN solution is, like any other VPN solution, divided into the central P-network to which a large number of customer sites (sites in the C-network) are attached. The customer sites are attached to the PE devices (PE routers) through CE devices (CE routers). Each PE router contains several virtual routing and forwarding tables (VRFs), at least one per VPN customer. These tables are used together with multiprotocol BGP to run between the PE routers to exchange customer routes and to propagate customer datagrams across the MPLS network. The PE routers perform the label imposition (ingress PE router) and removal (egress PE router). The central devices in the MPLS network (P routers) perform simple label switching.
There are BGP processes running on the PE devices, and each PE is a neighbor to both RR devices. This way, the lab has a backup if one RR is down.
All the devices are managed inband. The management access point is Ethernet 0/0 on PE-East. To enable access to the CE devices, a loop was created between two ports on PE-East.
Device Unreachable Correlation Scenarios
Device reachability is measured by management protocol connectivity. Connectivity tests are used to verify the connection between VNEs and the managed network elements. The connectivity is tested per each protocol a VNE uses to poll a device. Cisco ANA-supported protocols for connectivity tests are SNMP, Telnet and ICMP.
The following topics describe the three scenarios in which device reachability issues occur:
•
•
•
For more information about device reachability, see Chapter 4, "Causality Correlation and Root Cause Analysis."
Device Unreachable on Device Reload or Device Down Event
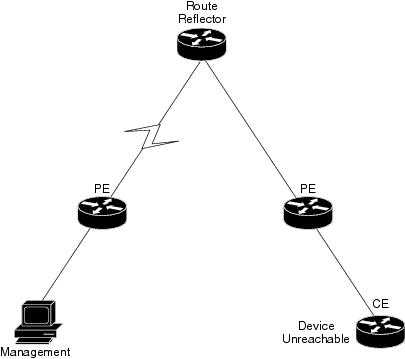
Figure 6-2 illustrates the lab setup for Device Unreachable on Device Down or Device Reload event.
Figure 6-2 Lab Setup for Device Unreachable on Device Down or Device Reload Event
Description of Fault Scenario in the Network
CE-5 goes down or is reloaded.
Related Faults
•
•
•
Note
Cisco ANA Failure Processing
Event Identification
The following service alarms are generated by the system:
•
The device unreachability event means that no other information can be collected from this device by the VNE.
•
The Link Down event is issued by the PE-East VNE (active) as a result of the link down negotiation process.
Possible Root Cause
1.
2.
•
Flow Path: CE-5 > PE-East > management subnet
•
Root Cause Selection
For the event [Device Unreachable, CE-5]:
•
Note
•
Note
For the event [Link Down on Unreachable, PE-East < > CE-5]:
•
•
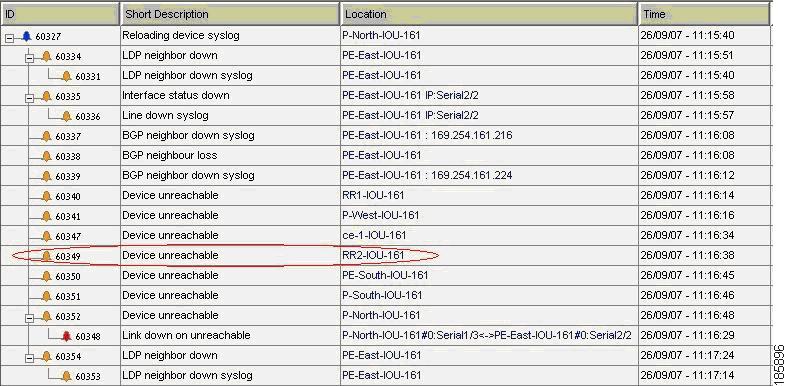
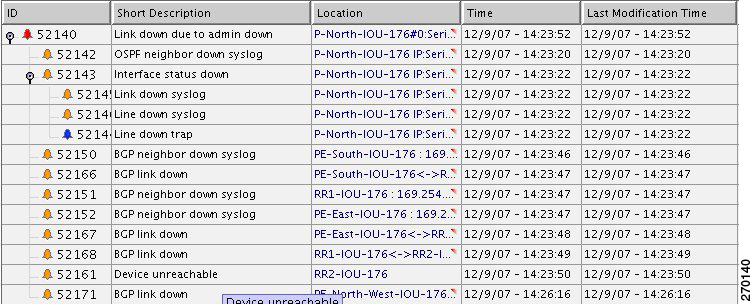
Figure 6-3 displays the events identified by the system in this scenario.
Figure 6-3 Device Unreachable on Device Down
Clearing Phase
When a down or reloaded device comes up again and starts responding to polling requests made by the corresponding VNE, the device is declared reachable, thus clearing the unreachable alarm. Other related alarms are cleared in turn after the corresponding VNEs verify that the malfunctions have recovered.
Variation
In a device reload scenario, the following additional events are identified by the system (in addition to the device down scenario):
•
•
For the event [Device Unreachable, CE-5]:
•
•
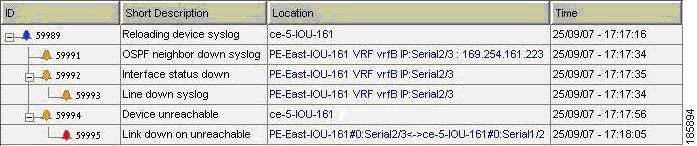
Figure 6-4 displays the events identified by the system in this scenario.
Figure 6-4 Device Unreachable on Device Reload
Device Unreachable on Another Device Unreachable Event
Figure 6-5 illustrates the lab setup for Device Unreachable on another Device Unreachable event.
Figure 6-5 Lab Setup for Device Unreachable on Another Device Unreachable Event
Description of Fault Scenario in the Network
P-North device is reloaded.
Related Faults
•
•
•
Cisco ANA Failure Processing
Note
Event Identification
The following service alarms are generated by the system:
•
The device unreachability event means that no other information can be collected from this device by the VNE.
•
Possible Root Cause
1.
2.
•
Flow Path: P-North > PE-East > management subnet
•
Flow Path: RR2 > P-North > PE-East > management subnet
Root Cause Selection
•
–
–
•
–
–
Figure 6-6 displays the events identified by the system in this scenario.
Figure 6-6 Device Unreachable on Other Device Unreachable
Clearing Phase
When a reloaded device comes up again (along with the L3 link that is vital for the RR2 management), the RR2 starts responding to polling requests from the RR2 VNE. The device is declared as reachable, thus clearing the Device Unreachable alarm.
Device Unreachable on Link Down Event
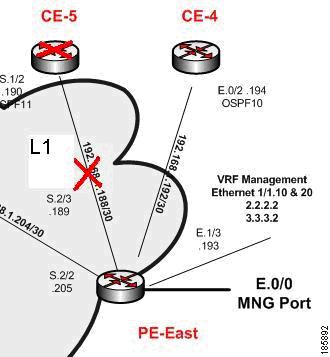
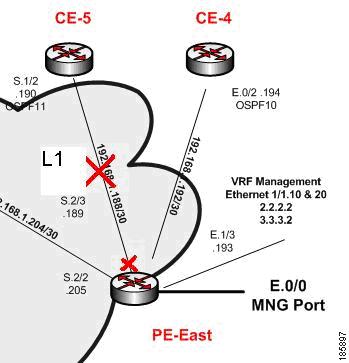
Figure 6-7 illustrates the lab setup for a Device Unreachable on a Link Down event.
Figure 6-7 Lab Setup for Device Unreachable on a Link Down Event
Description of Fault Scenario in the Network
The S.2/3 port of PE-East connected to the S.1/2 port of the CE-5 device (also called L1 link) is set to administrative status down. This effectively takes the L1 Link Down.
Related Faults
The CE-5 device is managed from this link with no backup. The L1 Link Down renders the CE-5 Device Unreachable from the management subnet.
Cisco ANA Failure Processing
Event Identification
The following service alarms are generated by the system:
•
The device unreachability event means that no other information can be collected from this device by the VNE.
•
The Link Down event is issued by the PE-East VNE (active) as a result of the Link Down negotiation process.
Noncorrelating Events
The noncorrelating event is:
[Link Down Due to Admin Down, PE-East < > CE-5]
This event opens a new ticket in the gateway.
The L1 Link Down event is configured to not correlate to other events at all. This is logical, because the edge VNEs identify the Link Down events as [Link Down Due to Admin Down] events. This implies that the VNEs know the root cause of the event already, based on the administrator's configurations. The [Link Down Due to Admin Down] events reach the northbound interface immediately after the links' new statuses are discovered by Cisco ANA and after the link down negotiation methods are completed.
Possible Root Cause
1.
2.
Flow Path: CE-5 > PE-East > management subnet
Root Cause Selection
For the event [Device Unreachable, CE-5]:
•
Note
•
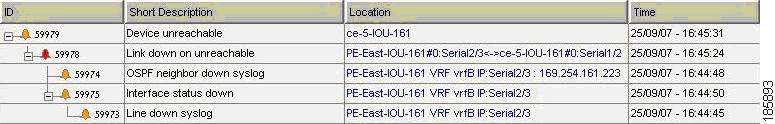
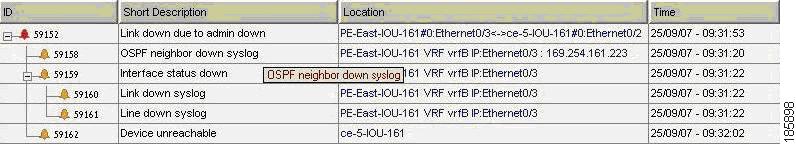
Figure 6-8 displays the events identified by the system in this scenario.
Figure 6-8 Device Unreachable on Link Down
Note
Clearing Phase
When the PE-East port S.2/3 (L1 link) comes up again, the CE-5 reachability from the management subnet comes back too. The CE-5 starts responding to polling requests from the CE-5 VNE. The device is declared reachable, thus clearing the Device Unreachable alarm. The L1 Link Down is cleared when the PE-East device indicates that the status of the connected port has changed to up again.
Multiroute Correlation Scenarios
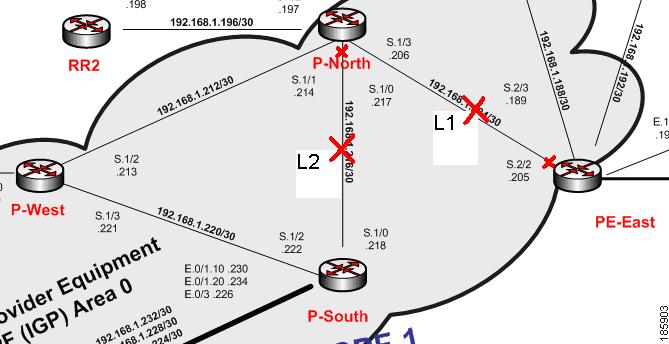
Figure 6-9 displays the lab multiroute configuration setup between P-South, P-North and P-West devices. The Open Shortest Path First (OSPF) cost is the same along the path from P-South and P-North whether or not it goes via P-West; that is, P-South and P-North connect along two paths with equal cost.
Figure 6-9 Lab Multiroute Configuration Setup Between P-South, P-North and P-West
Description of Fault Scenario in the Network
In this example, the P-North, P-South link (also known as L2) goes down in a multiroute segment between P-South and P-North. After approximately one minute another link, L1 (PE-East, P-North), goes down too. Both links go down administratively, the first from the P-North device and the latter from the PE-East devices' ports.
Related Faults
Almost all the devices are unreachable from the management subnet. This section focuses on CE-1 unreachability (see Figure 6-1).
Note
Cisco ANA Failure Processing
Event Identification
The following service alarms are generated by the system:
•
The device unreachability event means that no other information can be collected from this device by the VNE.
•
The Link Down event is issued by the PE-East VNE (active) as a result of the link down negotiation process.
•
The Link Down event is issued by the P-North VNE as a result of the link down negotiation process.
Noncorrelating Events
•
•
For more information, see Noncorrelating Events.
Possible Root Cause
1.
2.
Flow Path: CE-1 >Cloud > PE-South > P-South > P-North > PE-East > management subnet
Flow Path: CE-1 >Cloud > PE-South > P-South > P-West > P-North > PE-East > management subnet
Root Cause Selection
For the event [Device unreachable, CE-1]:
•
–
[Link Down Due to Admin Down, P-South > P-North].
Note
–
[Link down due to admin down, P-SouthS.1/0 > P-North S.1/0 < > PE-East S.2/2] and
[Link down due to admin down, P-NorthS.1/3 > PE-East S.2/2]•
Root Cause: Correlates to [Link Down Due to Admin Down, P-North S.1/0 < > PE-East S.2/2]
Note
Note
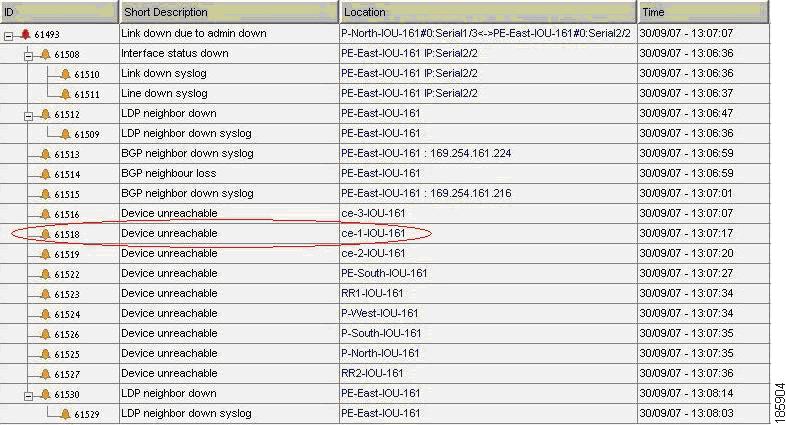
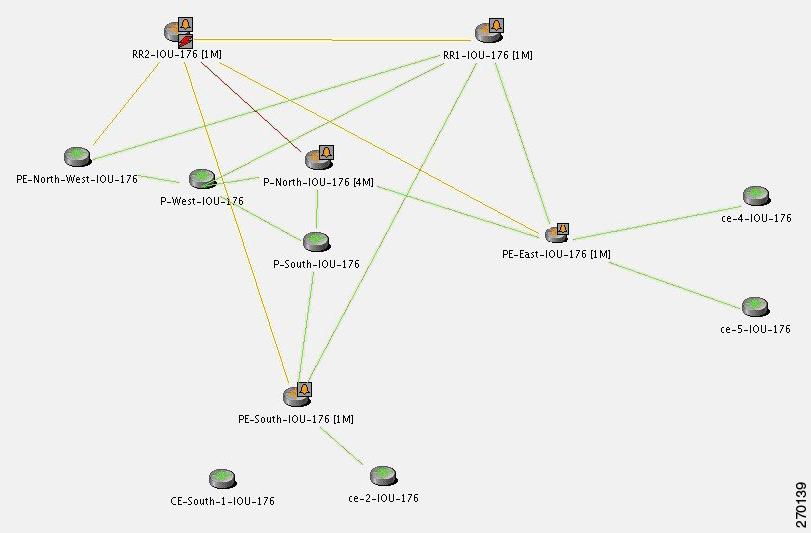
Figure 6-10 displays the events identified by the system in this scenario (L1).
Figure 6-10 Multiroute Scenario—L1
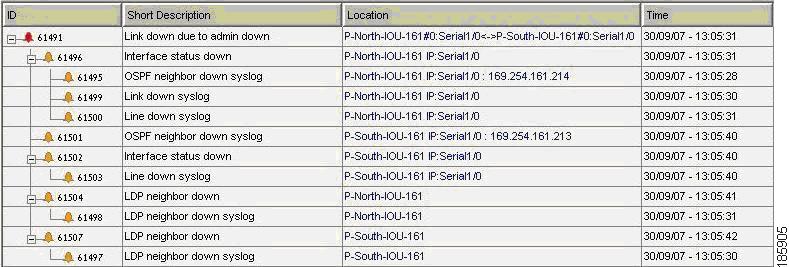
Figure 6-11 displays the events identified by the system in this scenario (L2).
Figure 6-11 Multiroute Scenario—L2
Clearing Phase
Enabling the L1 link makes the CE-1 device reachable from the management IP. This alone clears the Device Unreachable event of the CE-1 device. When the L1 link's new status is discovered by Cisco ANA, the PE-East device eventually initiates a Link Up event for this link. When the administrator enables the L2 link and Cisco ANA discovers this change, this Link Down event is cleared by its matching Link Up event.
BGP Neighbor Loss Correlation Scenarios
The VNE models the BGP connection between routers and actively monitors its state. BGP neighbor loss events are generated from both sides of the connection only in the case of a connectivity loss, and where the other side of the link is unmanaged.
The correlation engine identifies various faults that affect the BGP connection and reports them as the root cause for the BGP Neighbor Loss alarm; for example, Link Down, CPU Overutilized, and Link Data Loss.
Figure 6-12 Lab Setup for BGP Neighbor Loss Correlation Scenarios
Note
There are two main scenarios that might lead to a BGP neighbor loss event:
•
•
BGP Neighbor Loss Due to Port Down
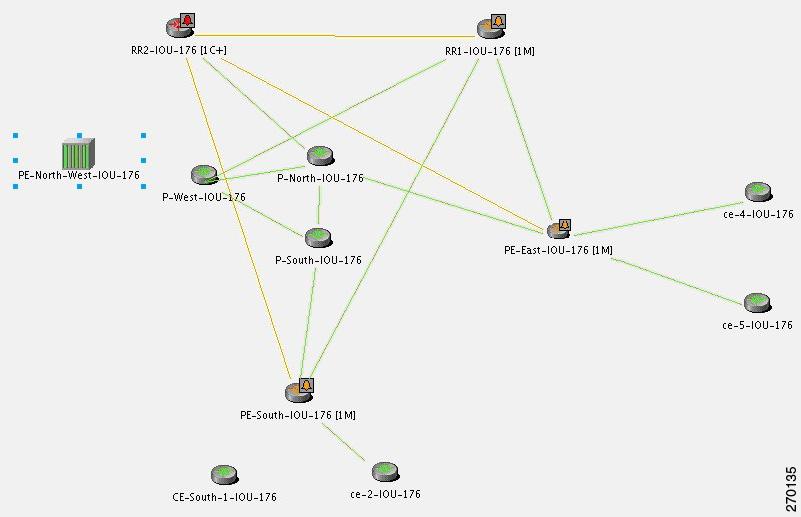
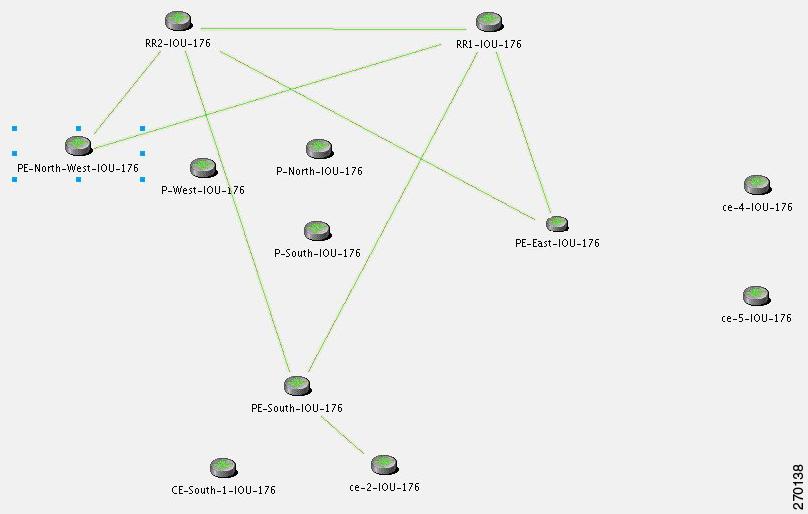
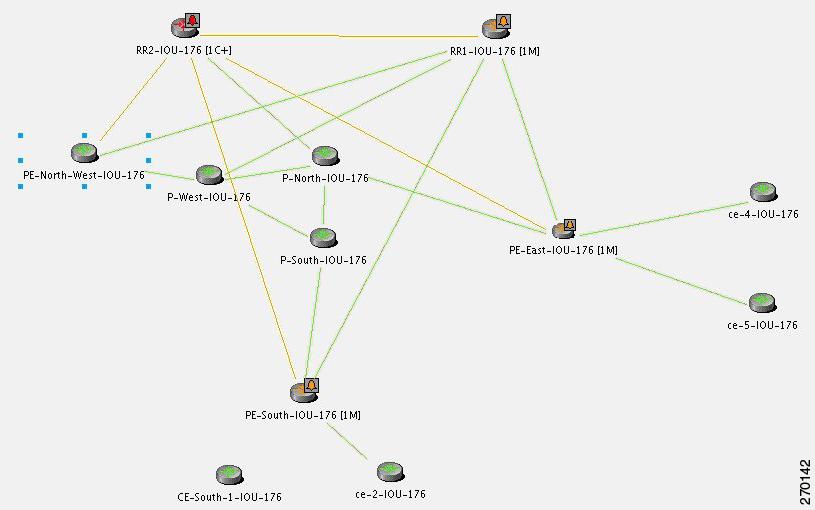
Figure 6-13 displays the BGP neighbor loss due to port down scenario.
Figure 6-13 BGP Neighbor Loss Due to Physical Port Down (P-West > PE-North-West)
Description of Fault Scenario in the Network
In Figure 6-13 the BGP neighbor loss occurs due to a physical port down (in P-West that connects to PE-North-West). The relevant devices are PE-North-West, RR2, P-North and P-West.
Related Faults
•
•
Note
Cisco ANA Failure Processing
Event Identification
The following service alarms are generated by the system:
•
Since the VNE that monitors each PE or RR holds records of the entire device's BGP information, the change in the BGP table is identified by the VNE and causes it to send this event.
Possible Root Cause
1.
2.
Flow Path: RR2 > P-North > P-West > P-West port is connected to PE-North-West (which is unmanaged), and is in a down state.
Root Cause Selection
For the event [BGP Neighbor Loss, RR2]:
•
•
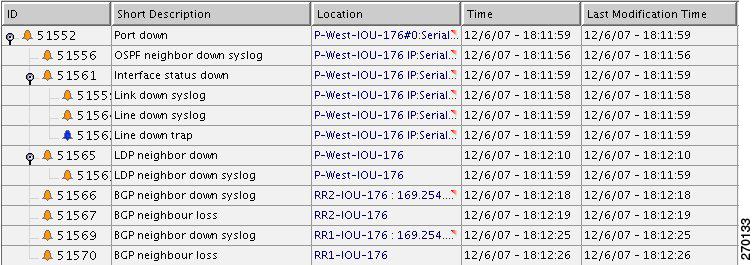
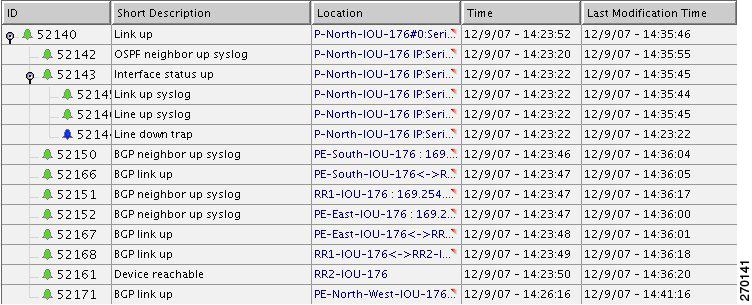
Figure 6-14 displays the events identified by the system in this scenario.
Figure 6-14 BGP Neighbor Loss Due to Physical Port Down
Clearing Phase
When a Port Up event is detected by the system for the same port that was detected as the root cause for the BGP Neighbor Loss event, the alarm is cleared. The ticket is cleared (colored green) when all the alarms in the ticket have been cleared.
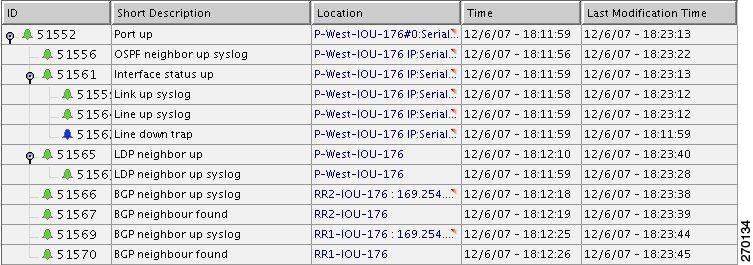
Figure 6-15 displays the up event that clears all the down events identified by the system.
Figure 6-15 BGP Neighbor Up Event that Clears All the Down Events
Variation
In a BGP process down scenario, the following additional events are identified by the system (in addition to the BGP Neighbor Loss event):
•
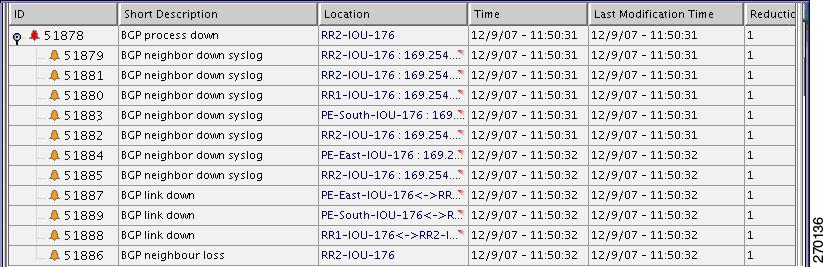
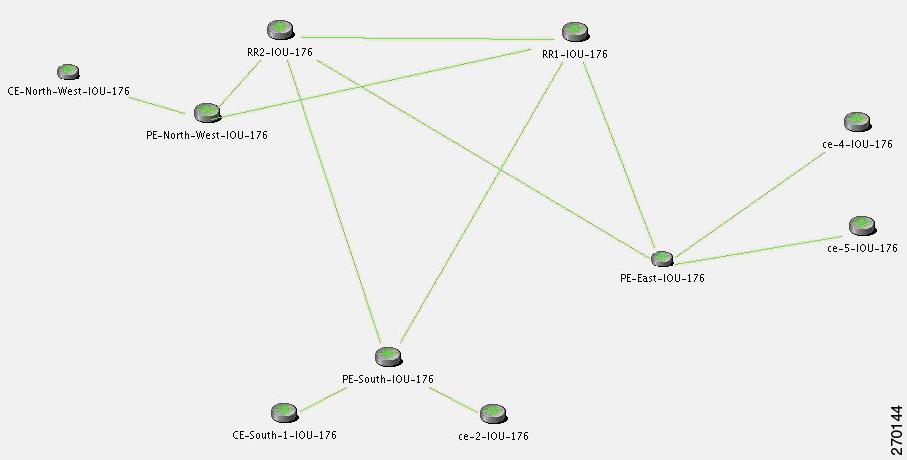
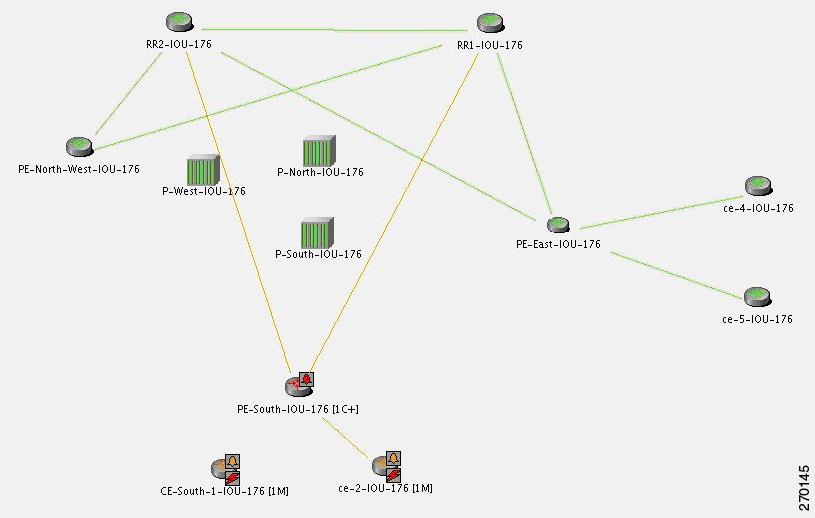
In Figure 6-16 the BGP Process Down event causes several events (the BGP Neighbor Loss event cannot be seen). The relevant devices are RR2 (BGP Process Down, marked in red), and PE-North-West (marked as unmanaged).
Figure 6-16 BGP Process Down Causes Several Events
For the event [BGP Neighbor Loss, RR2]:
•
•
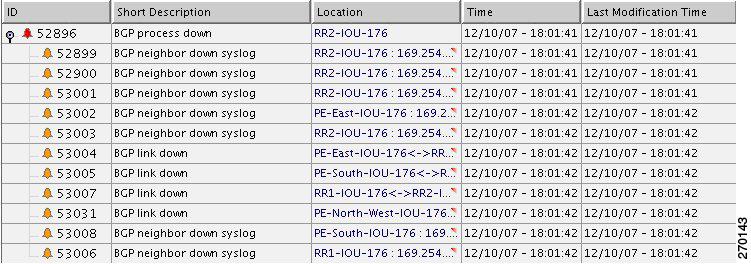
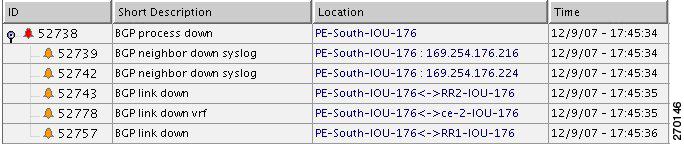
Figure 6-17 displays the events identified by the system in this scenario.
Figure 6-17 BGP Process Down Correlation
BGP Link Down Scenarios
Figure 6-18 illustrates the lab setup for the BGP Link Down scenarios described in this topic.
Figure 6-18 Lab Setup for BGP Link Down Scenarios
Figure 6-19 illustrates the lab setup for the scenarios with only the BGP links displayed.
Figure 6-19 Lab Setup for Scenarios With Only the BGP Links Displayed
The VNE models the BGP connection between routers and actively monitors its state. If the connectivity is lost and a link between the devices exists in the VNE, a BGP Link Down event is created. A BGP Link Down event is created only if both sides of the link are managed.
A BGP link might be disconnected in the following scenarios:
•
•
•
Description of Fault Scenario in the Network
Due to a physical link down, the BGP connection between PE-North-West and RR2 is lost.
Related Faults
•
•
•
Note
Figure 6-20 reflects the BGP Link Down due to physical link down scenario. The relevant devices are RR2, P-north, P-West and PE-North-West.
Figure 6-20 BGP Link Down Due to Physical Link Down
Cisco ANA Failure Processing
Event Identification
The following service alarms are generated by the system:
•
–
–
This causes an acceleration of the polling for the BGP neighbor data on the device.
Possible Root Cause
1.
2.
Flow Path: RR > P-North > PE-North-West
Flow Path: RR > PE-North-West > P-North > RR2
Root Cause Selection
For the event [BGP Link Down, RR2 < > PE-North-West]:
•
•
Figure 6-21 displays the events identified by the system in this scenario.
Figure 6-21 BGP Link Down Correlation to the Root Cause of Physical Link Down
Clearing Phase
A BGP Link Up event arrives when the root cause event is fixed so that the network is repaired. This clearing event is created after a clearing syslog arrives or after the next polling result reestablishes the BGP connection.
Figure 6-22 displays the up event that clears all the tickets identified by the system.
Figure 6-22 BGP Link Up Clears All the Tickets
Variation
In a managed network, the following additional events might be identified by the system (in addition to the BGP Link Down event):
•
•
BGP Process Down
Figure 6-23 displays the scenario where a BGP Process Down event causes BGP Link Down events.
Figure 6-23 BGP Process Down Causes BGP Link Down Events
For the event [BGP Link Down, RR2 < > PE-North-West]:
•
•
Figure 6-24 displays the events identified by the system in this scenario.
Figure 6-24 BGP Process Down Correlation
Device Unreachable
For the event [BGP Link Down, RR2 < > PE-North-West]:
•
•
In an unmanaged network core (as illustrated in Figure 6-25), the following additional events might be identified by the system (in addition to the BGP Link Down event):
•
•
Figure 6-25 Lab Setup With Unmanaged Network Core
BGP Process Down
Note
In Figure 6-26, BGP Process Down event on PE-South causes BGP Link Down events. The relevant devices are PE-South, RR1 and RR2.
Figure 6-26 BGP Process Down on PE-South Causes BGP Link Down Events
For the event [BGP Link Down, PE-South < > RR2] (see BGP Link Down, page 16-4):
•
[BGP Link Down, PE-South < > RR1].•
Figure 6-27 displays the events identified by the system in this scenario.
Figure 6-27 BGP Process Down Correlation
Device Unreachable
For the Device Unreachable event, one or more PEs report on BGP connectivity loss to a neighbor that is unreachable.
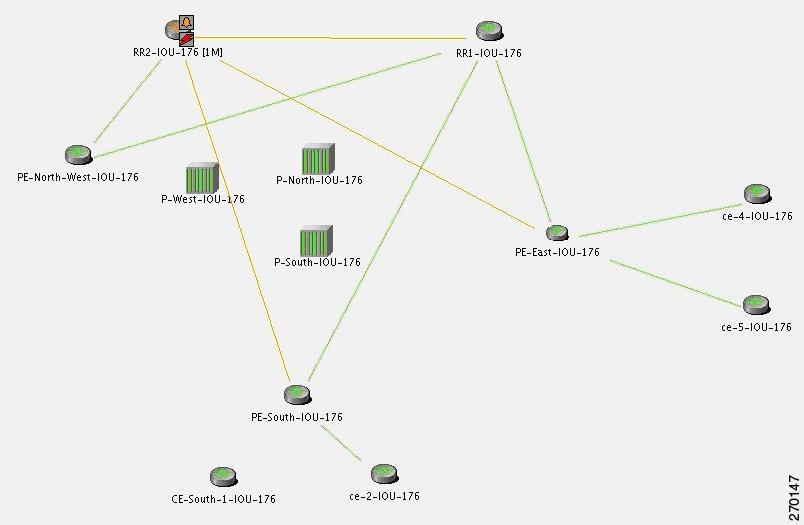
In Figure 6-28, the Device Unreachable on an unmanaged core causes multiple BGP Link Down events. The relevant devices are RR2 (Device Unreachable), RR1, PE-East, PE-South.
Figure 6-28 Device Unreachable on Unmanaged Core Causes Multiple BGP Link Down Events
For the event [BGP Link Down, RR2 < > PE-South] (see BGP Link Down, page 16-4):
•
•
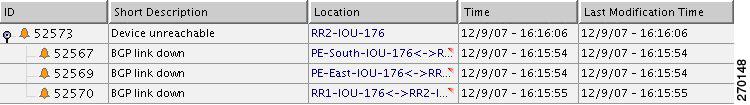
Figure 6-29 displays the events identified by the system in this scenario.
Figure 6-29 Device Unreachable on Unmanaged Core Correlation
For the event [Device Unreachable, RR2] (see Figure 6-30 and Component Unreachable, page 16-11):
•
•
Figure 6-30 Device Unreachable on CE
HSRP Scenarios
These topics describe scenarios that can generate HSRP alarms:
HSRP Alarms
When an active Hot Standby Router Protocol (HSRP) group's status changes, a service alarm is generated and a syslog is sent.
Table 6-1 HSRP Service Alarms
Primary HSRP interface is not active/Primary HSRP interface is active (see HSRP Group Status Changed, page 16-16)
Yes
No
Can be correlated to several other alarms, for example, link down
Major
Secondary HSRP interface is active/Secondary HSRP interface is not active (see HSRP Group Status Changed, page 16-16)
Yes
No
Can be correlated to several other alarms, for example, Link Down
Major
Note
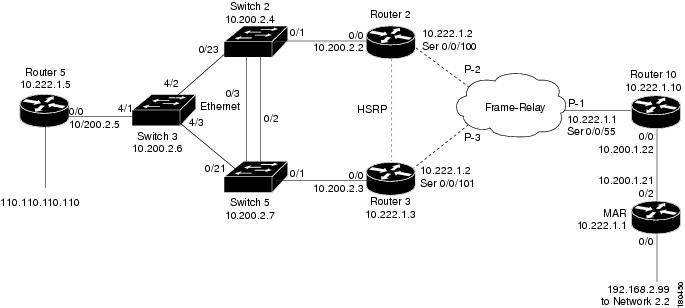
HSRP Example
In Figure 6-31, the link between Router 2 and Switch 2 is shut down, causing the HSRP standby group on Router 3 to become active, and a Link Down service alarm is generated. The primary HSRP group on Router 2 is not active anymore. A service alarm is generated and correlated to the Link Down alarm. Router 2 also sends a syslog which is correlated to the Link Down alarm.
The secondary HSRP group configured on Router 3 now changes from standby to active. This network event triggers an IP-based active flow with the destination being the virtual IP address configured in the HSRP group. When the flow reaches its destination, a service alarm is generated and correlated to the Link Down alarm. Router 3 also sends a syslog that is correlated to the Link Down alarm.
Figure 6-31 Example
In this case, the system provides the following report:
•
•
–
%HSRP-6-STATECHANGE: FastEthernet0/0 Grp 1 state Active -> Speak (source: Router 2)–
%STANDBY-6-STATECHANGE: Ethernet0/0 Group 1 state Standby -> Active (source: Router 3)IP Interface Failure Scenarios
These topics describe sample scenarios that can generate IP interface failures:
•
Interface Status Down Alarm
Alarms related to subinterfaces (for example, a Line Down trap or syslog) are reported on IP interfaces configured above the relevant subinterface. This means that in the system, subinterfaces are represented by the IP interfaces configured above them. All events sourcing from subinterfaces without a configured IP interface are reported on the underlying Layer 1.
An Interface Status Down alarm is generated when the status of the IP interfaces (whether over an interface or a subinterface) changes from up to down or any other nonoperational state (see Table 6-3). All events sourced from the subinterfaces correlate to this alarm. In addition, an All IP Interfaces Status Down alarm is generated when all the IP interfaces above a physical port change state to down. For more information, see Interface Status, page 16-17.
The alarm's description includes the full name of the IP interface, for example Serial0.2 (including the identifier for the subinterface if it is a subinterface) and the source of the alarm source points to the IP interface (and not to Layer 1).
All syslogs and traps indicating changes in subinterfaces (above which an IP is configured) correlate to the Interface Status Down alarm. The source of these events is the IP interface. Syslogs and traps that indicate problems in Layer1 (that do not have a subinterface qualifier in their description) are sourced to Layer1.
Note
For example:
•
•
For events that occur on subinterfaces:
•
•
•
If the main interface goes down, all related subinterfaces' traps and syslogs are correlated as child tickets to the main interface parent ticket.
The following technologies are supported:
•
•
•
•
•
Correlation of Syslogs and Traps
When receiving a trap or syslog for the subinterface level, immediate polling of the status of the relevant IP interface occurs and a polled parent event (such as Interface Status Down) is created. The trap or syslog is correlated to this alarm.
Where there is a multipoint setup and only some circuits under an IP interface go down, and this does not cause the state of the IP interface to change to down, then no Interface Status Down alarm is created. All the circuit down syslogs correlate by flow to the possible root cause, such as Device Unreachable on a Customer Edge (CE) device.
All IP Interfaces Down Alarm
•
•
•
Note
For more information, see Table 6-3 and All IP Interfaces Down, page 16-3.
The All IP Interfaces Down alarm is sourced to the Layer 1 component. All alarms from the other side (such as Device Unreachable) correlate to the All IP Interfaces Down alarm.
IP Interface Failure Examples
Note
If this is not the case, as in some Ethernet networks, and there is no change to the state of the IP interface, all the events on the subinterfaces that are capable of correlation flow will try to correlate to other possible root causes, including Cloud Problem.
Interface Example 1
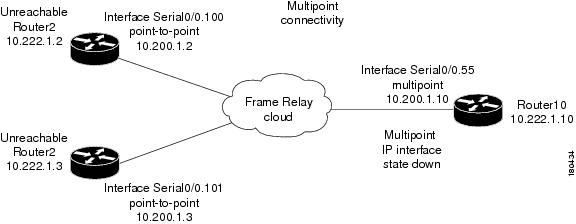
In Figure 6-32 there is multipoint connectivity between a PE and number of CEs through an unmanaged Frame Relay network. All the CEs (Router2 and Router3) have logical connectivity to the PE through a multipoint subinterface on the PE (Router10). The keepalive option is enabled for all circuits. A link is disconnected inside the unmanaged network, causing all the CEs to become unreachable.
Figure 6-32 Interface Example 1
The following failures are identified in the network:
•
•
The following correlation information is provided:
•
•
Interface Example 2
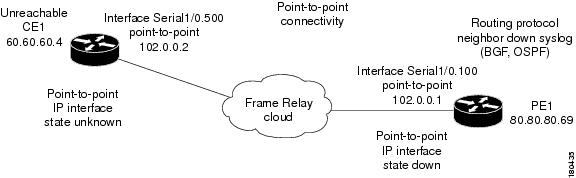
In Figure 6-33 there is point-to-point connectivity between a PE and a CE through an unmanaged Frame Relay network. CE1 became unreachable, and the status of the IP interface on the other side (on the PE1) changed state to down. The keepalive option is enabled. The interface is shut down between the unmanaged network and CE1.
Figure 6-33 Interface Example 2
The following failures are identified in the network:
•
•
The following correlation information is provided:
•
–
–
Interface Example 3
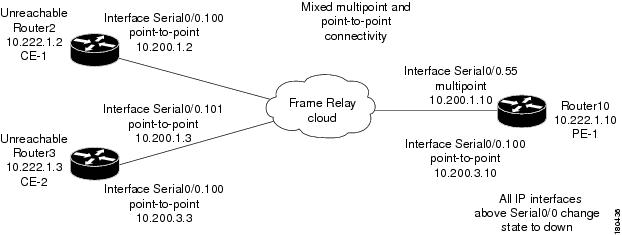
In Figure 6-34 there is a failure of multiple IP interfaces above the same physical port (mixed point-to-point and multipoint Frame Relay connectivity). CE1 (Router2) has a point-to-point connection to PE1 (Router10). CE1 and CE2 (Router3) have multipoint connections to PE1. The IP interfaces on PE1 that are connected to CE1 and CE2 are all configured above Serial0/0. The keepalive option is enabled. A link is disconnected inside the unmanaged network that has caused all the CEs to become unreachable.
Figure 6-34 Interface Example 3
The following failures are identified in the network:
•
•
The following correlation information is provided:
•
–
–
–
Interface Example 4
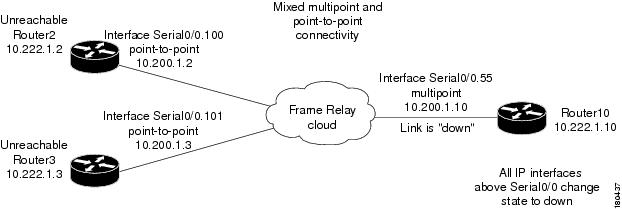
In Figure 6-35 there is a failure of multiple IP interfaces above the same physical port (mixed point-to-point and multipoint Frame Relay connectivity). CE1 (Router2) has a point-to-point connection to PE1 (Router10). CE1 and CE2 (Router3) have multipoint connections to PE1. The IP interfaces on PE1 that are connected to CE1 and CE2 are all configured above Serial0/0. The keepalive option is enabled.
A link is disconnected inside the unmanaged network that has caused all the CEs to become unreachable. In a situation where a Link Down occurs, whether it involves a cloud or not, the link failure is considered to be the most probable root cause for any other failures. In this example, a link is disconnected between the unmanaged network and the PE.
Figure 6-35 Interface Example 4
The following failures are identified in the network:
•
•
•
•
The following correlation information is provided:
•
•
•
•
Interface Example 5
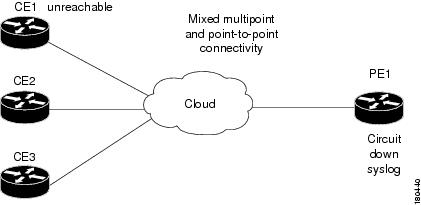
In Figure 6-36 on the PE1 device that has multipoint connectivity, one of the circuits under the IP interface has gone down and the CE1 device which is connected to it has become unreachable. The status of the IP interface has not changed and other circuits are still operational.
Figure 6-36 General Interface Example
The following failures are identified in the network:
•
•
The following correlation information is provided:
•
–
ATM Examples
Similar examples involving ATM technology have the same result, assuming that a failure in an unmanaged network causes the status of the IP interface to change to down (ILMI is enabled).
Ethernet, Fast Ethernet, Gigabit Ethernet Examples
This section includes the following examples:
•
•
Interface Example 6
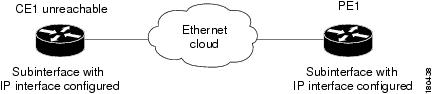
In Figure 6-37 there is an unreachable CE due to a failure in the unmanaged network.
Figure 6-37 Interface Example 6
The following failures are identified in the network:
•
•
The following correlation information is provided:
•
•
Interface Example 7
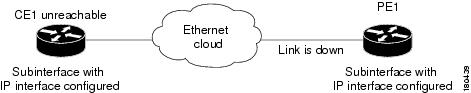
In Figure 6-38 there is a Link Down on the PE that results in the CE becoming unreachable.
Figure 6-38 Interface Example 7
The following failures are identified in the network:
•
•
•
The following correlation information is provided:
•
–
–
–
GRE Tunnel Down/Up
Generic Routing Encapsulation (GRE) is a tunneling protocol that encapsulates a variety of network layer packets inside IP tunneling packets, creating a virtual point-to-point link to devices at remote points over an IP network. It is used on the Internet to secure VPNs. GRE encapsulates the entire original packet with a standard IP header and GRE header before the IPsec process. GRE can carry multicast and broadcast traffic, making it possible to configure a routing protocol for virtual GRE tunnels. The routing protocol detects loss of connectivity and reroutes packets to the backup GRE tunnel, thus providing high resiliency.
GRE is stateless, meaning that the tunnel endpoints do not monitor the state or availability of other tunnel endpoints. This feature helps service providers support IP tunnels for clients, who do not know the service provider's internal tunneling architecture. It gives clients the flexibility of reconfiguring their IP architectures without worrying about connectivity.
GRE Tunnel Down/Up Alarm
When a GRE tunnel link exists, if the status of the IP interface of the GRE tunnel edge changes to down, a GRE Tunnel Down alarm is created. The IP Interface Status Down alarms of both sides of the link will correlate to the GRE Tunnel Down alarm. The GRE Tunnel Down alarm will initiate an IP-based flow toward the GRE destination. If an alarm is found during the flow, it will correlate to it. For more information, see GRE Tunnel Down, page 16-15.
Note
When a failure occurs, the GRE tunnel link is marked orange. When the IP interface comes back up, a fixing alarm is sent, and the link is marked green. The GRE Tunnel Down alarm is cleared by a corresponding GRE tunnel up alarm.
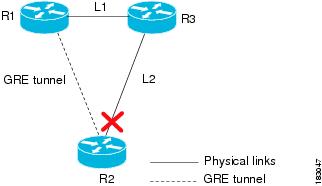
GRE Tunnel Down Correlation Example 1
Figure 6-39 provides an example of a GRE Tunnel Down correlation for a single GRE tunnel.
In this example:
•
•
•
Figure 6-39 GRE Tunnel Down Example 1 (Single GRE Tunnel)
When the link down occurs on L2, a Link Down alarm appears. A GRE Tunnel Down alarm is issued as the IP interfaces of the tunnel edge devices go down. The Interface Status Down alarms will correlate to the GRE Tunnel Down alarm. The GRE Tunnel Down will correlate to the Link Down alarm.
The system provides the following report:
•
•
[GRE Tunnel Down, Router1:tunnel < > Router 2:tunnel]
–
–
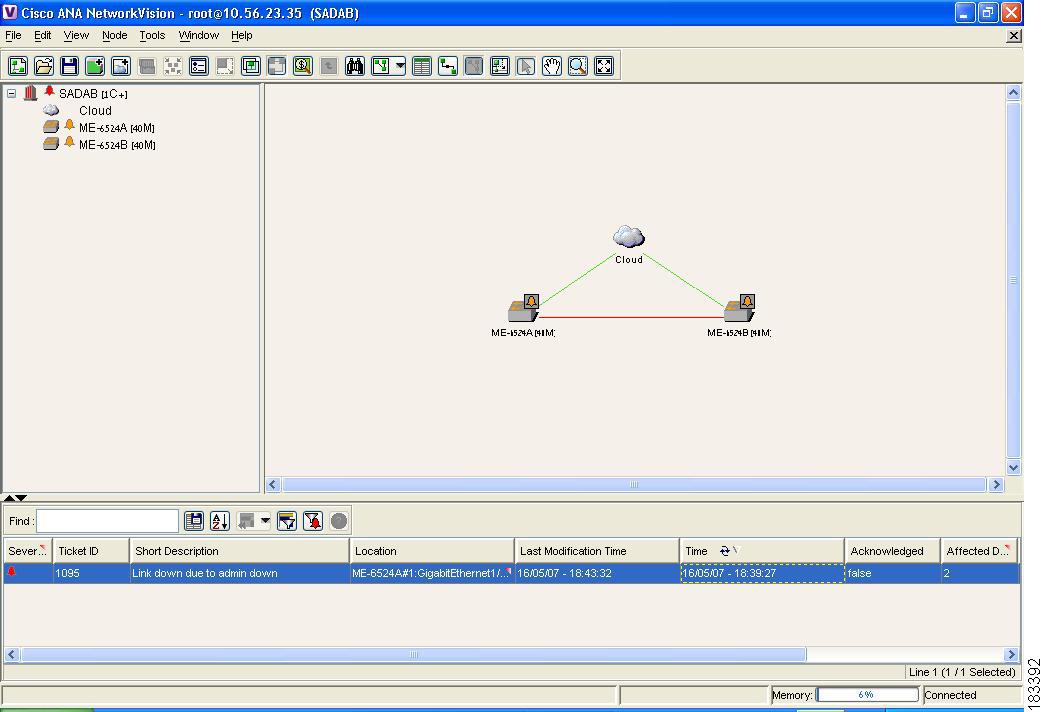
GRE Tunnel Down Correlation Example 2
This example provides a real-world scenario, whereby multiple GRE tunnels cross through a physical link. When this link is shut down by an administrator, many alarms are generated. All the alarms are correlated to the root cause ticket, Link Down Due to Admin Down ticket, as illustrated in Figure 6-40.
Figure 6-40 GRE Tunnel Down Example 2 (Multiple GRE Tunnels)
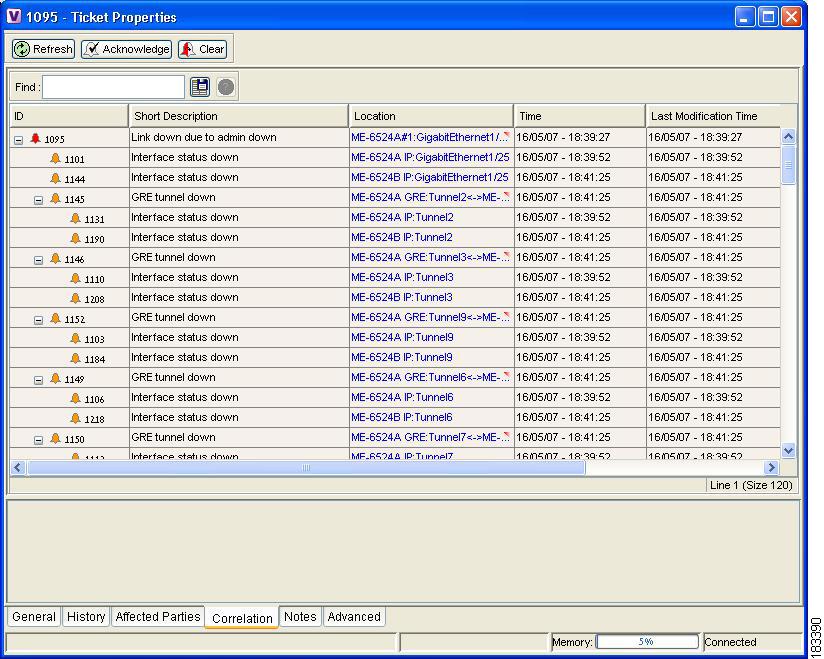
Figure 6-41 shows the Correlation tab of the Ticket Properties dialog box that displays all the alarms that are correlated to the ticket, including the correlation for each GRE tunnel and its interface status.
Figure 6-41 Alarms Correlation to GRE Tunnel Down Ticket
As illustrated, the system provides the following report:
•
•
[GRE Tunnel Down, ME-6524AGRE:Tunnel2 < > ME-6524B GRE:Tunnel2]
–
–
[GRE Tunnel Down, ME-6524AGRE:Tunnel3 < > ME-6524B GRE:Tunnel3]
–
–
and so on.