Feedback
Table Of Contents
Viewing the Network Element Inventory
Information Tabs and Tables in the Properties Pane
Opening the Port Utilization Graph
Opening the DLCI/VC/Cross Connect Table
Viewing the Network Element Inventory
The Cisco ANA solution maintains continuous, real-time discovery of all the physical and logical entities of the network inventory and the relationships among them. It automatically reflects in its distributed system inventory every addition, deletion and modification that occurs in the network.
Note
The window displayed for all the devices is similar in appearance, but the information that can be viewed for each device may vary.
These topics describe how to view the physical and logical inventory of a selected device in any mapped network:
•
•
•
•
The Inventory window also enables the user to view all the tickets that are collected on the selected NE in the ticket pane. For more information, see Ticket Pane.
Opening the Inventory Window
The Inventory window enables you to perform the following functions:
•
•
•
•
•
•
•
•
•
For more specific information on MPLS-TE (Traffic Engineering) tunnels and Cisco ANA Network's Traffic Engineering Tunnel viewing capabilities, see the Cisco Active Network Abstraction 3.6.6 MPLS User Guide.
To open the Inventory window, do one of the following:
•
•
,
•
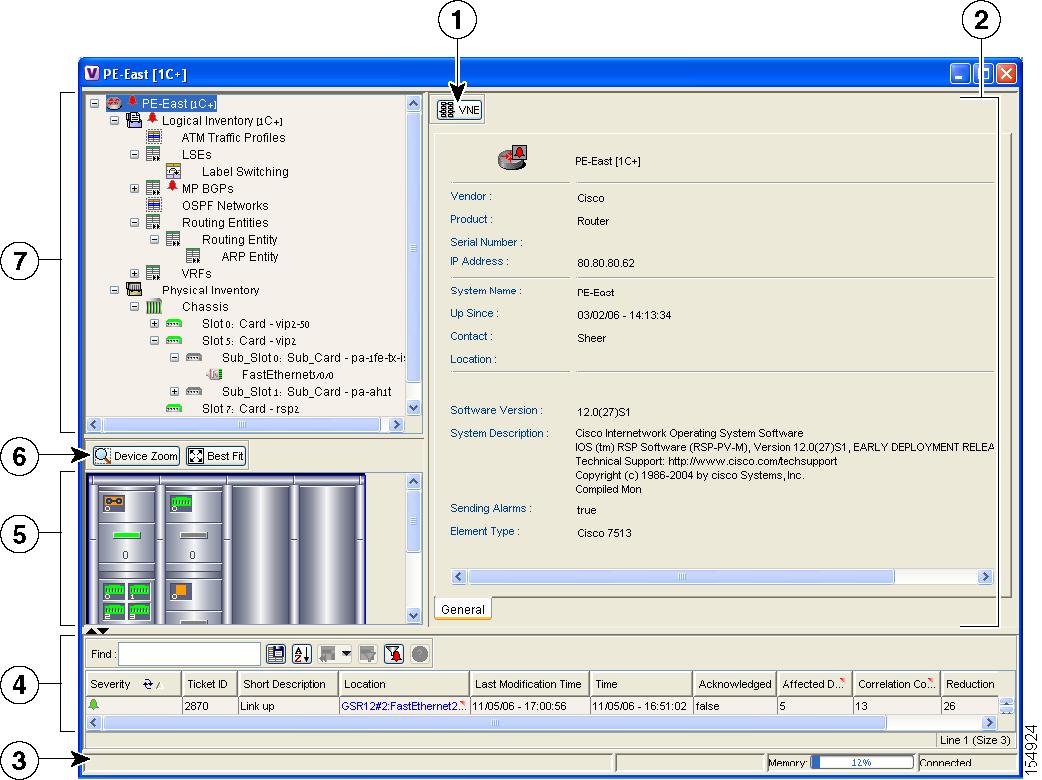
Figure 11-1 provides an example of an inventory window.
Figure 11-1 Inventory Window
VNE Properties icon (launches VNE view)
Device view panel
Properties pane, including tabs and tables
Device view panel toolbar
Status bar
Tree pane
Ticket pane
•
•
logical inventory branch. For more information about logical inventory information see Viewing Logical Inventory.
Note
The Inventory window displays the physical and logical inventory for the selected device. The Inventory window is divided into the following areas:
•
All the areas displayed in the Inventory window are correlated; this means that selecting an option in one area affects the information displayed in the other areas.
The information displayed in the Inventory window varies according to the network element or network element component selected in the tree pane.
For more information about the right-click shortcut menus that are displayed in the Inventory window, see Cisco ANA NetworkVision Shortcut Menus, page 2-22.
Tree Pane
The tree pane displays a tree-and-branch representation of the selected device and all its modules. The tree pane is divided into two main branches: logical inventory and physical inventory.
The window heading and the highest level of the tree pane displays the name of the VNE given to the device as defined in Cisco ANA Manage. The highest level of the tree pane also displays the device icon and status. For more information about icons, see Appendix A, "Icon Reference."
The color of the device icon in the tree pane reflects its severity. In addition, the color of the network element component in the device view panel is the same as the color of the network element component in the tree pane. For more information about severity and status, see Network Element Status Indicators, page 2-13.
The branches of the tree pane display the different network element components, for example, a chassis, card and so on. When a network element component is selected in the tree pane, the information displayed in the Information tabs and tables in the properties pane is updated. The branches in the tree pane can be expanded and collapsed to display and hide information as needed.
Figure 11-1 displays the different network element component icons used to display physical inventory in the tree pane of the Inventory window.
Table 11-1 Physical Inventory Icons
Chassis
Shelf
Slot/Subslot
Port/Logical Port
Unmanaged Port
For more information about the device icons displayed, see Appendix A, "Icon Reference." A business tag can be attached to the selected network element component by right-clicking. For more information about business tags, see Chapter 12, "Working with Business Tags."
For more information about the right-click menus that are displayed in the tree pane of the Inventory window, see Cisco ANA NetworkVision Shortcut Menus, page 2-22.
Device View Panel
The device view panel provides a way for you to visually locate network elements in the chassis and identify their status. All occupied slots in the chassis are rendered in the device view panel. If a port is down, it is shown in red in both the tree pane and the device view panel, allowing you to quickly pinpoint the problem.
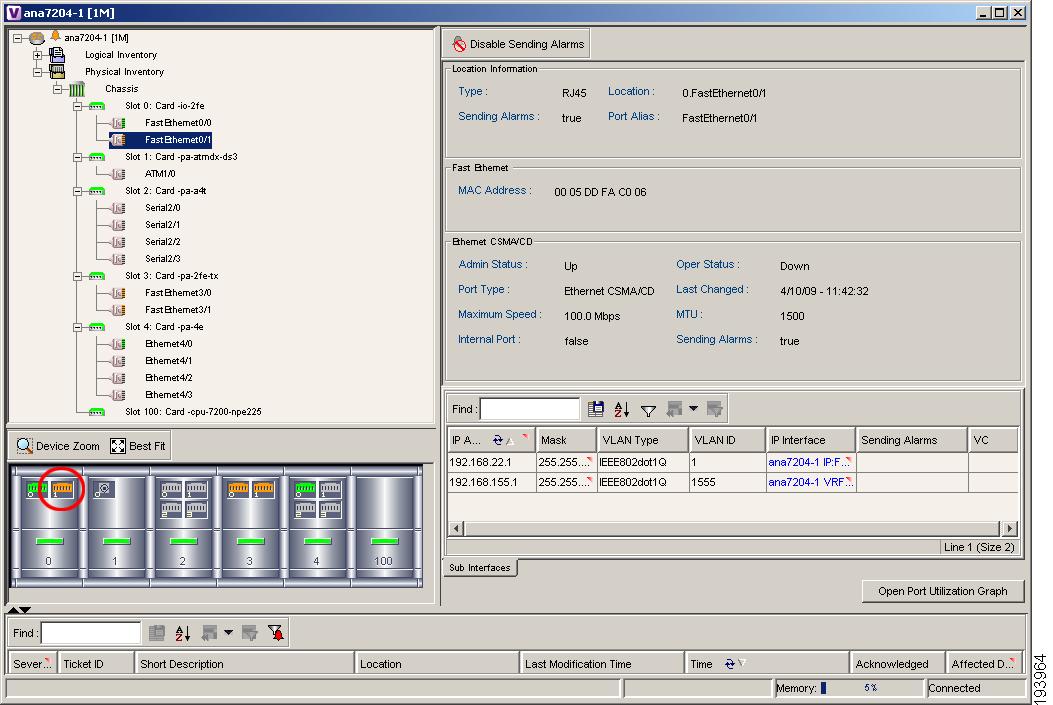
Figure 11-2 is an example of a device view panel for a Cisco 7204VXR router. The six slots in the device view panel correspond to the six slots in the physical inventory tree. Figure 11-2 also illustrates what is displayed when the user clicks the circled port. Cisco ANA displays both the element's properties and its location in the physical inventory tree.
Figure 11-2 Device View Panel
Device View Panel Toolbar
The Inventory window contains the following tools that are connected to the device view panel:
Ticket Pane
The ticket pane is displayed at the bottom of the Inventory window. The tickets displayed relate to the element selected in the tree pane. For more information about the ticket pane, see Ticket Pane, page 2-11.
Note
Information Tabs and Tables in the Properties Pane
The Information tabs and tables in the properties pane enable you to view physical and logical inventory information, depending on your selection in the tree pane or device view panel, for example, chassis or port information. The inventory information displayed in the Inventory window varies according to the device or network element component selected in the tree pane.
The properties pane displays context-sensitive tabs and toolbars; the tools displayed depend on your selection in the tree pane or device view panel. For example, when an ATM port is selected, the Show VC Table tool is displayed on the toolbar.
In addition, the user can display the properties of a row in a table by double-clicking the row in the table or by right-clicking it and selecting Properties from the shortcut menu.
For more information about the toolbar displayed in the table of the properties pane, see Working with Cisco ANA NetworkVision Tables, page 2-29.
Viewing Physical Inventory
Each device that is managed by Cisco ANA is modeled in the same manner. The physical inventory reflects the physical components of the managed network element. Cisco ANA NetworkVision enables the user to view physical inventory information for the following modules:
•
•
•
•
•
•
Pluggable transceiver modules on Cisco equipment are displayed in a three-level hierarchy:
container object
module (such as an SFP container)
port (such as an SFP or GBIC port)
Note
Physical inventory is continuously updated for both status and configuration. The addition of a new card, removal of a card or any change to the device is reflected by the VNE and updated instantly.
The system also includes built-in properties (system properties) for each network element. This includes information such as MAC address, MTU and media type.
Note
The information displayed in the Inventory window changes according to the device type, device and network element component selected in the tree pane.
The following buttons may be displayed in the Inventory window for physical inventory:
•
•
•
For information about configuring topology from a port, see Adding Static Links, page 14-7.
Opening the Port Utilization Graph
Cisco ANA NetworkVision enables you to display the online information of a port: Rx/Tx Rate and Rx/Tx Rate History.
To open the port utilization graph:
Step 1
Step 2
The following areas are displayed in the Port Statistics dialog box:
•
•
•
•
Step 3
to close the Port Statistics dialog box.
Managing Port Alarms
The user can enable or disable the alarms on a selected port. By default, alarms are enabled on all ports. When the alarms are disabled on a port, no alarms will be generated for the port and they will not be displayed in the ticket pane.
To disable a port alarm:
Step 1
Step 2
•
•
The Sending Alarms field in the Location Information area of the Context pane displays the value false. This indicates that the alarm for the required port has been disabled. In addition, the toolbar in the properties pane now displays the Enable Sending Alarms tool.
The user can enable the alarms on a port at any time.
To enable a port alarm:
Step 1
Step 2
The Sending Alarms field in the Location Information area of the properties pane displays the value true. This indicates that the alarm for the required port has been enabled.
In addition, the toolbar in the properties pane now displays the Disable Sending Alarms tool.
Viewing Logical Inventory
Cisco ANA NetworkVision enables you to view logical inventory information. Cisco ANA maintains logical inventory for each device. The logical inventory reflects dynamic data such as configuration data, forwarding and service-related components, which affect traffic handling in the device.
The information displayed in the Inventory window changes according to the device type and branch selected in the tree pane.
Note
Logical Inventory Window
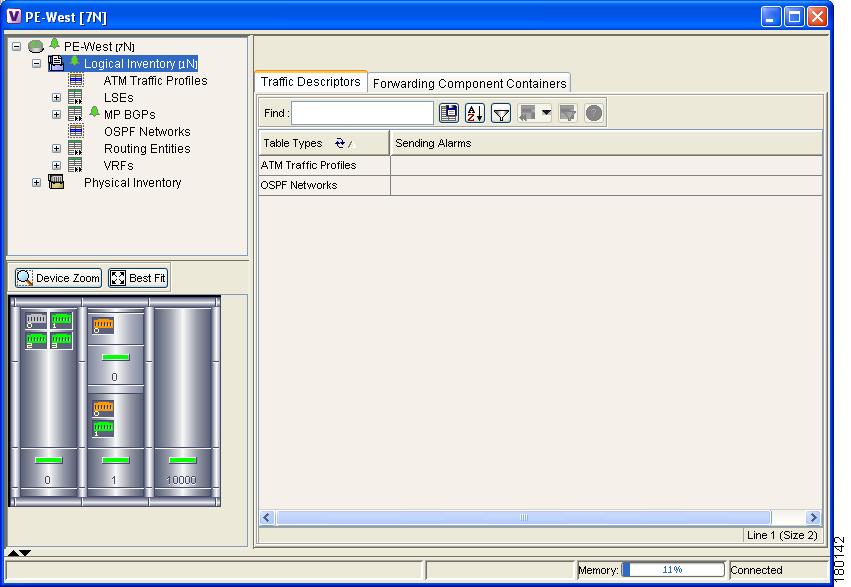
Logical inventory information is displayed in the Inventory window, which can be divided into tabs, for example, Traffic Descriptors and Forwarding Component Containers, as shown in Figure 11-3.
Figure 11-3 Logical Inventory Information Displayed in the Inventory Window
Note
The Traffic Descriptors tab enables you to view the profiles for which logical inventory information can be displayed, for example, Frame Relay Traffic Profiles and ARP Entities.
The logical device information is also updated in the model of the network element in order to accurately reflect the traffic handling which is being performed by the device at any time.
The Forwarding Component Containers tab enables you to view a list of context profiles for which logical inventory information can be displayed, for example, VRFs and Routing Entities.
Note
Opening the DLCI/VC/Cross Connect Table
The DLCI/VC/Cross Connect Table enables you to view DLCI, VC, and Cross Connect information on a selected port. For example, the Cross Connect table enables you to view in and out port cross connect information, including cross connect information for unmanaged networks, Frame Relay, and ATM devices.
To open the DLCI/VC/Cross Connect table:
Step 1
Step 2
Step 3