Table Of Contents
Tracking Faults Using Cisco ANA EventVision
Viewing Events in Cisco ANA EventVision
All Tab
System Event Tabs
Audit Tab
Provisioning Tab
Security Tab
System Tab
Network Event Tabs
Syslog Tab
Service Tab
Ticket Tab
V1 Trap Tab
V2-V3 Trap Tab
Working in Cisco ANA EventVision
Viewing Event Properties
Audit Tab Properties
Security Tab Properties
Provisioning Tab Properties
V1, V2, and V3 Trap Tab Properties
Refreshing the Events List
Filtering Events
Exporting Displayed Data
Logging Out
Tracking Faults Using Cisco ANA EventVision
These topics describe how to track faults using Cisco ANA EventVision:
•
Viewing Events in Cisco ANA EventVision—Describes how to view events displayed in the Cisco ANA EventVision window.
•
Working in Cisco ANA EventVision—Describes how to use Cisco ANA EventVision to view, filter and display the properties of specific events, and how to refresh and export events.
Viewing Events in Cisco ANA EventVision
Events are displayed according to event categories, which are represented by tabs in the Cisco ANA EventVision window. Each tab displays an events list log that provides event information for the specific event category. Events can be of system type or network type.
Events are sorted according to date, where the latest event is displayed first and the oldest event is displayed last. You can define the filter to be used as well as the number of events to be displayed in the events list, using the Cisco ANA EventVision Options dialog box. Each page of the events list displays the selected number of events per page as defined in the Cisco ANA EventVision Options dialog box.
For more information, see Selecting Cisco ANA EventVision Viewing Options, page 3-6.
Because the table of events may be very lengthy, you can use the left and right arrows on the navigation toolbar to move through the event records. You can also use the submenus that are available from the View > Go To in the main menu.
The following sections describe:
•
All Tab
•
System Event Tabs
•
Network Event Tabs
All Tab
The All tab displays information about all the events. Additional information specific to the event category can be viewed in the Events Properties dialog box or individual category tabs.
When you launch Cisco ANA EventVision, the All tab is not displayed. You can open this tab, as required, using the Open All Tab option on the File menu.
Note
When you open the All tab, it may take some time to retrieve information from the Cisco ANA database for all category events.
The following columns are displayed in the All tab:
•
Severity—The severity of the ticket.
•
Event ID—The sequential ID number of the event.
•
Short Description—A description of the event, such as "Device Unreachable."
•
Time—The date and time when the event occurred. The time is displayed in the following format MM/DD/YY HH:MM:SS.
•
Event Type—The event type: audit, system, ticket, provisioning, syslog, security, service, and traps.
System Event Tabs
The following tabs in the Cisco ANA EventVision window display the system events:
•
Audit Tab
•
Provisioning Tab
•
Security Tab
•
System Tab
Audit Tab
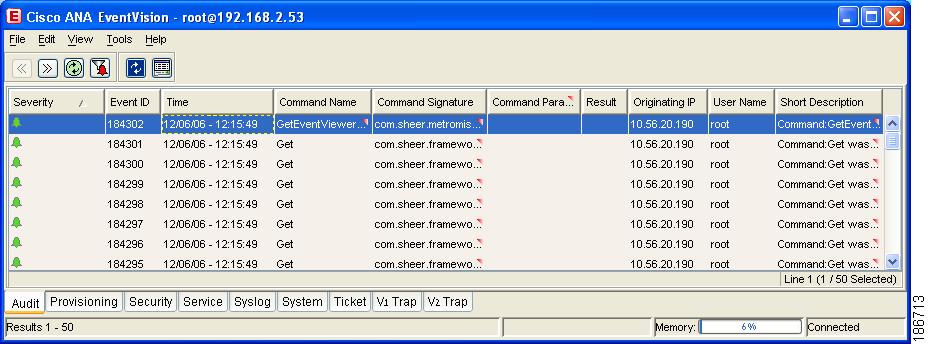
The Audit tab displays all the events generated for each command or request in Cisco ANA, for example, opening Cisco ANA EventVision displays the following "GetEvent" in the Audit List:
Figure 13-1 Audit Tab
The following information is displayed in the Audit tab:
•
Severity—Displays an icon of a bell, which is colored according to the severity of the alarm on the event (the color and type of alarm is displayed in the Properties pane's Severity field). See Event Status Indicators, page 3-4.
•
Event ID—The sequential ID number of the event (generated by Cisco ANA).
•
Time—Logged and recorded at the time the event happened.
•
Command Name—The audit specific command name, prefaced by, for example, Get..., Update..., Find...
•
Command Signature—The actual command run by Cisco ANA, such as "com.sheer.framework."
•
Command Parameter—This parameter is currently unavailable in this version.
•
Result—This parameter is currently unavailable in this version.
•
Originating IP—The IP address of the client that issued the command.
•
Username—The name of the user who initiated the command.
•
Short Description—An aggregation of portions of the same fields in the Audit Command fields.
The type of information displayed in the Audit tab can be audited by defining the appropriate registry keys and their values. The audit service enables you to audit all the commands executed in the system, for example, the Get command can be audited. The Audit tab then displays this information.
The following parameters can be controlled through the registry:
•
Override the default auditing details level
•
All or specific users
•
Display only specific commands
The available values for these parameters are:
•
Concise—Displays all (default) events besides the Command Parameters and Result column values.
•
Disable—The commands will not be logged in the Audit tab events list.
Provisioning Tab
Events displayed in the Provisioning tab are events triggered during the configuration of a device. Cisco ANA sends an event explaining the configuration operation, for example, to configure the cross connect table in a device. The Provisioning tab displays detailed information specific to this event category. It contains events both from the Cisco ANA Command Builder and Cisco ANA Workflow Editor. Additional information specific to this event category can be viewed in the Events Properties dialog box.
The following additional information is displayed in the Provisioning tab:
•
Severity—Displays an icon of a bell, which is colored according to the severity of the alarm on the event (the color and type of alarm is displayed in the Properties pane's Severity field). See Event Status Indicators, page 3-4.
•
Event ID—The sequential ID number of the event.
•
Short Description—A description of the event, such as "Script Show has failed."
•
Username—The name of the user who performed the provisioning operation.
•
Time—Logged and recorded at the time the event happened.
•
Status—The status, for example, success or fail.
•
Source—The VNE key on which the provisioning operation succeeded or failed.
Security Tab
The Security tab displays detailed information specific to this event category. Security events are related to client login and user activity when managing the system and the environment. Additional information specific to this event category can be viewed in the Events Properties dialog box.
The following additional information is displayed in the Security tab:
•
Severity—Displays an icon of a bell, which is colored according to the severity of the alarm on the event (the color and type of alarm is displayed in the Properties pane's Severity field). See Event Status Indicators, page 3-4.
•
Event ID—The sequential ID number of the event.
•
Short Description—A description of the event, such as "Successful login by root."
•
Location—A hyperlink to the entity that triggered the event.
•
Time—Logged and recorded at the time the event happened.
•
Client IP—The IP address of the client where the event was triggered.
•
Username—The username of the client where the event was triggered.
•
Client Type—The type of client: Cisco ANA NetworkVision, Cisco ANA EventVision, Cisco ANA Manage or Unknown (for example, BQL, Registry Editor and so on).
•
Auto Cleared—Indicates whether the alarm is cleared automatically. The alarm is cleared when it is correlated to an alarm which has been cleared. If the alarm is cleared automatically, it is defined as true.
For more information about the system security events displayed in this tab, see the Cisco Active Network Abstraction 3.6.6 Administrator Guide.
System Tab
The System tab displays all the system events related to the everyday working of the internal system and its components. These events may be related to the Cisco ANA and Cisco ANA Gateway resources, representing the system log. Additional information specific to this event category can be viewed in the Events Properties dialog box.
The following additional information is displayed in the System tab:
•
Severity—Displays an icon of a bell, which is colored according to the severity of the alarm on the event (the color and type of alarm is displayed in the Properties pane's Severity field). See Event Status Indicators, page 3-4.
•
Event ID—The sequential ID number of the alarm.
•
Short Description—A description of the event, such as "Dropped Events Report."
•
Location—The entity that triggered the event.
•
Time—Logged and recorded at the time the event happened.
For more information about the system error and event messages displayed in this tab, see Appendix B, "Error Reference."
Network Event Tabs
The following tabs in the Cisco ANA EventVision window display the network events:
•
Syslog Tab
•
Service Tab
•
Ticket Tab
•
V1 Trap Tab
•
V2-V3 Trap Tab
Syslog Tab
The Syslog tab displays all the syslog events. These events are related to the predefined set of syslogs received from the devices by the VNEs, which are used to generate the syslog events. Additional information specific to this event category can be viewed in the Events Properties dialog box.
The following additional information is displayed in the Syslog tab:
•
Severity—Displays an icon of a bell, which is colored according to the severity of the alarm on the event (the color and type of alarm is displayed in the Properties pane's Severity field). See Event Status Indicators, page 3-4.
•
Alarm ID—The sequential ID number of the alarm.
•
Short Description—A description of the alarm, such as "Device configuration changed."
•
Location—A hyperlink to the entity that triggered the event.
•
Time—Logged and recorded at the time the alarm happened.
Service Tab
The Service tab displays all the alarms generated by Cisco ANA, for example, link down. Service events are related to the alarms that are generated by the Cisco ANA system. Additional information specific to this event category can be viewed in the Events Properties dialog box.
The following additional information is displayed in the Service tab:
•
Severity—Displays an icon of a bell, which is colored according to the severity of the alarm on the event (the color and type of alarm is displayed in the Properties pane's Severity field). See Event Status Indicators, page 3-4.
•
Alarm ID—The sequential ID number of the alarm.
•
Short Description—A description of the event, such as "Route entry restored."
•
Location—A hyperlink to the entity that triggered the event.
•
Time—Logged and recorded at the time the event happened.
For more information about the service alarms that are displayed in this tab, see Chapter 16, "Supported Service Alarms."
Ticket Tab
The Ticket tab displays detailed information specific to this event category. A ticket event contains a single root alarm (the root cause alarm can be of any alarm type, for example, syslog, service and so on), and all its subsequent correlated alarms. Additional information specific to this event category can be viewed in the Events Properties dialog box.
The maximum number of open tickets (other tickets can be correlated to them) for the system is 5000. This number is configurable in the registry, however we do not recommend increasing it.
Note
Changes to the registry should be performed only with the support of Cisco. For details, contact your Cisco Account Team.
A "tickets capacity overflow, red threshold reached
" system alarm is generated when this number is exceeded. The alarm severity is defined as critical.
The following additional information is displayed in the Ticket tab:
•
Severity—Displays an icon of a bell, which is colored according to the severity of the alarm on the event (the color and type of alarm is displayed in the Properties pane's Severity field). See Event Status Indicators, page 3-4.
•
Ticket ID—The sequential ID number of the ticket.
•
Short Description—A description of the event, such as "Link Down."
•
Location—A hyperlink to the entity that triggered the ticket.
•
Last Modification Time—The date and time when the ticket was last modified.
•
Time—Logged and recorded at the time the first event happened.
•
Acknowledged—The status of the ticket that is being handled: true (acknowledged) or false (not acknowledged).
•
Affected Devices Count—The number of devices affected by the ticket (the sources of the alarm and their subsequent alarms).
•
Correlation Count—Displays the number of correlated alarms included in the ticket. For example, if in the Correlation tab of the Ticket Properties, there are 3 alarms correlated to the root cause alarm, then the counter displays the number 3. If there are 2 alarms correlated to the root cause alarm, and each alarm in turn has 2 alarms correlated to it, then the counter displays the number 4.
•
Reduction Count—Displays the number of alarms included in the ticket. For example, nine alarms can be viewed in the History tab of the Ticket Properties window, but only a single ticket is displayed in the Ticket pane.
•
Duplication Count—Displays the number of occurrences of the original root cause alarm included in the ticket. For example, if the ticket was created by a link down root cause alarm, and then the link goes up and down again quickly so that it is included in the same ticket, then the duplication counter displays the number 2, because the root cause alarm occurred twice.
For information about viewing ticket properties, see Audit Tab Properties.
V1 Trap Tab
This event is triggered when the network element sends a trap message to Cisco ANA because of a network event, for example, Link Down. The V1 Trap tab displays detailed information specific to this event category. Additional information specific to this event category can be viewed in the Events Properties dialog box.
The following additional information is displayed in the V1 Trap tab:
•
Severity—Displays an icon of a bell, which is colored according to the severity of the alarm on the event (the color and type of alarm is displayed in the Properties pane's Severity field). See Event Status Indicators, page 3-4.
•
Alarm ID—The sequential ID number of the alarm.
•
Short Description—A description of the event, such as "Enterprise generic trap."
•
Time—Logged and recorded at the time the event happened.
•
Location—A hyperlink to the entity that triggered the trap.
For more information about the Cisco IOS and Cisco IOX traps displayed in this tab, see the Cisco Active Network Abstraction 3.6.6 VNE Reference Guide.
V2-V3 Trap Tab
The V2-V3 Trap tab displays detailed information specific to this event category. Additional information specific to this event category can be viewed in the Events Properties dialog box.
The following additional information is displayed in the V2-V3 Trap tab:
•
Severity—Displays an icon of a bell, which is colored according to the severity of the alarm on the event (the color and type of alarm is displayed in the Properties pane's Severity field). See Event Status Indicators, page 3-4.
•
Alarm ID—The sequential ID number of the alarm.
•
Short Description—A description of the event, such as "Enterprise generic trap."
•
Location—A hyperlink to the entity that triggered the trap.
•
Time—Logged and recorded at the time the event happened.
For more information about the Cisco IOS and Cisco IOX traps displayed in this tab, see the Cisco Active Network Abstraction 3.6.6 VNE Reference Guide.
Working in Cisco ANA EventVision
The following sections describe how to view, filter and display the properties of specific events, and how to refresh and export events:
•
Viewing Event Properties—Describes how to view the properties of a specific event type.
•
Refreshing the Events List—Describes how to manually and automatically refresh the events list.
•
Filtering Events—Describes how to define a filter for the events displayed in the events list.
•
Exporting Displayed Data—Describes how to export the currently displayed data from the Cisco ANA EventVision table. In addition, it describes how to import the data and view it at a later stage.
•
Logging Out—Describes how to log out of Cisco ANA EventVision.
Viewing Event Properties
Cisco ANA EventVision enables you to view the properties of a specific event type. The Event Properties dialog box displays detailed information about the event, for example, the severity and the number of affected parties.
To view Event Properties:
Step 1
Select the required tab for the specific event type and the event in the Cisco ANA EventVision window.
Step 2
Do one of the following:
•
Double-click the event in the events list.
•
Select View > Properties from the main menu.
•
Right-click the event and choose Properties.
The Properties tabbed window is displayed for the selected event.
Note
Clicking Details Pane on the toolbar displays the properties of the selected ticket or event in the Properties Details pane.
The header displays the ID number of the selected event.
The properties of a selected ticket can be viewed in the Ticket Properties dialog box. For a detailed description of the Ticket tab properties, see Opening Ticket Properties, page 15-10.
The following sections describe:
•
Audit Tab Properties
•
Security Tab Properties
•
Provisioning Tab Properties
•
V1, V2, and V3 Trap Tab Properties
Audit Tab Properties
The properties of a selected auditing event can be viewed in detail by displaying the Audit Event Properties dialog box. For information about opening the Properties dialog box, see Viewing Event Properties.
The Audit Event Properties dialog box is divided into the following tabs:
•
General—General information about the selected event. For a detailed description of the information displayed in the Audit tab, see Audit Tab.
•
Advanced—This tab is not relevant for auditing events.
•
Audit—Detailed information specific to auditing events. For a detailed description of the information displayed in the Audit tab, see Audit Tab.
Security Tab Properties
The properties of a selected security event can be viewed in detail by displaying the Security Event Properties dialog box. For information about opening the Properties dialog box, see Viewing Event Properties.
The Security Event Properties dialog box is divided into the following tabs:
•
General—General information about the selected event. For a detailed description of the information displayed in the Security tab, see Security Tab.
•
Affected Parties—This tab is not relevant for security events.
•
Advanced—This tab is not relevant for security events.
•
Security—Detailed information specific to security events. For a detailed description of the information displayed in the Security tab, see Security Tab.
Provisioning Tab Properties
The properties of a selected provisioning event can be viewed by displaying the Provisioning Event Properties dialog box. For example, you can view a detailed description of the provisioning event.
For information about opening the Properties dialog box, see Viewing Event Properties.
For a detailed description of the information displayed in the Provisioning tab, see Provisioning Tab.
The Description area of the Provisioning Event Properties dialog box details all the content of the workflow output or the command. If it is a workflow, the description includes the execution sequence of the workflow and log messages. The execution sequence includes the output of all the scripts executed by the workflow and also indicates if workflow rollback has occurred. If it is a command, the description includes the output of the script.
V1, V2, and V3 Trap Tab Properties
The properties of a selected V1, V2, or V3 Trap alarm can be viewed by displaying the V1/V2/V3 Trap Alarm Properties dialog box. For example, you can view the translated OID and value.
For information about opening the Properties dialog box, see Viewing Event Properties.
The V1/V2/V3 Trap Alarm Properties dialog box is divided into the following tabs:
•
General—General information about the selected event. For more information about the information displayed in the V1 Trap tab, see V1 Trap Tab. For more information about the information displayed in the V2-V3 Trap tab, see V2-V3 Trap Tab.
•
Affected Parties—The services (affected pairs) that are potentially affected (potential impact analysis) by the ticket. See Affected Parties Tab, page 15-3.
•
Advanced—All the affected devices, correlation, duplication and reduction counts for the selected ticket. In addition, it provides any other additional information available about the ticket. For more information, see Advanced Tab, page 15-16.
•
Trap—General description of V1, V2, and V3 trap information. See Trap Tab.
Trap Tab
The Trap tab enables you to view V1, V2, and V3 trap information.
The following fields are displayed in the Trap tab:
•
Version—The SNMP version: version-1 or version-2c.
•
Community String—The community that the device sends to in the PDU.
•
Error Status—The error status: No Error, Too Big, No Such Name, Bad Value, Read Only, and Gen Err.
The following columns are displayed in the Values table:
•
Translated Oid—A string representation of the OID. For example, 1.3.6 is translated into iso(1).org(3).dod(6).
•
Translated Value—A string representation of the OID value. For example, 1.3 is translated to iso(1).org.10.
•
Oid—The OID that is not translated. It is a dot notation representation of the OID, such as "1.3.6.1.4.1.9."
•
Value—The value that is not translated, that is, it is not represented by string values.
Refreshing the Events List
Cisco ANA EventVision displays current event information in the events list. While viewing the list, this information is not updated unless you manually refresh the list or activate autorefresh. The default autorefresh setting is 60 seconds and can be adjusted (see Selecting Cisco ANA EventVision Viewing Options, page 3-6). Your filter settings remain intact.
Table 13-1 shows the refresh icons:
Table 13-1 Events List Refresh Icons
Button
|
Function
|
|
Manually refreshes the events list.
|
|
Automatically refreshes the events list (this icon indicates auto refresh is off).
|
|
Automatically refreshes the events list (this icon indicates auto refresh is on).
|
To manually refresh the events list, do one of the following:
•
Click the circular Refresh Table icon in the main toolbar.
•
Choose View > Refresh from the main menu.
To automatically refresh the list, click the square Refresh Table icon in the toolbar.
Filtering Events
The Filter dialog box allows you to filter events according to severity, ID, date and time, and by text in the description field. You may also use the filter to search for information in the database.
The Filter icon toggles to indicate that a filter has been applied.
Certain settings in the Cisco ANA EventVision Options dialog box will also affect your filters.
•
If you selected the Keep Last Filter option, the currently defined filter settings are saved in the registry and are displayed the next time you log in, but are not applied.
•
If you selected the Open Using Filter option, the events are continuously filtered according to the defined settings, even after logging out of and into the application.
See Selecting Cisco ANA EventVision Viewing Options, page 3-6, for more information.
Note
Filter fields are enabled or disabled according to the event type. For example, if a filter is applied to a ticket, all the fields are enabled.
To define a filter:
Step 1
Do one of the following:
•
Choose Edit > Filter from the main menu.
•
Click the Filter icon in the main toolbar.
The Filter Events dialog box is displayed.
Step 2
Configure the required filter values.
Step 3
Click OK to save your filter settings and apply the filter. The filtered events are displayed in the events list according to the defined criteria.
To remove the filter:
Step 1
Click the Filter icon in the main toolbar. The Filter Events dialog box is displayed.
Step 2
Click Clear. The selected options in the Filter Events dialog box are cleared.
Step 3
Click OK. All the events are displayed in the events list.
Exporting Displayed Data
Cisco ANA EventVision enables you to export the currently displayed data from the Cisco ANA EventVision table according to the criteria (total quantity of events) defined in the Cisco ANA EventVision Options dialog box. The data can then be imported and viewed at a later stage.
To export the table to a file:
Step 1
Choose File > Export from the main menu. The Export Table to File dialog box is displayed.
Step 2
Browse to the directory where you want to save the list.
Step 3
In the File name field, type a name for the list.
Step 4
Click Save. The displayed events list or rows are saved in the selected directory.
Logging Out
When you have finished working with Cisco ANA NetworkVision you can log out of the application. Any open maps and the workspace are automatically saved when you log out.
To log out of Cisco ANA NetworkVision:
Step 1
From the main menu, choose File > Exit, or click in the top right corner of the Cisco ANA NetworkVision window. A confirmation message is displayed.
Step 2
Click Yes. The Cisco ANA NetworkVision window is closed.
Note
If the map appearance has changed, a message is displayed, asking you whether to save the current appearance of the maps.