-
Cisco Content Security and Control SSM Administrator Guide, 6.1
-
Preface
-
Introducing the Content Security and Control SSM
-
Verifying Initial Setup
-
Configuring Mail Traffic (SMTP and POP3)
-
Configuring Web (HTTP) and File Transfer (FTP) Traffic
-
Managing Updates and Log Queries
-
Administering Trend Micro InterScan for Cisco CSC SSM
-
Monitoring Content Security
-
Troubleshooting Trend Micro InterScan for Cisco CSC SSM
-
Reimaging and Configuring the CSC SSM Using the Command Line
-
Using CSC SSM with Trend Micro Control Manager
-
Glossary
-
Index
-
 Feedback
Table Of Contents
Features of the Content Security Tab
Monitoring Live Security Events
Monitoring Content Security
This chapter describes monitoring content security from ASDM, and includes the following sections:
•
Features of the Content Security Tab
–
Features of the Content Security Tab
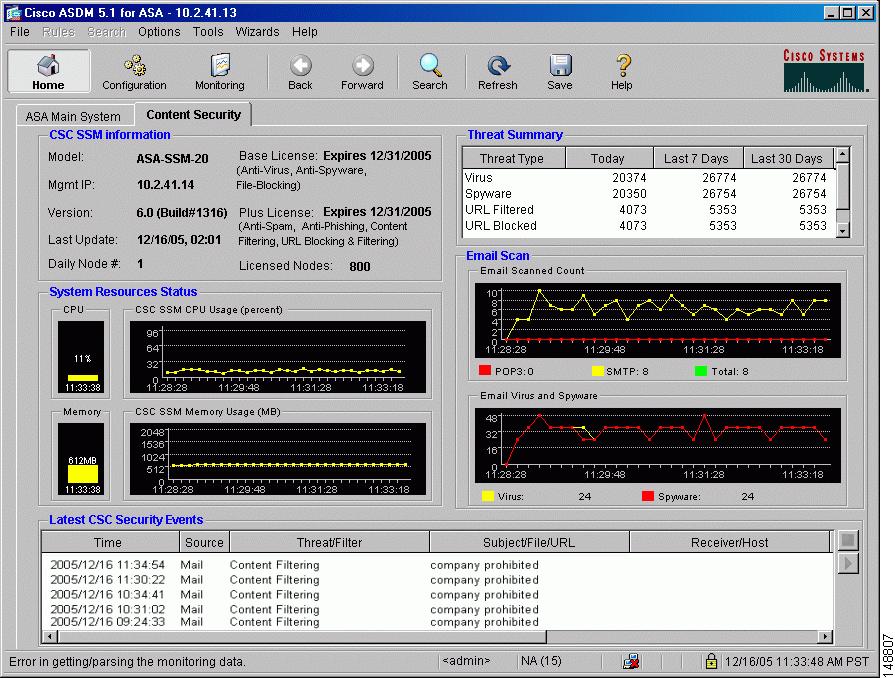
After you have connected to the CSC SSM, the Content Security tab displays, as shown in Figure 7-1. The Content Security tab shows you content security status at a glance, including:
•
•
•
•
•
Figure 7-1 Content Security Tab
Click the Help icon to view more detailed information about the information that appears in this window.
Monitoring Content Security
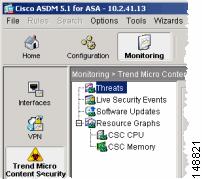
Click Monitoring > Trend Micro Content Security to display the Monitoring options. These options are:
•
•
•
•
The appearance of the Monitoring options in ASDM is shown in Figure 7-2:
Figure 7-2 Content Security Monitoring Options in ASDM
Monitoring Threats
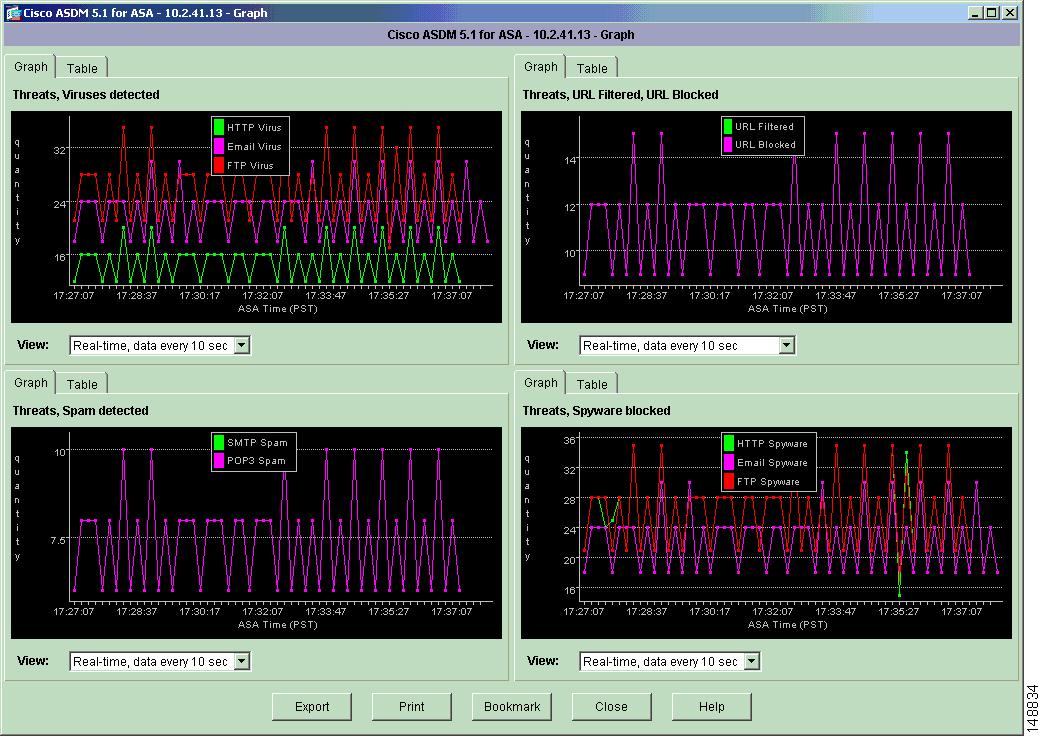
When you click Threats in the Monitoring pane, as shown in Figure 7-2, you can choose up to 4 categories of threats for graphing. You can display recent activity in the following categories:
•
•
•
•
For example, assume you have both the Base and Plus license, and you choose all four threat types for monitoring. The graphs might appear as shown in Figure 7-3:
Figure 7-3 Threat Monitoring Graphs
The graphs refresh on frequent intervals (every 10 seconds), allowing you to see recent activity at a glance. See the online help for more information.
Monitoring Live Security Events
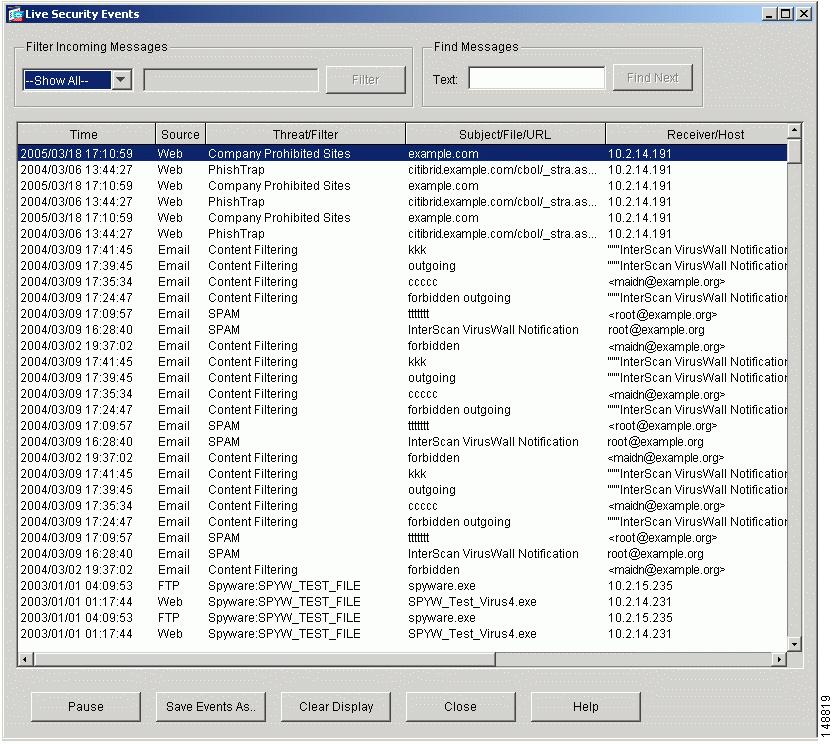
When you click Live Security Events in the Monitoring pane, after you click View, a report similar to the example in Figure 7-4 is created:
Figure 7-4 Live Security Events Monitoring Report
This report lists events detected by CSC SSM. The Source column displays "Email" for both SMTP and POP3 protocols. The horizontal and vertical scroll bars allow you to view additional report content. Filters at the top of the screen allow you to refine your search for specific events. See the online help for more information.
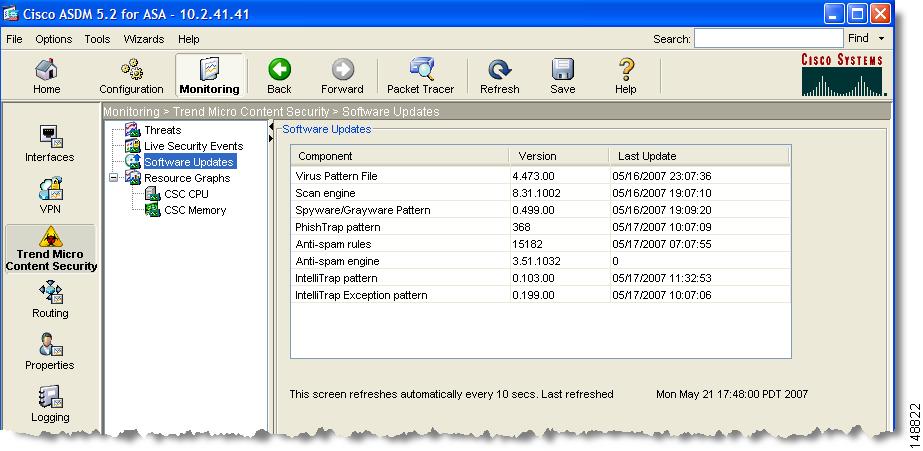
Monitoring Software Updates
When you click Software Updates in the Monitoring pane, as shown in Figure 7-5, the following information about the CSC SSM components displays:
Figure 7-5 Software Updates Monitoring Window
Click the Configure Updates link on Monitoring > Trend Micro Content Security > Software Updates in ASDM to display the Scheduled Update window in the CSC SSM console. See Figure 2-4 on page 2-5.
The Scheduled Update window allows you to specify the interval at which CSC SSM receives component updates from the Trend Micro ActiveUpdate server, which can be daily, hourly, or every 15 minutes.
You can also update components on demand via the Manual Update window in the SCS SSM console. See Figure 5-1 on page 5-2. Also see the online help for more information about both types of updates.
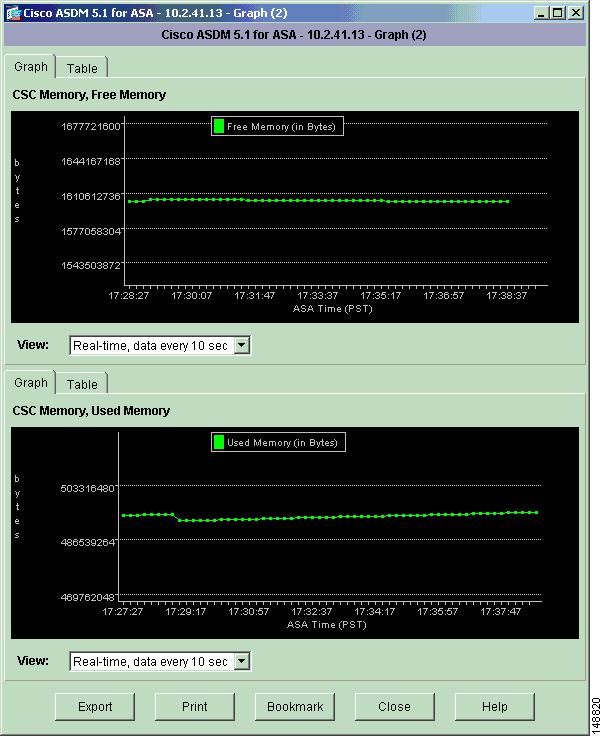
Monitoring Resources
When you click Resource Graphs in the Monitoring pane, there are two types of resources you can monitor, CPU usage, and memory. If these resources are running close to 100% usage, you might want to:
•
•
To view CPU or memory usage, choose the information for viewing and click Show Graphs. For example:
Figure 7-6 Memory Monitoring Graphs