-
Cisco Prime Network User Guide, 3.9
-
Preface
-
Cisco Prime Network Client Overview
-
Working with the Cisco Prime Network Vision Client
-
Viewing Network Element Properties
-
Working with Prime Network Vision Maps
-
Working with Links
-
Working with Business Tags and Business Elements
-
Working with the Prime Network Events Client
-
Tracking Faults Using Prime Network Events
-
Working with Tickets in Cisco Prime Network Vision
-
Working with Reports
-
Using Cisco PathTracer to Diagnose Problems
-
Monitoring Carrier Ethernet Services
-
Monitoring Carrier Grade NAT Properties
-
Monitoring DWDM Properties
-
Viewing Ethernet Operations, Administration, and Maintenance Tool Properties
-
IPv6 and IPv6 VPN over MPLS
-
Monitoring MPLS Services
-
Monitoring MToP Services
-
Viewing SBC Properties
-
Viewing Mobile Technologies in Prime Network
-
Icon and Button Reference
-
Index
-
 Feedback
Table Of Contents
Viewing Network Element Properties
User Roles Required to Work with Prime Network Vision
Information Available in Element Icons
Viewing the Properties of a Network Element
Viewing and Modifying VNE Properties
Viewing VNE Communication Status
Viewing the Physical Properties of a Device
Viewing Port Status and Properties
Generating the Port Utilization Graph
Viewing the Logical Properties of a Network Element
Logical Inventory Navigation Pane Branches
Logical Inventory Navigation Pane Icons
Logical Inventory Content Pane Tabs
Viewing Device Operating System Information
Viewing Network Element Properties
The following topics describe the user access roles required to use Cisco Prime Network Vision (Prime Network Vision) and how to view network element physical and logical properties in any mapped network:
•
User Roles Required to Work with Prime Network Vision
•
•
•
•
Note
•
•
•
Note
User Roles Required to Work with Prime Network Vision
This topic identifies the roles that are required to work with Prime Network Vision. Prime Network determines whether you are authorized to perform a task as follows:
•
•
For more information on user authorization, see the Cisco Prime Network 3.9 Administrator Guide.
The following tables identify the tasks that you can perform:
•
•
By default, users with the Administrator role have access to all managed elements. To change the Administrator user scope, see the topic on device scopes in the Cisco Prime Network 3.9 Administrator Guide.
Table 3-1 Default Permission/Security Level Required for Prime Network Vision Functions - Element Not in User's Scope
View maps
X
X
X
X
X
View network element properties
—
—
—
—
X
View network element properties in logical and physical inventory
—
—
—
—
X
View port status and properties
—
—
—
—
X
View VNE properties
—
—
—
—
X
Open the Port Utilization Graph
—
—
—
—
X
Enable and disable port alarms
—
—
—
—
X1
View tickets in inventory window
—
—
—
—
X
View network events in inventory window
—
—
—
—
X
View provisioning events in inventory window
—
—
—
—
X
Table 3-2 Default Permission/Security Level Required for Prime Network Vision Functions - Element in User's Scope
View maps
X
X
X
X
X
View network element properties
X
X
X
X
X
View network element properties in logical and physical inventory
X
X
X
X
X
View port status and properties
—
X
X
X
X
View VNE properties
X
X
X
X
X
Open the Port Utilization Graph
X
X
X
X
X
Enable and disable port alarms
—
—
—
X1
X1
View tickets in inventory window
X
X
X
X
X
View network events in inventory window
X
X
X
X
X
View provisioning events in inventory window
X
X
X
X
X
1 To enable and disable port alarms on a device, the Administrator scope level must also be configured for that device.
Information Available in Element Icons
Element icons in Prime Network Vision maps display different amounts of information according to their size as shown in Table 2-3. Table 3-3 identifies the information that is available for different types of elements for the four icons sizes.
Viewing the Properties of a Network Element
You can view the general information about a selected network element in the Prime Network Vision map view and view more detailed information by viewing the Properties window for the selected element.
To view network element properties:
Step 1
•
1. Position your mouse cursor on or near the required element.
2. Use the mouse scroll wheel to zoom in or out.
•
1. Click the required element in the Prime Network Vision map. The element displays a gray outline to indicate that it is selected.
2. Position the cursor on the gray outline and, while pressing the left mouse button, drag the mouse to resize the element in the map.
As the element size increases, additional information is displayed. For network elements, the available information is the following:
•
•
•
Step 2
•
•
•
•
•
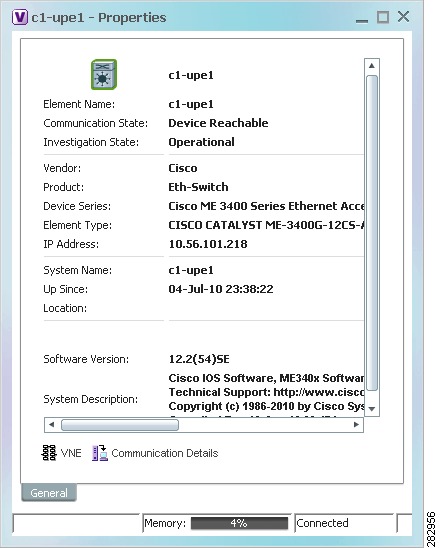
Depending on your selection, either the Properties window or inventory window is displayed with the inventory window providing slightly more information than the Properties window. Figure 3-1 shows the Properties window.
Figure 3-1 Properties Window
Table 3-4 describes the information displayed in both the Properties and inventory windows.
Table 3-4 Properties and Inventory Windows
Element icon
Icon representing the element in Prime Network Vision and displaying the current color associated with the element operational health. For more information on severity colors, see Prime Network Vision Status Indicators.
The icon might include a badge that indicates an alarm or another item of interest associated with the element. For more information about badges, see Network Element Badges.
Element Name
Name assigned to the element for ease of identification.
Communication State
Ability of the VNE to reach the network element, according to the health of the element. For more information about communication states, see the Cisco Prime Network 3.9 Administrator Guide.
Investigation State
Level of network element discovery that has been performed or is being performed by the VNE. For more information about investigation states, see the Cisco Prime Network 3.9 Administrator Guide.
Vendor
Vendor name, as defined in the device MIB.
Product
Product name of the element, as defined in the device MIB; for example, Router.
Device Series
Product series that the device belongs to, such as Cisco 7600 Series Routers.
Element Type
Element model, such as Cisco 7606.
Serial Number1
Serial number of the element.
CPU Usage1
Percentage of CPU currently in use by the element.
Memory Usage1
Amount of memory currently in use by the element.
IP Address
IP address used for managing the element.
System Name
Name of the device, as defined in the device MIB.
Up Since
Date and time the element was last reset.
Contact
Email address of the person responsible for the element.
Location
Physical location of the element, as defined in the device MIB.
DRAM Usage1
Percentage of available DRAM currently in use by the element.
Flash Device Size1
Amount of flash memory available on the element.
NVRAM Size1
Amount of NVRAM available on the element.
Software Version
Software version running on the element.
Software Description
Description of the system taken from the element.
Processor DRAM1
Amount of DRAM currently in use by the element's processor.
Sending Alarms1
Whether or not the element is configured for sending alarms: True or False.
VNE Details
Opens the Properties dialog box, where you can edit the VNE's properties, perform maintenance, configure polling rates, and identify IP addresses for which SNMP syslog and trap events are to be generated.
For more information, see:
•
VNE Status
Opens the Communication Details window, which displays the status of the device protocols and whether the device is sending traps and syslogs. For more information, see Viewing VNE Communication Status.
1 Displayed only in the inventory window.
Network Element Badges
Network elements and links can also display badges that are technology-specific, such as a Protected LSP or an STP root. Table 3-5 describes some of the badges that are available in Prime Network Vision. For more information, see the related topics.
Table 3-5 Network Element Badges
Access gateway
An MST or REP access gateway is associated with the element.
Blocking
The element associated with this badge has a REP alternate port.
Viewing REP Information in VLAN Domain Views and VLAN Overlays
Clock service
A clocking service is running on the associated element.
Lock
The associated network LSP is in lockout state.
Multiple links
One or more links is represented by the visual link and at least one of the links contains a badge.
Viewing REP Information in VLAN Domain Views and VLAN Overlays
Reconciliation
The element with this badge is associated with a network element that does not exist. For example, the device configuration has changed and a network problem exists.
Some elements can be deleted only if their components, such as EFPs, VPLS forwards, or VRFs, display the reconciliation icon.
REP primary blocking
The element associated with this badge has a REP primary port that is also blocking.
Viewing REP Information in VLAN Domain Views and VLAN Overlays
REP primary
The element associated with this badge has a REP primary port.
Viewing REP Information in VLAN Domain Views and VLAN Overlays
Redundancy service
The element associated with this badge is a backup pseudowire or a protected LSP.
STP root
The element associated with this badge is a STP root bridge or the root of an STP tree.
Viewing STP Information in VLAN Domain Views and VLAN Overlays
Viewing and Modifying VNE Properties
To view and optionally modify VNE properties:
Step 1
•
•
•
•
Step 2
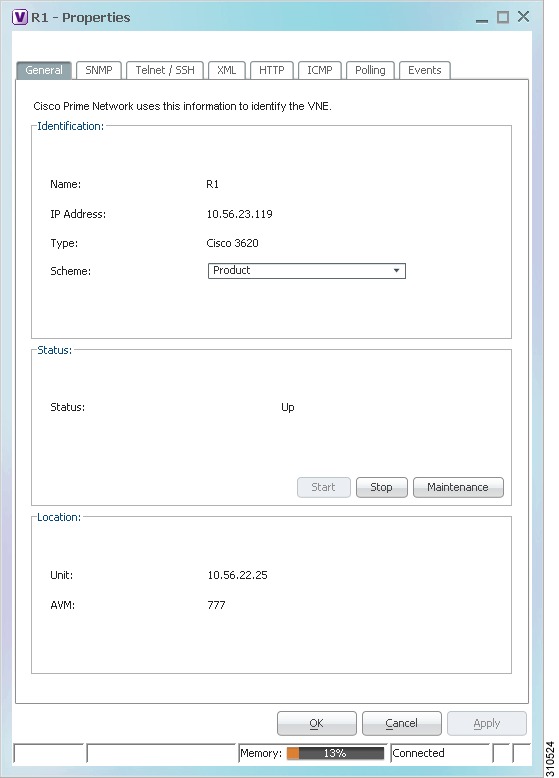
Figure 3-2 shows an example of the VNE Properties window.
Figure 3-2 VNE Properties Window
If the VNE for the element has been stopped, a message is displayed at the top of the inventory window letting you know that the VNE was stopped. The message includes a Refresh button so that you can refresh the information if the VNE has restarted. If the VNE is still down when you click Refresh, a VNE Unreachable message is displayed and the inventory window is closed. For more information about starting VNEs, stopping VNEs, adding new VNEs to a network, or modifying the status of a VNE, see the Cisco Prime Network 3.9 Administrator Guide.
Step 3
Step 4
If you do not change any of the settings, click OK or Cancel.
Viewing VNE Communication Status
To view the status of VNE communication:
Step 1
Step 2
Step 3
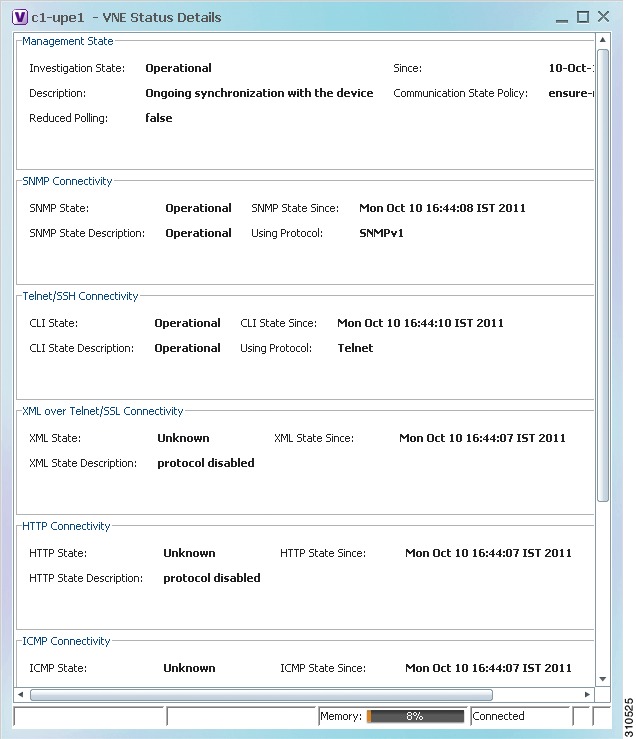
The VNE Status Details window is displayed as shown in Figure 3-3.
Figure 3-3 VNE Status Details Window
The VNE Status Details window provides information about:
•
•
•
•
•
•
•
•
For more information about the VNE Status Details window, see the Cisco Prime Network 3.9 Administrator Guide.
Updating VNE Information
Some VNEs use the reduced polling mechanism which automatically polls the device when a configuration change syslog is received and immediately updates the VNE information accordingly.
The risk of using reduced polling applies mostly to situations in which events are dropped. In those situations, changes might be detected later than they would have if regular polling were used.
If an event is dropped, the network element shows a Currently Unsynchronized investigation state. If you notice this VNE state, you can initiate polling to update the VNE information in either of the following ways:
•
•
Prime Network polls the selected element and updates the VNE information.
For more information about reduced polling, see the Cisco Prime Network 3.9 Administrator Guide.
Opening the Inventory Window
Table 3-6 describes the tasks that you can perform from the inventory window and related topics.
Table 3-6 Tasks Available from Inventory and Related Topics
Add or remove links.
Generate the Port Utilization graph for physical ports.
Manage the alarms being sent on a port.
Open Cisco PathTracer and launch a path trace.
Open the Prime Network Command Builder to create customized commands.
Open the Prime Network Soft Properties Manager to extend the amount of information displayed.
Update the VNE information.
View and optionally modify VNE properties.
View physical and logical inventory information.
•
View tickets or events for a device, service, or component.
View VNE communication details.
The inventory window also allows you to view technology-specific information. For more information on viewing technology-specific information in logical inventory or physical inventory, see:
•
•
•
•
•
•
•
•
To open the inventory window, do one of the following:
•
•
•
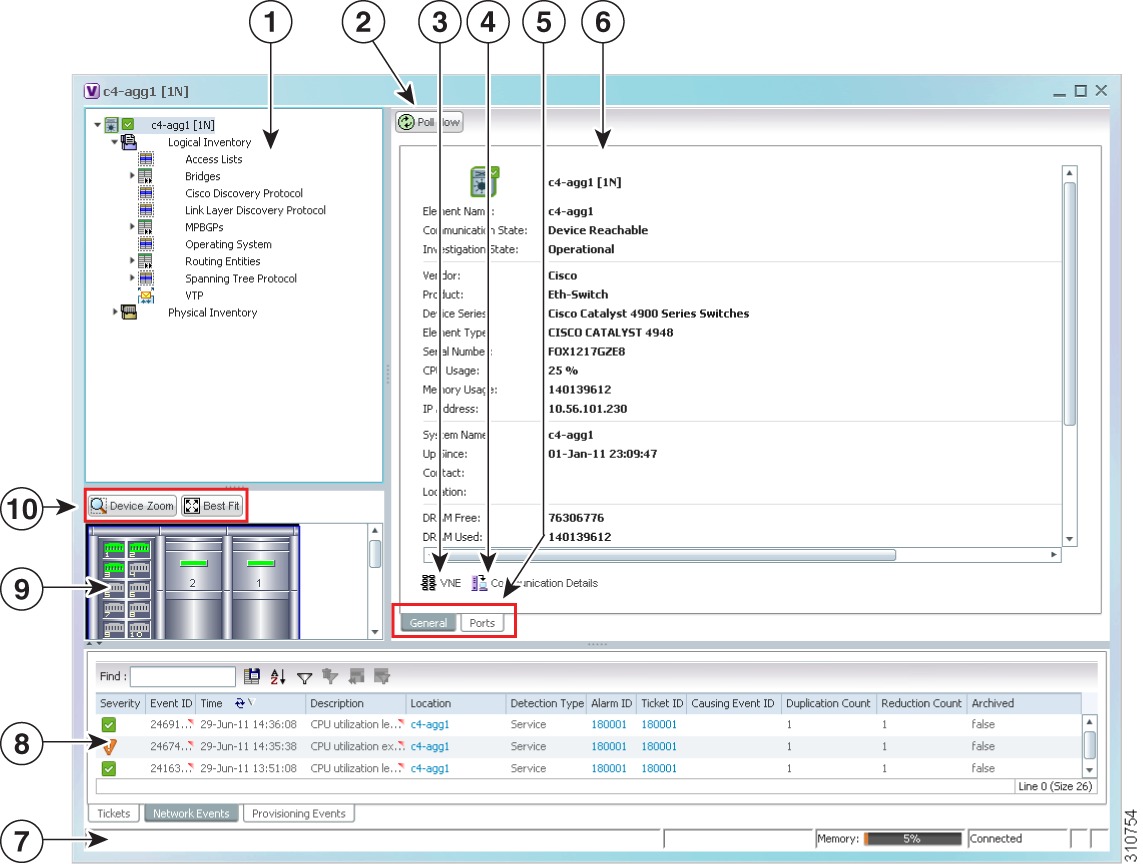
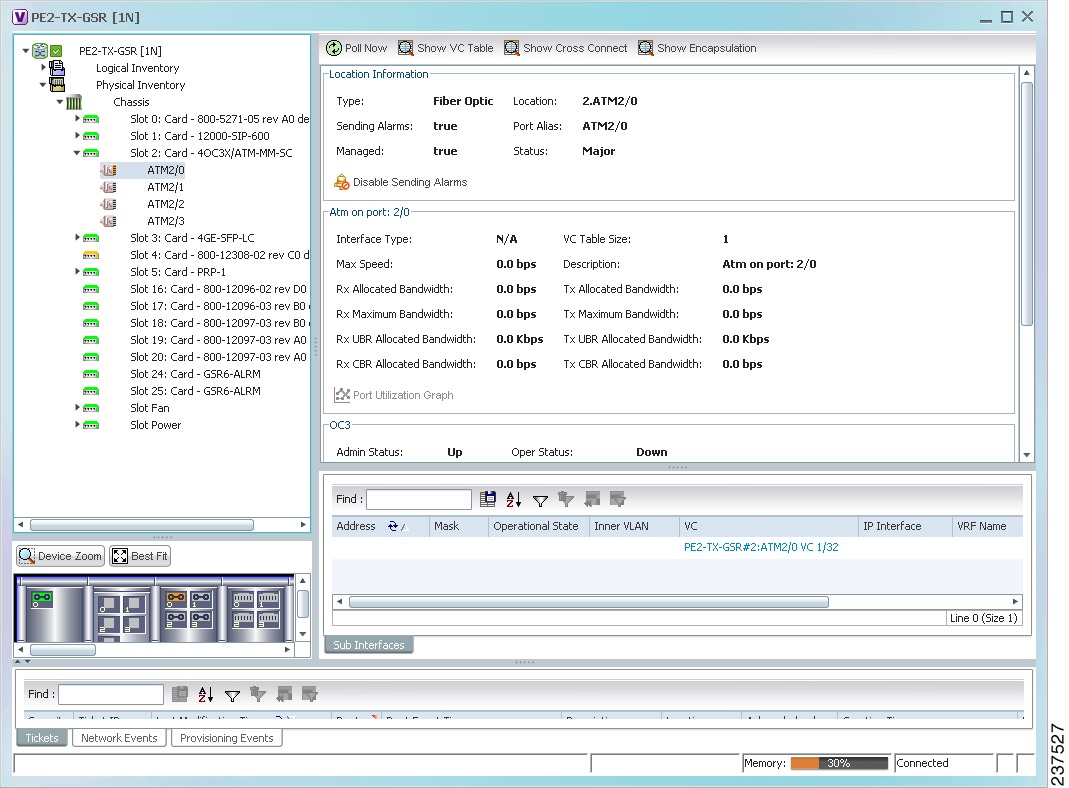
Figure 3-4 shows an example of an inventory window.
Figure 3-4 Inventory Window
The inventory window displays the physical and logical inventory for the selected item. For more information about the options in the inventory window, see:
•
•
All areas displayed in the inventory window are correlated; this means that selecting an option in one area affects the information displayed in the other areas.
The information displayed in the inventory window varies according to the item selected in the navigation pane.
To view logical inventory information, expand the Logical Inventory branch. For more information about logical inventory information, see Viewing the Logical Properties of a Network Element.
To view physical inventory information, expand the Physical Inventory branch. For more information about physical inventory information, see Viewing the Physical Properties of a Device.
Click Poll Now to update the display with the current VNE information.
Click the top right corner to close the inventory window.
Navigation Pane
The navigation pane in the inventory window displays a tree-and-branch representation of the selected device and its modules. The navigation pane contains two main branches:
•
•
When you select an item in the navigation pane, the information displayed in the content pane is updated. You can expand and collapse the branches in the navigation pane to display and hide information as needed.
The window heading and the highest level in the navigation pane display the name of the VNE given to the element as defined in Cisco Prime Network Administration. The element icon and status are displayed at the top of the navigation and content panes.
The color of the element icon reflects the element operational status. For more information about indicators of operational health and status, see:
•
Status Indicators
A status indicator icon appears next to the element icon for any unacknowledged tickets associated with the element. In addition, status indicator icons are displayed next to the specific logical or physical inventory branches that are associated with the ticket.
If you click a branch in the navigation pane that contains a status icon, the associated tickets and events are displayed in the tickets and events pane at the bottom of the inventory window.
Communication and Investigation State Icons
The navigation pane can also display a communication or investigation state icon next to the element icon in the navigation and content panes.
For more information about communication and investigation state icons, see VNE Management State.
Content Pane
The content pane contains two tabs:
•
The General tab can also display context-sensitive tabs and buttons; the buttons displayed depend on your selection in the navigation pane or device view panel. For example, if an ATM port is selected, the Show VC Table, Show Cross-Connect, or Show Encapsulation button might be displayed.
•
The content pane can also display context-sensitive tabs and buttons; the buttons displayed depend on your selection in the navigation pane or device view panel. For example, if an ATM port is selected, the Show VC Table, Show Cross-Connect, or Show Encapsulation button might be displayed.
In addition, you can view the properties of a row in a table by double-clicking the row or by right-clicking the row and choosing Properties.
For information about tables that appear in the content pane, see Working with Prime Network Tables.
Device View Pane
The device view pane enables you to visually locate elements in the chassis and identify their status. All occupied slots in the chassis are rendered in the device view pane. If a port is down, it is shown in red in both the navigation pane and the device view pane, allowing you to quickly pinpoint the problem.
Figure 3-5 provides an example of the device view pane for a Cisco device. The circled slot in the device view pane corresponds to the circled slot in the physical inventory navigation pane. If you click a port in the device view pane (see the circled port), Prime Network Vision displays both the properties of the element and its location in the navigation pane and content pane.
Figure 3-5 Device View Pane
Device View Pane Toolbar
The following tools for working with the device view pane:
Ticket and Events Pane
The ticket and events pane is displayed at the bottom of the inventory window and contains the following tabs:
•
Table 9-3 describes the information that is available in the Tickets tab.
•
Table 3-7 describes the information that is available in the Network Events tab.
•
All activations that occur are also included in this tab.
Table 8-4 describes the information that is available in the Provisioning Events tab.
Note
When displaying network and provisioning events, Prime Network Vision monitors the history size value defined in the Events tab of the Options dialog box (Tools > Options > Events). The default value is six hours and can be changed in Prime Network Administration. In addition, Prime Network Vision limits the maximum number of network and provisioning events that are sent from the server to client to 15,000 each. If the number of network or provisioning events exceeds the limit specified in the Options Events tab or the 15,000 maximum limit, Prime Network Vision purges the oldest events from table. The purging mechanism runs once per minute.
Tip
Viewing the Physical Properties of a Device
Each device that is managed by Prime Network is modeled in the same manner. The physical inventory reflects the physical components of the managed network element. Prime Network enables you to view physical inventory information for the following entities:
•
•
•
•
•
•
Table 3-8 identifies the icons used to display physical inventory components in the navigation pane.
Table 3-8 Physical Inventory Icons
Chassis
Shelf
Card/Subcard
Port/Logical Port
Pluggable Transceiver
Unmanaged Port
Physical inventory is continuously updated for both status and configuration. The addition of a new card, the removal of a card, or any change to the device is reflected by the VNE and updated instantly.
If you physically remove an item that Prime Network Vision is managing, the following changes occur in physical inventory, depending on the item removed:
•
–
–
The other properties of the removed item reflect the most recent value that was updated from the device with the following exceptions:
–
–
•
–
–
–
— The properties are no longer displayed.
— The connector type changes to Unknown.
— The pluggable port state changes to Out.
Fans and power supplies are displayed in physical inventory if they are field replacable units (FRUs). The manner in which the fans are displayed depends on whether the fans can be separated or not:
•
•
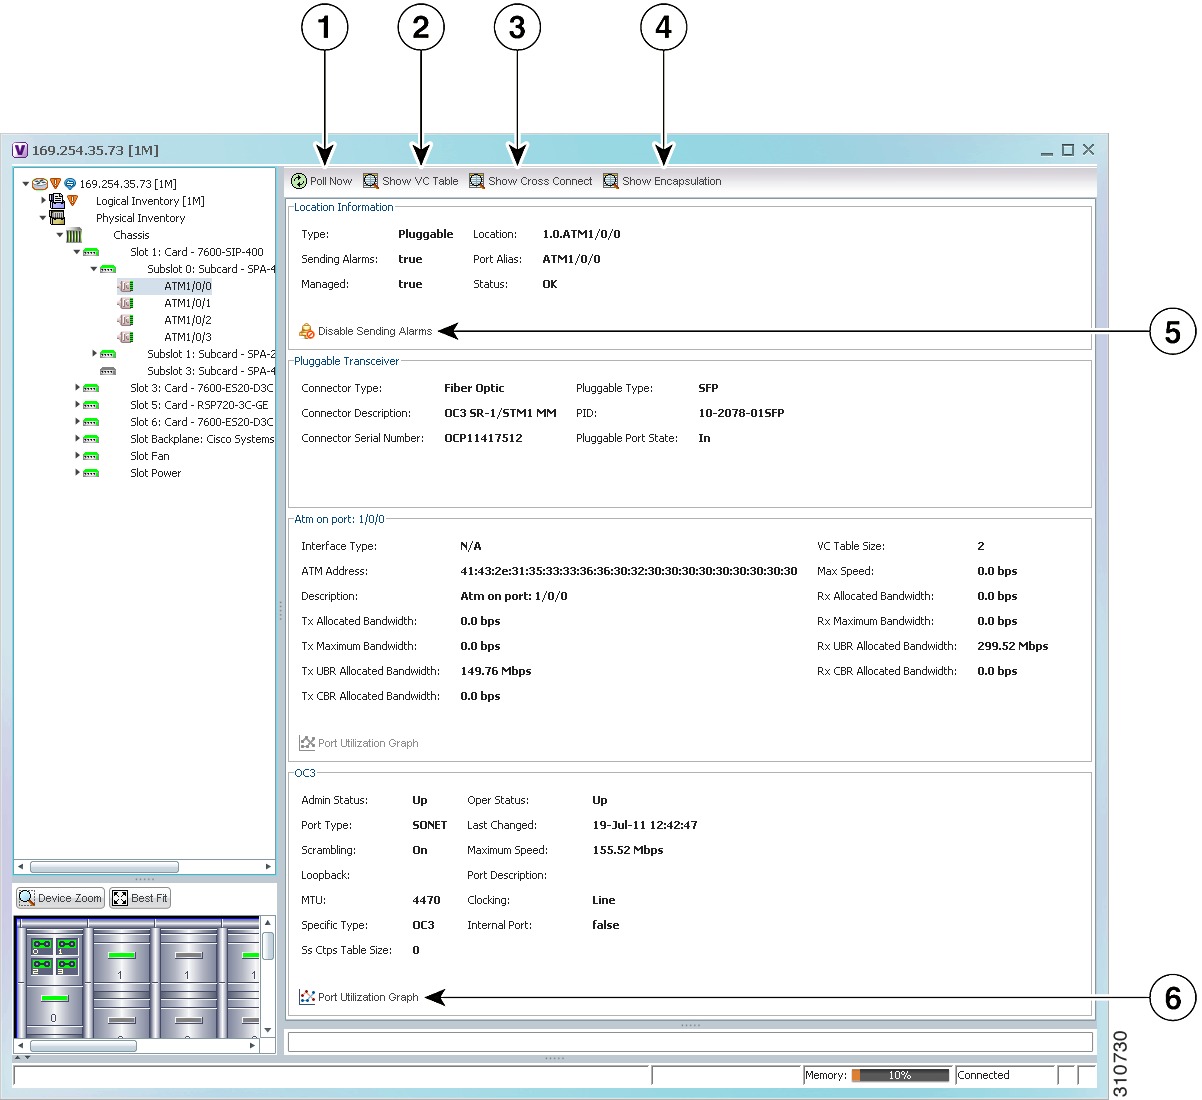
The window displayed for all the devices is similar in appearance. However, the individual sections that are displayed depends on the selected item. For example, when a port that supports pluggable transceivers is selected, the Pluggable Transceiver section is displayed. This section provides information such as the port connector's type and serial number, as well as an indication whether a transceiver is currently plugged in.
Figure 3-6 shows an example of a selection in physical inventory and the available buttons.
Figure 3-6 Physical Inventory Example
Poll Now button
Poll the VNE and update the information as needed.
For more information, see Updating VNE Information.
Show VC Table button
Displays virtual circuit (VC) information for the selected port.
For more information, see Viewing ATM VPI and VCI Properties.
Show Cross Connect button
Displays cross-connect information for incoming and outgoing ports.
For more information, see Viewing ATM Virtual Connection Cross-Connects.
Show Encapsulation button
Displays encapsulation information for incoming and outgoing traffic for the selected item.
For more information, see Viewing Encapsulation Information.
Disable Sending Alarms button
Enables you to manage the alarms on a port.
For more information, see Working with Ports.
Port Utilization Graph button
Displays the selected port traffic statistics: Rx/Tx Rate and Rx/Tx Rate History.
For more information, see Generating the Port Utilization Graph.
Show DLCI Table button
(not displayed)Displays data-link connection identifier (DCLI) information for the selected port.
The buttons that are displayed in the physical inventory content pane depend on the selected port.
For information about configuring topology from a port, see Adding Static Links.
For a detailed description of device properties, see Viewing the Properties of a Network Element.
Working with Ports
The following topics describe some of the options available for working with ports:
•
•
Viewing Port Status and Properties
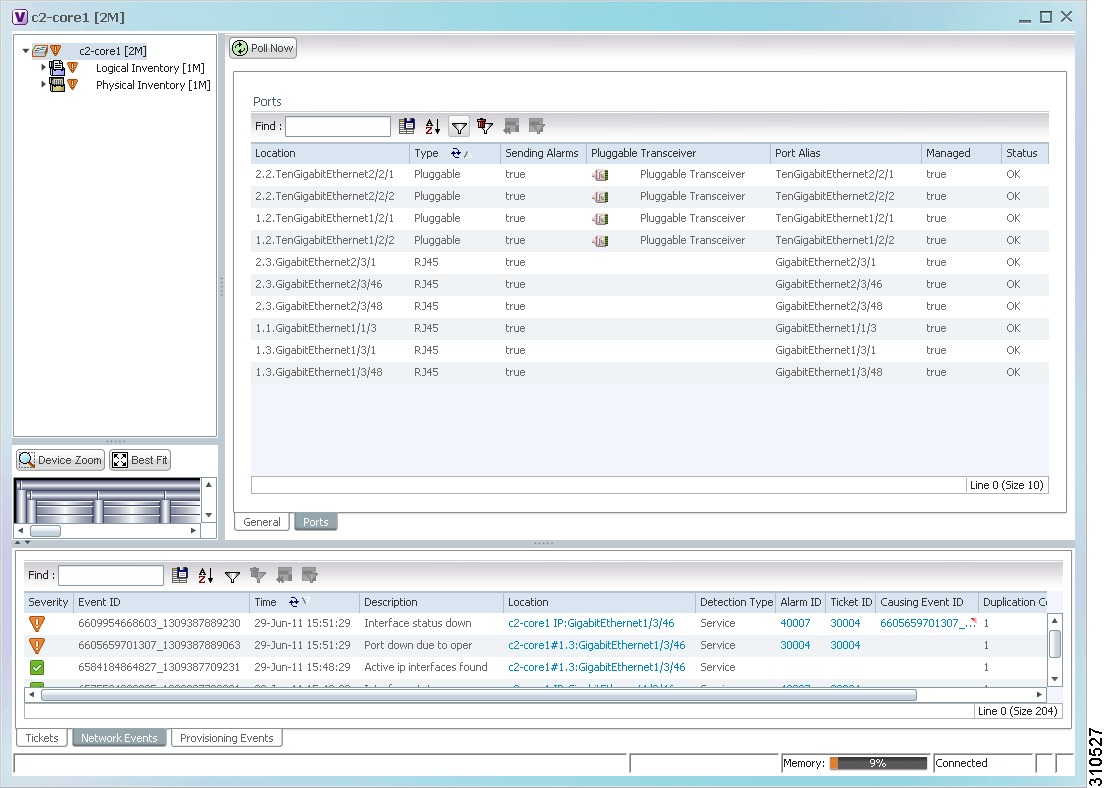
Prime Network Vision displays all ports on a device in the Ports tab in the inventory window.
This information is available to users with an Operator or higher role on the selected device. Users with a Configurator or higher role can modify the status of a single port or a selected group of ports as described in the following sections:
You can export the port list from Prime Network Vision by using the Export to CSV option in the toolbar.
Figure 3-7 shows an example of the Ports tab in the inventory window.
Figure 3-7 Ports Tab in the Inventory Window
Table 3-9 describes the information that is displayed in the Ports tab.
Viewing a Port Configuration
In addition to viewing logical inventory information from the logical inventory branch, you can view services provisioned on physical ports by clicking a physical port in the physical inventory branch. Information that is displayed includes:
•
•
•
To view a port's configuration:
Step 1
Step 2
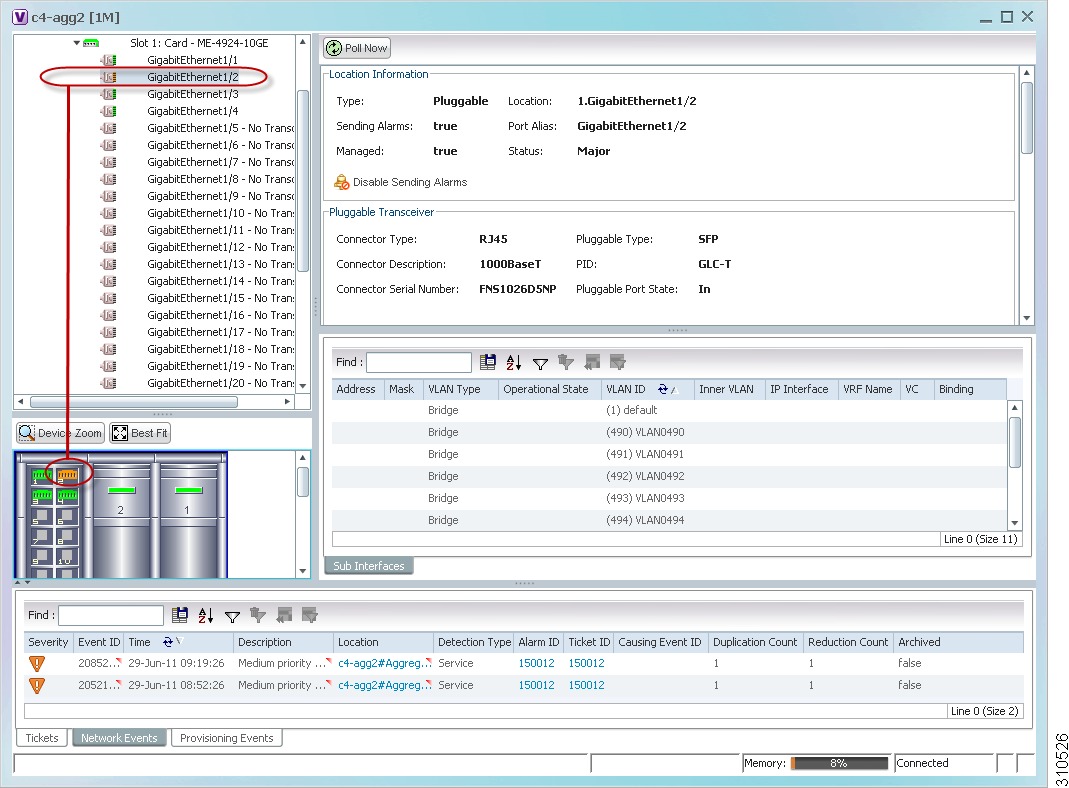
Figure 3-8 shows an example of the information (including the subinterfaces) displayed when a port is selected in the physical inventory branch of the inventory window.
Figure 3-8 Port Information in the Inventory Window
The subinterface is a logical interface defined in the device; all of its parameters can be part of its configuration. Table 3-10 describes the information that can be displayed in the Subinterfaces table. Not all fields appear in all Subinterfaces tables.
Table 3-10 Subinterfaces Table
Address
IP address defined in the subinterface.
Mask
Subnet mask.
VLAN Type
Type of VLAN, such as Bridge or IEEE 802.1Q.
Double-click the entry to view the Port IP VLAN Properties window containing:
•
•
•
•
Operational State
Operational state of the subinterface.
VLAN ID
VLAN identifier.
Inner VLAN
CE-VLAN identifier.
IP Interface
IP interface, hyperlinked to the VRF properties in the inventory window.
VRF Name
Name of the VRF.
Is MPLS
Whether this is an MPLS interface: True or False.
VC
Virtual connection (VC) configured on the interface, hyperlinked to the VC Table window.
For more information about VC properties, see Viewing ATM Virtual Connection Cross-Connects.
Tunnel Edge
Hyperlinked entry to the specific tunnel edge in logical inventory.
Binding
Hyperlinked entry to the specific bridge or pseudowire in logical inventory.
Disabling Alarms
By default, alarms are enabled on all ports. When the alarms are disabled on a port, no alarms are generated for the port and they are not displayed in the ticket and events pane.
To disable alarms on ports:
Step 1
Step 2
•
1. Navigate to the required port.
2. Right-click the required port and choose Disable Sending Alarms.
•
1. Click the Ports tab.
2. Right-click the required port and choose Disable Sending Alarms.
In response:
•
•
Step 3
a.
b.
c.
Enabling Alarms
You can enable the alarms on a port at any time.
To enable alarms:
Step 1
Step 2
•
1. Navigate to the required port.
2. Right-click the required port and choose Enable Sending Alarms.
•
1. Click the Ports tab.
2. Right-click the required port and choose Enable Sending Alarms.
In response:
•
•
Step 3
a.
b.
c.
Generating the Port Utilization Graph
Prime Network Vision enables you to view the Rx/Tx Rate and Rx/Tx Rate History of a port.
Note
To view port utilization statistics:
Step 1
Step 2
The following information is displayed in the Port Statistics dialog box:
•
•
•
•
Step 3
to close the Port Statistics dialog box.
Viewing the Logical Properties of a Network Element
Prime Network Vision enables you to view logical inventory information. Prime Network Vision maintains logical inventory for each network element. The logical inventory reflects dynamic data such as configuration data, forwarding, and service-related components that affect traffic handling in the element.
The information displayed in the inventory window changes according to the type of element and branch selected in the navigation pane.
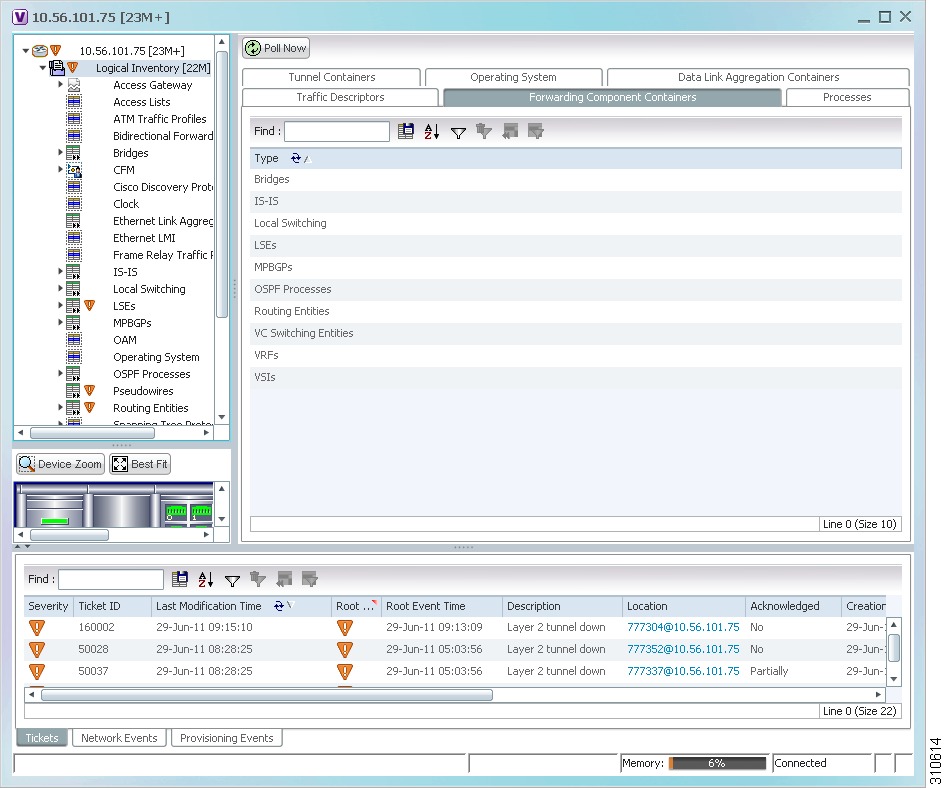
Logical Inventory Window
Logical inventory information is displayed in the inventory window as shown in Figure 3-9.
Figure 3-9 Logical Inventory Information Displayed in the Inventory Window
Note
Logical Inventory Navigation Pane Branches
Table 3-11 describes the branches that appear in the logical inventory navigation pane.
Logical Inventory Navigation Pane Icons
Each branch in the logical inventory navigation pane is represented by an icon and, if appropriate, includes an icon indicating
Table 3-12 describes the icons used in the logical inventory navigation pane.
Logical Inventory Content Pane Tabs
Table 3-13 describes the tabs that are displayed in the logical inventory content pane when you select Logical Inventory, depending on the device configuration.
Note
Viewing Device Operating System Information
Prime Network Vision discovers and automatically displays operating system information for Cisco IOS, Cisco IOS XR, and Cisco IOS XE devices in logical inventory. For other devices, choose the element name at the top of the inventory window navigation pane.
To view operating system information for Cisco IOS, Cisco IOS XR, or Cisco IOS XE devices:
Step 1
Step 2
•
Table 3-14 describes the information that is displayed for the Cisco IOS operating system.
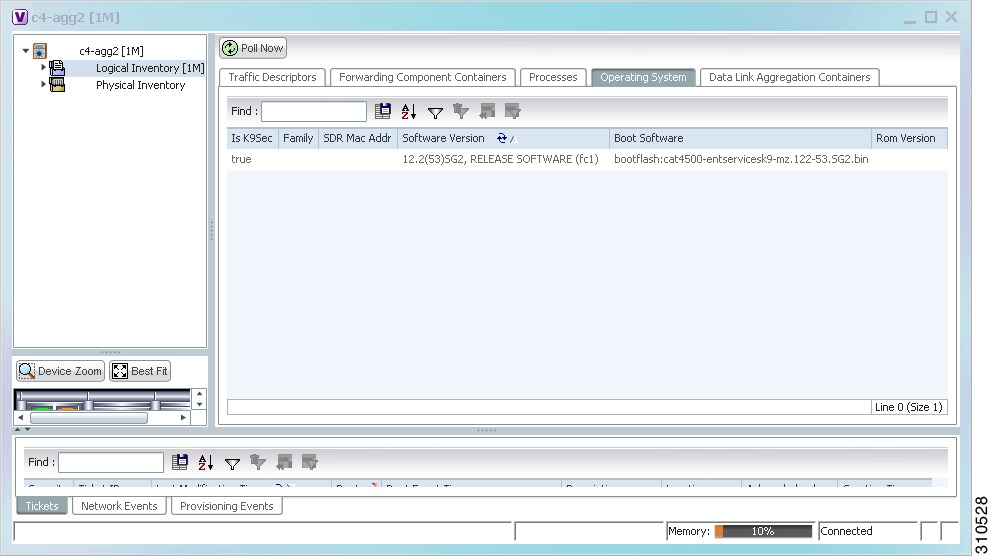
•
Figure 3-10 shows an example of the Operating System tab.
Figure 3-10 Operating System Tab in Logical Inventory
Table 3-15 describes the information that is displayed in the Operating System tab.
Step 3
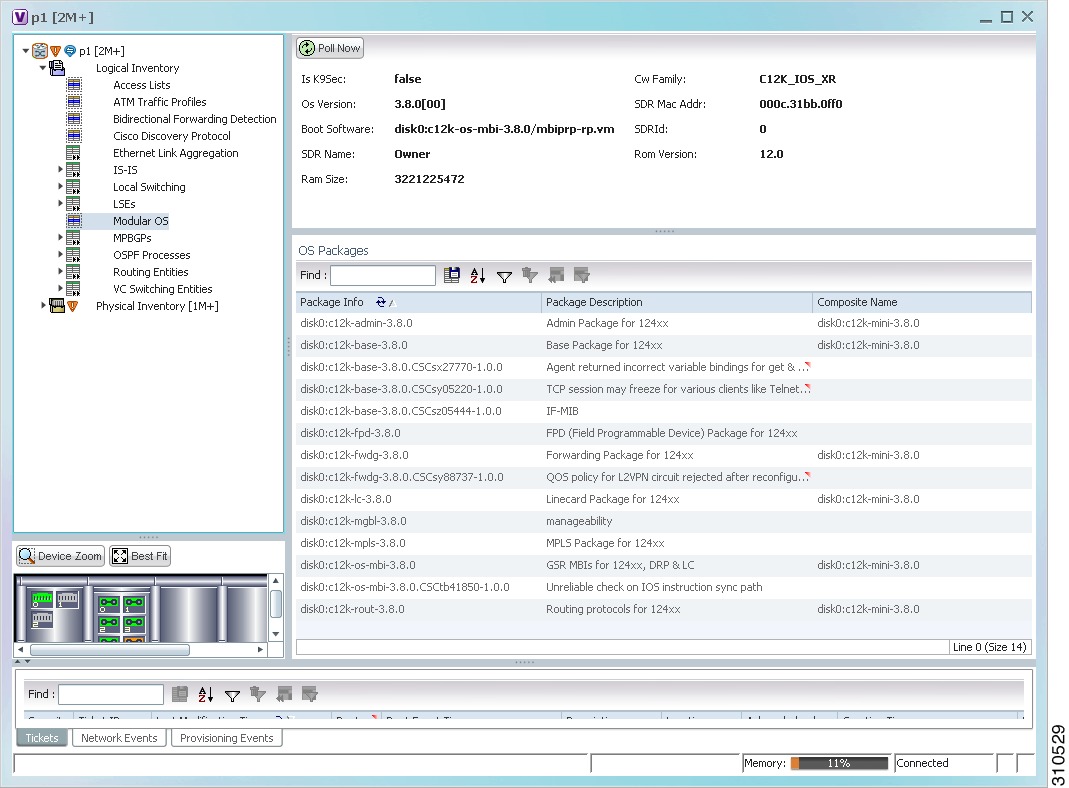
•
Figure 3-11 shows an example of the information that is displayed for Cisco IOS XR devices.
Figure 3-11 Modular OS Information in Logical Inventory
Table 3-16 describes the information that is displayed for Cisco IOS XR system.
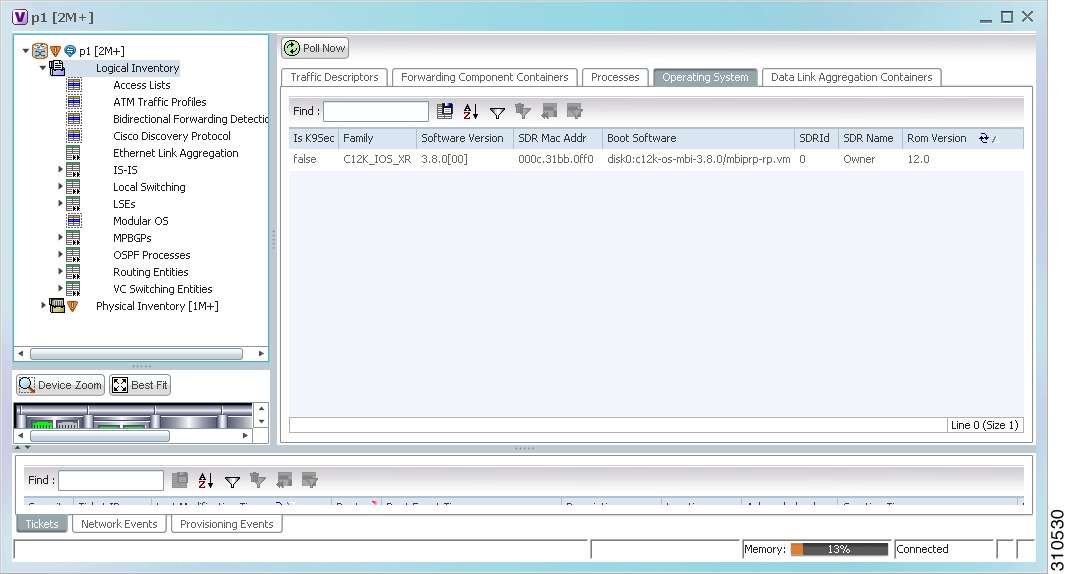
•
Figure 3-12 shows an example of the Operating System tab with information for a device with a modular operating system.
Figure 3-12 Modular OS Information in Operating System Tab
Table 3-17 describes the information that is displayed for modular operating systems in the Operating System tab.