Feedback
Table Of Contents
Viewing Directory/Watch Status
Working with Jobs in Timed Job Monitor
Pausing and Removing Timed Jobs
Working with the System Status Monitor
Working with the Health Status Monitor
Job Monitoring and Management
This section includes the following topics:
Job Status
This section includes the following topics:
•
Viewing Directory/Watch Status
Job Status Overview
View job status and perform tasks related to job status from with the Job Status Monitor. It displays all jobs that have not been reaped (deleted by the system).
To access the Job Status Monitor:
•
OR
•
See Figure 15-1.
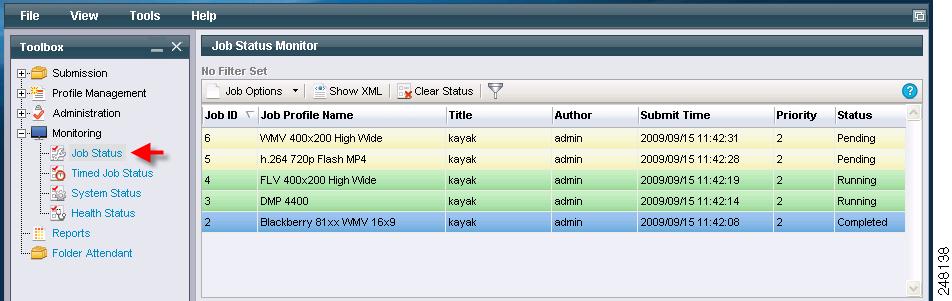
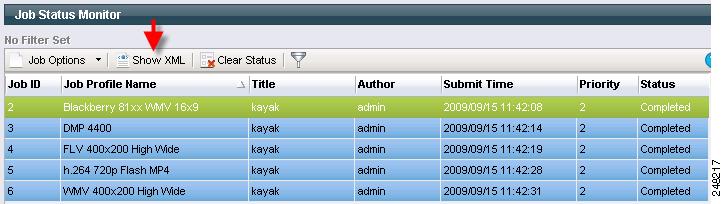
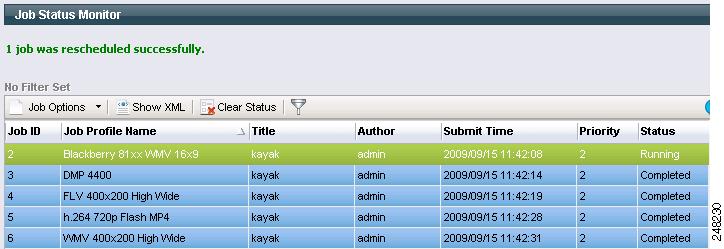
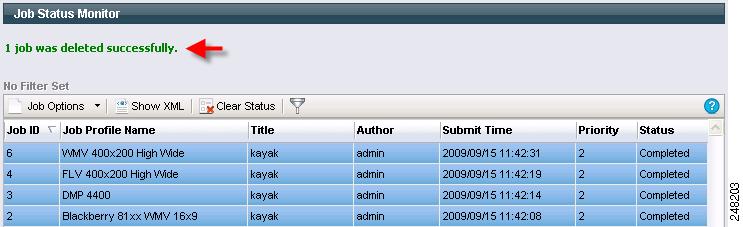
Figure 15-1 Job Status Monitor Upper Pane
The Job Status Monitor upper pane displays the jobs that are currently pending, running, complete, or failed. Jobs are color coded based on their status. See also: Monitoring Jobs.
The jobs displayed may disappear as you are viewing them because the system automatically removes (reaps) jobs based on the Auto Reap Interval. The Auto Reap Interval specifies how long job information displays on the Job Status Monitor before it is cleared from the Monitor. When the system reaps jobs, it removes data that has been processed and completed. The Auto Reap Interval begins from the time a job completes (or when it fails).
The upper pane of the Job Status Monitor provides job information as described in Table 15-1.
Note
If all jobs do not display, use the scroll bars to view the remaining jobs.
Job Options
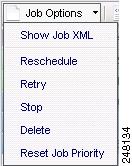
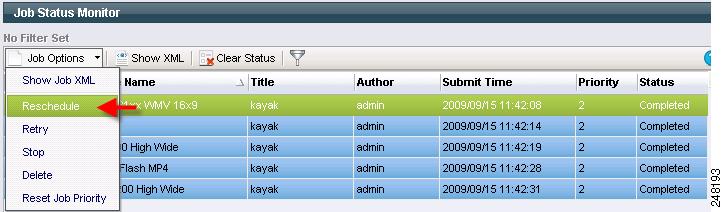
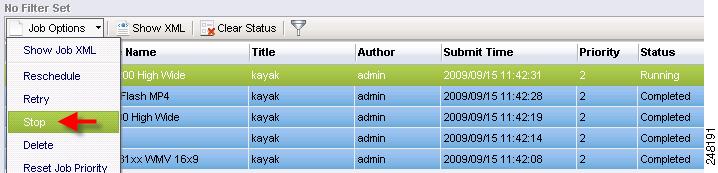
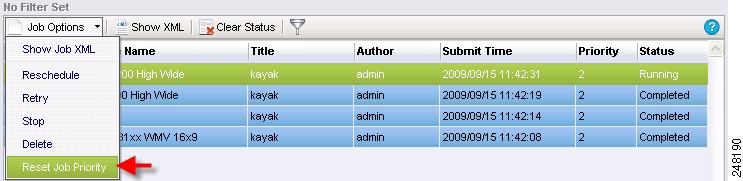
On the Job Status Monitor page, click the arrow to the right of the Job Options button to display the following. Most of the options are self-explanatory, except that Reschedule resubmits the entire job from scratch, and Retry resubmits failed or dependent tasks only. Retry is particularly useful, for example, when the encoding has completed but distribution fails. See Figure 15-2.
Figure 15-2 Job Options
See also: Monitoring Tasks.
Monitoring Jobs
Monitor the status of all jobs submitted in the Cisco MXE 3500 system from the Job Status Monitor page.
To access the page, from the Toolbox, expand Monitoring, and click Job Status.
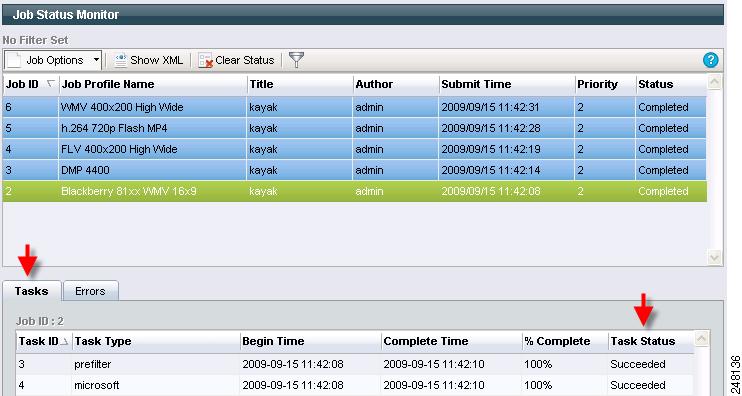
Each job contains multiple tasks. To view the tasks associated with a job and their status, double-click the job row in the upper pane (shown here in blue). The tasks display in the lower pane on the Tasks tab. See Figure 15-3.
Figure 15-3 Job Status Monitor Page
This page shows several jobs that are in progress or that have recently been completed. Jobs are color-coded based on the status described in Table 15-2.
Table 15-2 Job Status Color Coding
Pending
Yellow
The job has been submitted, but work has not yet begun.
Running
Green
The job has been submitted and work has begun. The job stays in Running status until all tasks in the Job Profile have been executed or until the job is determined to have failed.
Completed
Blue
All the tasks in the job profile have completed successfully.
Failed
Red
One or more tasks in the Job Profile could not be completed successfully. For example, if communication with an FTP service cannot be established, the job will fail because the distribution task cannot be completed successfully. Similarly, if you stop a job, it will fail with the following error message: user stop request.
If a job fails, select the Errors tab for a summary of errors that have occurred. (To obtain additional details on why jobs failed, contact your Cisco MXE 3500 administrator.) Take the necessary actions to correct any jobs that have failed, and resubmit or reschedule the job.
You may also view the XML code for a selected job for more detail on how it is being processed. See also: Showing Job XML.
Stopped
Orange
User stopped the job.
Tip
Monitoring Tasks
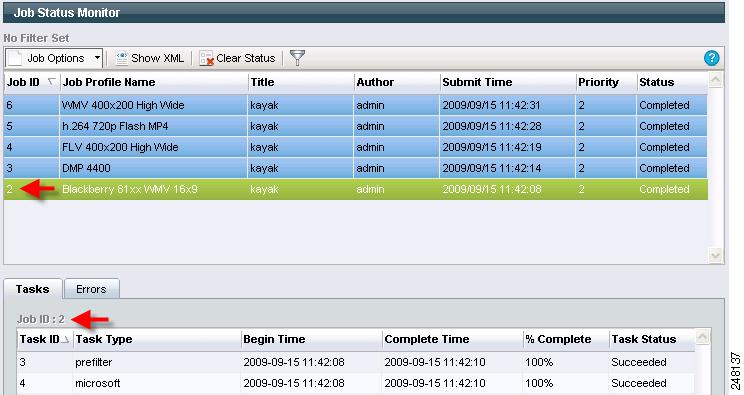
The lower pane of the Job Status Monitor displays job tasks or job errors, depending on which tab you select. Double-click a job in the upper pane to display its tasks or errors in the lower pane. See Figure 15-4.
Figure 15-4 Job Status Monitor Tasks
Each task within the job, and its status, are listed. Task fields are described in Table 15-3.
Table 15-3 Task Field
Task ID
Displays a unique numerical ID the Cisco MXE 3500 assigns to each task within the job.
Task Type
The task type represents the specific type of task that is executed by a given worker (examples: Preprocessor, Flash encoder, File Manager, etc.) on a specific node. The tasks are defined by the Job Profile selected for the job. See also: Job Profiles.
Begin Time
Displays the time when the task was started.
Complete Time
Displays the time when the task was completed.
% Complete
Displays the percentage of the task that is currently complete.
Note
Task Status
Displays the current status of the task.
Possible values are:
•
•
•
•
•
•
•
•
•
•
Viewing Errors
Click the Errors tab to view task error information as described in Table 15-4.
Error Types and Possible Solutions
There are many types of errors that might display, including the following:
•
•
•
•
See also: Troubleshooting Cisco MXE 3500.
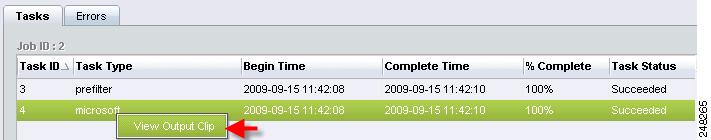
Viewing Output Clip
To view the output clip, from the Tasks menu, right-click a task, and click View Output Clip. See Figure 15-5.
Figure 15-5 Viewing Output Clip from Job Monitor Tasks Menu
Note
Viewing Directory/Watch Status
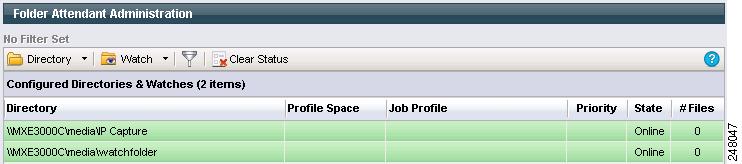
The Folder Attendant Administration page shows the directories and watches that have been defined. See Figure 15-6.
Figure 15-6 Configured Directories and Watches
If a directory has been defined, but a watch has not been defined for the directory, the Profile, State and # Files fields are blank for the directory. If a watch has been defined for the directory, those fields are populated.
Table 15-5 shows the field that are displayed.
You can also filter the directories that are displayed in this page to view only those directories of interest.
Showing Job XML
Job XML provides detailed instructions used by the Cisco MXE 3500 system to execute a job. If you encounter any job submission problems, the Cisco MXE 3500 Technical Support Team may request XML code (and log files) to assist them in troubleshooting the issues.
Procedure
Step 1
Step 2
Figure 15-7 Show Job XML
Step 3
Step 4
Step 5
Rescheduling Jobs
Rescheduling a job will re-queue it. If the job is currently running, all of its tasks are stopped, and then the job is rescheduled. If you reschedule a job that has failed, it will attempt to run again, as soon as it is able. When you reschedule jobs, you do not have the option of specifying an exact time when they will run.
If there was a network problem that prevented the job from running, you can reschedule the job after the network problem clears to attempt to process it successfully. However, if the job failed because of a problem with the profile, examine the Error tab on the Job Status Monitor page and the LCS log file, make the necessary changes, and then resubmit the job.
Procedure
Step 1
Step 2
Figure 15-8 Select Job to be Rescheduled
A message displays at the top of the page indicating that the job has been successfully rescheduled. See Figure 15-9.
Figure 15-9 Successful Reschedule Message
Step 3
Stopping Jobs
You may choose to stop a job for a number of reasons: You may have chosen the wrong profile, or the job may be taking too long to process and you want to stop it to free up resources for other more critical jobs.
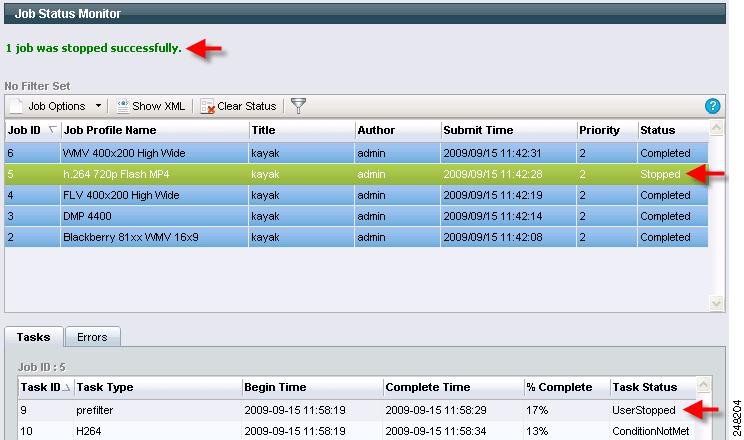
If you stop a job, the status of the job will change to Stopped.
Procedure
Step 1
Step 2
Figure 15-10 Select the Job(s) to Stop
Step 3
Step 4
Figure 15-11 Selected Jobs Have Been Stopped
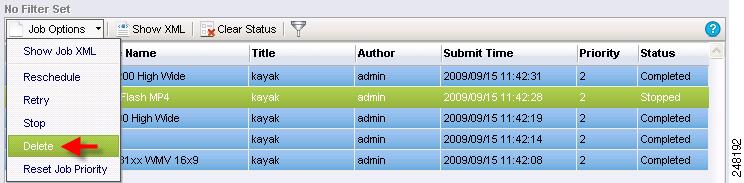
Deleting Jobs
When you delete a job, it no longer appears in the status monitor and cannot be stopped, rescheduled, or viewed. Any job (in any state) can be deleted.
Procedure
Step 1
Step 2
Figure 15-12 Select the Job to be Deleted
Step 3
Figure 15-13 Selected Job Has Been Deleted
Resetting Job Priority
Increase or decrease the priority of a job to change the order in which jobs are processed if multiple jobs are pending. Job priority can be set from 1-100 with 1 as highest priority and 100 as lowest priority.
Jobs with higher priority (a lower priority number) will be processed before jobs with lower priority.
Note
You can only set (or reset) job priority if you have a Resource Manager license.
Procedure
Step 1
Step 2
Figure 15-14 Select the Jobs for which Priority Will be Reset
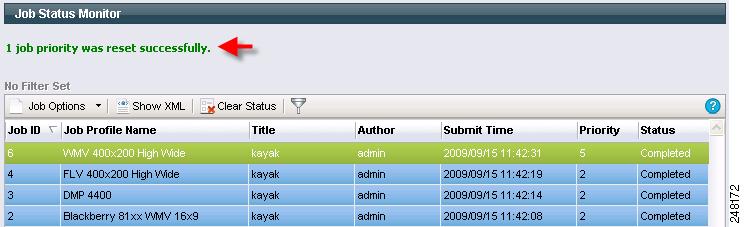
Step 3
Figure 15-15 Priority for the Selected Job Reset
Filtering Jobs
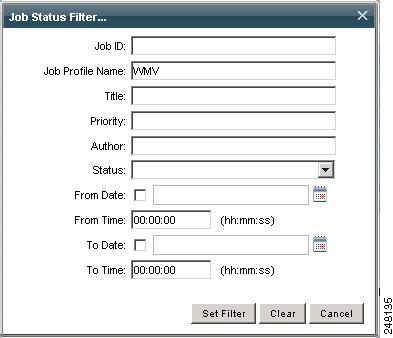
The Filter button on the Job Status Monitor page allows you to display a subset of all the jobs. Filter jobs using any of the following parameters (or any combination of these parameters):
•
•
•
•
•
•
•
Note
Procedure
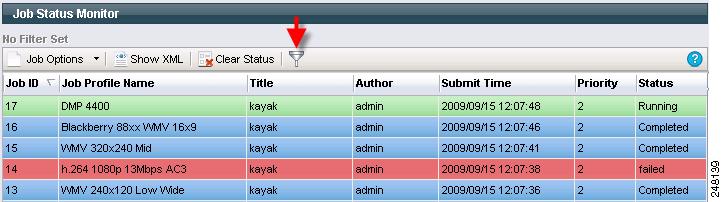
Step 1
Figure 15-16 Jobs Before Filters Have Been Applied
Step 2
Figure 15-17 Job Status Filter Pop-Up
Step 3
Step 4
Timed Job Status
This section includes the following topics:
•
•
Timed Job Status Overview
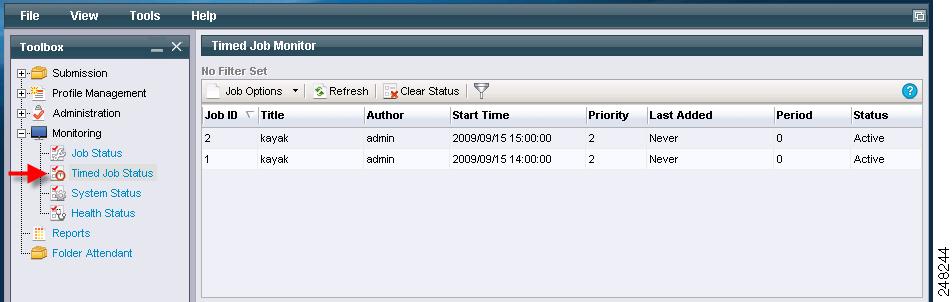
The Timed Job Status page is used to display summary information on timed jobs that are essentially on hold until their designated Start Time. Timed jobs are created by checking the Enable Timed Submission box on the Job Submission page. See Figure 15-18.
Figure 15-18 Timed Job Status Monitor
Working with Jobs in Timed Job Monitor
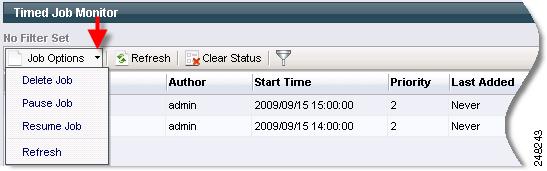
Figure 15-19 shows available Timed Job Monitor options. Table 15-8 describes the options.
Figure 15-19 Timed Job Monitor Job Options
Cancelling Future Timed Jobs
Procedure
Step 1
Step 2
Step 3
Pausing and Removing Timed Jobs
Procedure
Step 1
a.
b.
Step 2
a.
b.
System Status
This section includes the following topics:
•
System Status Overview
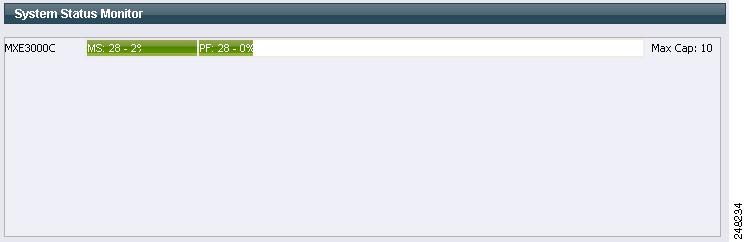
View information about system components currently involved in processing jobs with the System Status Monitor. This page displays one line of information for each host in the system. Each line contains bars that represent an encoder or other worker.
To access the System Status Monitor:
•
or
•
See Figure 15-20.
Figure 15-20 System Status Monitor
The name of the host is displayed in the first column, followed by bars which represent the tasks currently running on the host.
The colored bars for each task indicate the type of worker that is running, the Job ID, and the percentage of the task that is complete.
For example, the two colored bars below indicate:
•
•
If the status area extends beyond the visible area, use the horizontal scroll bar at the bottom of the page to view all tasks for the host.
The status area only shows tasks that are currently running. Once tasks are complete, they no longer display. Similarly, encoders and other workers for which you do not hold that license will not run, and therefore, will not appear on the System Status Monitor.
Note
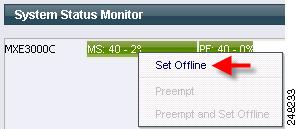
Working with the System Status Monitor
The System Status Monitor allows you to interact with running tasks. See Figure 15-21 shows the options. Table 15-9 describes the options.
Figure 15-21 System Status Monitor Right-click Options
Health Status
This section includes the following topics:
•
Health Status Overview
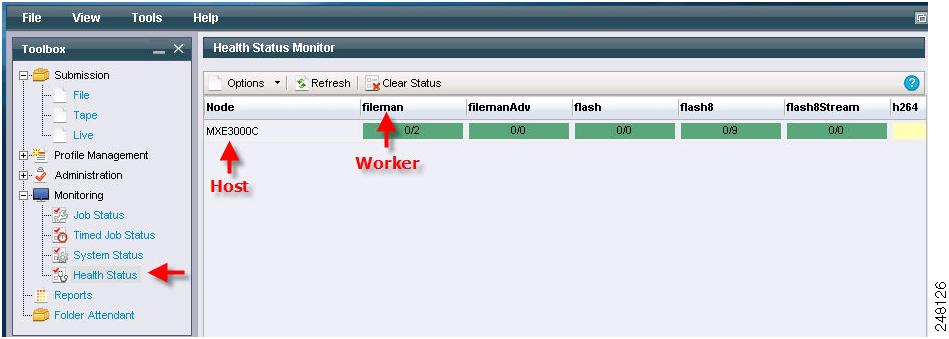
Each host configured to function as part of the Cisco MXE 3500 is assigned tasks depending on the workers configured for that Host. The Health Status Monitor allows you to track the performance of these workers over time. See Figure 15-22.
Figure 15-22 Health Status Monitor
Each row in the Health Status Monitor reflects workers run on a particular host. The Host is listed in the column at the far left, and each block in the row shows statistics on an individual worker. Information about each worker is displayed in the worker blocks in two ways:
Color
The color of the worker block indicates the general performance history, or health, of the worker on that particular host. Table 15-10 describes the job options.
Health Counter
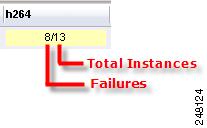
The values shown in the health counter reveal more detailed information about the performance of the worker. Where color gives a general reading of the health of the worker, the health counter reflects the exact number of times that the worker has failed to complete compared to the total number of times the worker has been run. The first number indicates the number of failures. The second number indicates the total number of times the worker has run since the last time the ECS was restarted. See Figure 15-23.
Figure 15-23 Health Counter
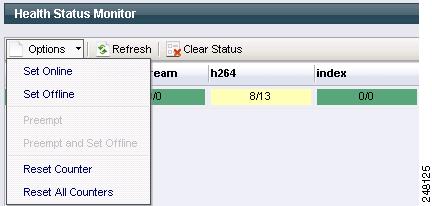
Working with the Health Status Monitor
The Options menu in the Health Status Monitor allows you to interact with workers. This menu can also be accessed by right-clicking any worker block in the list. See Figure 15-24. Table 15-11 describes the job options.
Figure 15-24 Health Status Monitor Options