-
Cisco IP Solution Center Traffic Engineering Management User Guide, 4.1
-
Document Type Definition (DTD) File
-
Index
-
About This Guide
-
Introduction
-
Setting Up the Service
-
TE Network Discovery
-
TE Resource Management
-
Basic Tunnel Management
-
Primary Tunnel Management
-
Protection Planning
-
Traffic Admission
-
Administration
-
Task Monitoring
-
TE Topology
-
Traffic Engineering Management GUI
-
Managing Service Requests
-
Warnings and Violations
-
 Feedback
Table Of Contents
Logs Created from Task Manager
From the Service Requests Window
Task Monitoring
All deployment and collection tasks are monitored and the details of the tasks are logged. The information can be viewed using the task monitoring pages.
This chapter includes the following sections:
–
Logs Created from Task Manager
TE Task Logs
The TE task logs are used to view the result of running one or more TE tasks as described in TE Tasks.
Different task logs are generated by different events:
•
•
–
–
–
SR Deployment Logs
When any service request is deployed, whether a managed or unmanaged primary tunnel or a backup tunnel, a log is generated. For tunnel SRs, deployment takes place in multiple phases depending on the type of SR and the task logs are created similarly:
•
•
In addition to the deployment logs, a ConfigAudit log is created regardless of the type of SR deployment, providing the deployment was successful.
Logs Created from Task Manager
Specific instructions for how to generate and view a task log for a TE Discovery task are found in Task Logs.
Instructions for how to generate and view a task log for the TE Functional Audit and TE Interface Performance tasks are found in Creating a TE Task.
Viewing a Task Log
A task log can be accessed from two different locations:
•
•
From the Tasks window
To view the task log for a TE task, you need to:
1.
2.
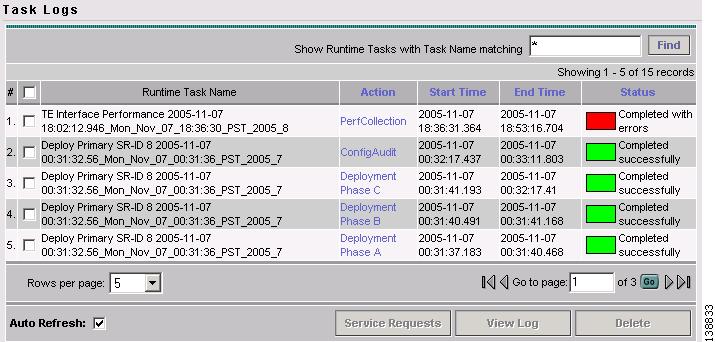
To view the task logs, use the following steps. A task log from the deployment of a managed primary tunnel has been used as an example.
Step 1
Step 2
Figure 10-1 Task Logs
For an explanation of the various window elements, see Task Log.
Step 3
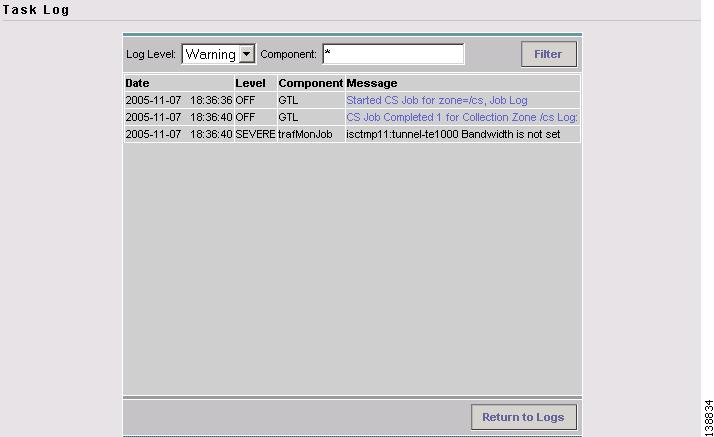
Click the desired task in the Action column. The corresponding Task Log window in Figure 10-2 appears.
Figure 10-2 Task Log - Performance Collection with Error
For an explanation of the various window elements, see Task Log.
The logged messages are shown in a table. This includes the time the log message was created and the severity level assigned to the log message.
There is a filter setting for the logging, which defaults to SEVERE. This means that only SEVERE messages in the log are shown. There are several different filter settings that can be selected according to the desired level of detail. To change the filter level, select the one that is required and click Filter.
How the log is structured depends on the type of task that was run.
Step 4
Step 5
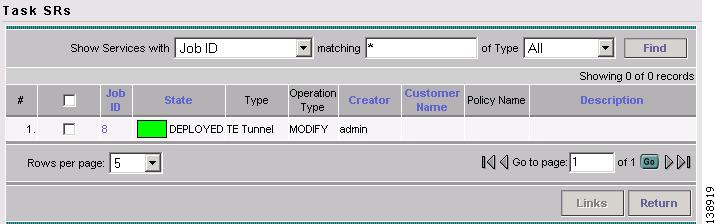
Figure 10-3 Task SRs
For an explanation of the various window elements, see Task Log.
From the Service Requests Window
To access the logs from the Service Requests window:
Step 1
Step 2
Step 3
Step 4
Step 5
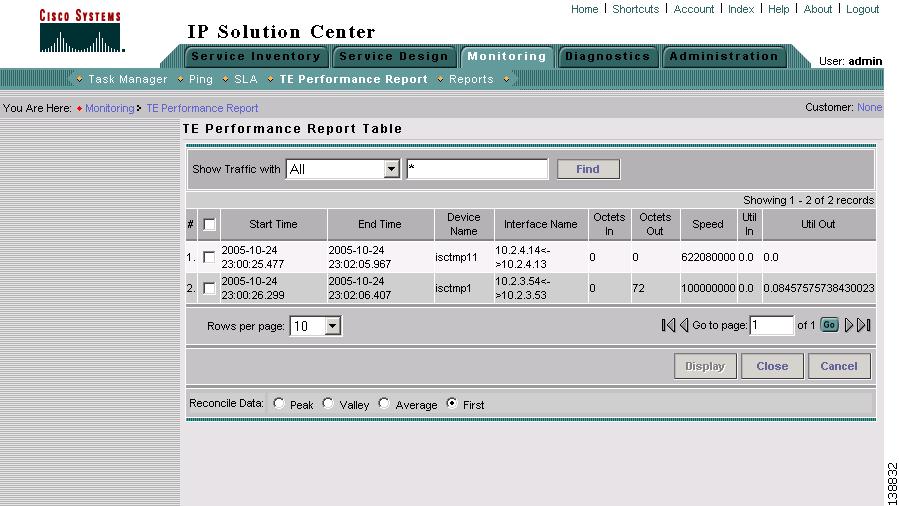
TE Performance Reports
A TE Performance Report is created when you run a TE Interface Performance task as described in Creating a TE Interface Performance Task.
It shows the traffic data collected from the TE Interface Performance task for selected tunnels and/or links. The TE Interface Performance task can run multiple times.
To view a TE Performance Report, use the following steps:
Step 1
The TE Performance Report Table in Figure 10-4 appears.
Figure 10-4 TE Performance Report Table
For an explanation of the various window elements in the report table, see TE Performance Reports.