-
Basic Dial NMS Implementation Guide
-
Preface
-
Overview of Basic SNMP Building Blocks
-
Network Design for a Dial NMS Case Study
-
Task 1--Enabling SNMP in a Cisco IOS Device
-
Task 2-- Exploring SNMP Capabilities by Using UCD-SNMP
-
Task 3--Using MRTG to Monitor and Graph Traffic Loads
-
Task 4--Using Syslog, NTP, and Modem Call Records to Troubleshoot Faults
-
Task 5--Setting Up a Web Portal for the Dial NMS
-
Task 6--Managing IP Addresses by Using DNS
-
Task 7--Using HP OpenView to Create the SNMP Framework
-
Task 8--Using CiscoWorks 2000 Resource Manager Essentials
-
Dial MIBs and OIDs Used in the Case Study
-
Index
-
 Feedback
Table Of Contents
Task 4—Using Syslog, NTP, and Modem Call Records to Isolate and Troubleshoot Faults
Enabling NTP on a Cisco IOS Device
Troubleshooting the NTP Client
Enabling Syslog and Modem Call Records in the Cisco IOS Software
Inspecting Syslog Messages in the Log File
Task 4—Using Syslog, NTP, and Modem Call Records to Isolate and Troubleshoot Faults
About Syslog
Syslog, Network Time Protocol (NTP), and modem call records work together to isolate and troubleshoot faults in a dial access network.
Syslog enables you to:
•
Centrally log and analyze configuration events and system error messages, such as router configuration changes, interface up and down status, modem events, security alerts, environmental conditions, trace backs, and CPU process overloads.
•
•
•
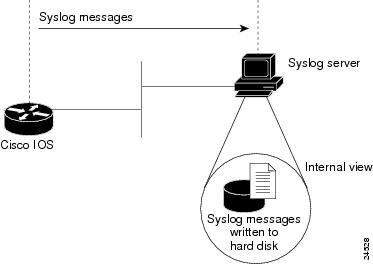
Figure 16
Cisco IOS Sending Syslog Messages to a Syslog Server
You can enable syslog in any Cisco IOS device and send syslog messages to many different destinations (host, buffer, console, history, and monitor).
By using the logging ? command, you can see the log settings for distinct destinations:
travis-nas-01(config)#logging ?Hostname or A.B.C.D IP address of the logging hostbuffered Set buffered logging parametersconsole Set console logging levelfacility Facility parameter for syslog messageshistory Configure syslog history tablemonitor Set terminal line (monitor) logging levelon Enable logging to all supported destinationsrate-limit Set messages per second limitsource-interface Specify interface for source address in loggingtransactionstrap Set syslog server logging levelThere are eight levels of syslog information in the Cisco IOS software. Monitor and manage logs according to the severity level of the syslog message. By using the logging trap ? command, you can see the logging severity levels:
travis-nas-01(config)#logging trap ?<0-7> Logging severity levelalerts Immediate action needed (severity=1)critical Critical conditions (severity=2)debugging Debugging messages (severity=7)emergencies System is unusable (severity=0)errors Error conditions (severity=3)informational Informational messages (severity=6)notifications Normal but significant conditions (severity=5)warnings Warning conditions (severity=4)<cr>
In this case study, syslog is enabled on all Cisco access servers and backbone routers. Each device sends syslog messages to the same log file on the same syslog server.
The terminology in the syslog messages can vary between different versions of Cisco IOS software. To effectively manage syslog messages, ensure that wherever possible, the same version of Cisco IOS software is running on all routers.
Note
About NTP
The Network Time Protocol (NTP):
•
•
•
–
–
–
Without precise time synchronization between all the various logging, debug output, management, and AAA functions in the network, you cannot make time comparisons.
For a list of NTP clients, go to http://www.eecis.udel.edu/~ntp/software.html
About Modem Call Records
A modem call record (MCR) is a type of syslog message that is:
•
•
–
–
–
–
In this case study, the engineers filter modem call records out of syslog and store them into flat files on a Unix host. The records are sorted by using cron jobs and perl scripts. A web-based MCR viewer facility is used to:
•
•
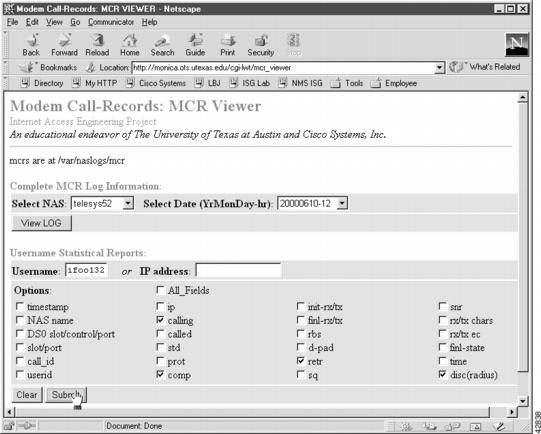
Figure 17
Web-Based MCR Viewer
You can view entire log files or portions of logs in the MCR viewer. In addition, you can parse for specific users and other call attributes for a modem call (for example, modulation, error correction, compression, disconnect causes, and retrains).
Note
Releases 11.3AA and 12.0T.
Enabling NTP on a Cisco IOS Device
To enable NTP and related clocking services, follow these steps.
Step 1
!service timestamps debug datetime msec localtime show-timezoneservice timestamps log datetime msec localtime show-timezone!Step 2
!clock timezone CST -6clock summer-time CST recurring!Step 3
Step 4
!ntp update-calendarntp server 172.22.255.1!
Note
Step 5
travis-nas-01>show ntp statusClock is synchronized, stratum 9, reference is 172.22.255.1nominal freq is 250.0000 Hz, actual freq is 249.9987 Hz, precision is 2**24reference time is BD123336.28CCF0C4 (18:09:42.159 CST Sat Jul 8 2000)clock offset is 0.1183 msec, root delay is 61.84 msecroot dispersion is 0.93 msec, peer dispersion is 0.79 msectravis-nas-01>Inspect the status and time association. Clock sources are identified by their stratum levels. The previous display shows a stratum level nine clock.
Note
Step 6
travis-nas-01>show ntp associationaddress ref clock st when poll reach delay offset disp*~172.22.255.1 127.127.7.1 8 984 1024 377 60.3 -0.89 0.8* master (synced), # master (unsynced), + selected, - candidate, ~ configuredtravis-nas-01>
The tilde (~) next to the IP address of the NTP server means the NTP service is configured. The asterisk (*) indicates successful synchronization with the master clock.
Setting Up an NTP Client
To set up an NTP client on a Solaris v2.6 workstation, follow these steps.
Note
Step 1
Note
Step 2
onionring:~$ cd /etc/inetonionring:/etc/inet$ more ntp.client# @(#)ntp.client 1.2 96/11/06 SMI## /etc/inet/ntp.client## An example file that could be copied over to /etc/inet/ntp.conf; it# provides a configuration for a host that passively waits for a server# to provide NTP packets on the ntp multicast net.#multicastclient 224.0.1.1Step 3
onionring:/etc/inet$ cp ntp.client ntp.confonionring:/etc/inet$The NTP daemon reads ntp.conf at startup to locate the NTP server.
Note
Step 4
# @(#)ntp.client 1.2 96/11/06 SMI## /etc/inet/ntp.client## An example file that could be copied over to /etc/inet/ntp.conf; it# provides a configuration for a host that passively waits for a server# to provide NTP packets on the ntp multicast net.#server 172.22.255.1Step 5
onionring:/etc/inet$ cd /usr/lib/inet/onionring:/usr/lib/inet$ lsin.dhcpd xntpdonionring:/usr/lib/inet$ xntpdonionring:/usr/lib/inet$Step 6
onionring:/usr/lib/inet$ ntpq -premote refid st t when poll reach delay offset disp==============================================================================*maui-rtr-01.mau CHU(1) 8 u 49 64 377 1.08 -0.131 0.08onionring:/usr/lib/inet$The following information appears:
•
•
•
•
•
•
•
•
•
When the daemon starts, most of the time values will be zeros until there is a sufficient number of queries taken by the daemon to determine the correct offset.
Troubleshooting the NTP Client
Enabling Syslog and Modem Call Records in the Cisco IOS Software
To enable syslog messages in the Cisco IOS software and send them to a syslog server,
follow these steps:
Step 1
travis-nas-01#show loggingSyslog logging: enabled (0 messages dropped, 0 flushes, 0 overruns)Console logging: level debugging, 42 messages loggedMonitor logging: level debugging, 93 messages loggedBuffer logging: level debugging, 3 messages loggedTrap logging: level informational, 121 message lines loggedLog Buffer (8192 bytes):travis-nas-01#Step 2
!logging buffered 10000 debuggingno logging console guaranteedlogging console informational!!logging trap debugginglogging facility local0logging 172.21.100.100!
Table 20 Logging Command Descriptions
Sets the internal log buffer to 10000 bytes for debug output. New messages overwrite old messages.
You can tune buffered-logging parameters for collecting logs on a NAS when you are at a remote location. For example, turn on debugs and start logging them in the history buffer. Make your test call; then, re-connect in shell mode and inspect the debugs.
Sends the most urgent informational logs to the console port in the event the IP network or syslog server fails. Alternatively, send messages to the console by using the commands logging console errors or logging console warnings.
Caution
Enables logging up to the debug level (all eight levels).
Specifies the IP address of the syslog server.
Assigns a logging-facility tag (local0) to the syslog messages for this device. The tag must match the facility number configured in the syslog.conf file on the Unix host. See Step 1 in "Configuring the Syslog Daemon" section.
In this case study, each device sends syslog messages to the same log file on the same syslog server.
Step 3
!modem call-record terse!A modem call record, which is a syslog message, looks like this:
May 26 22:04:23.346 CST: %CALLRECORD-3-MICA_TERSE_CALL_REC: DS0 slot/contr/chan=0/0/0, slot/port=2/14, call_id=26, userid=(n/a), ip=0.0.0.0, calling=4082322078,called=3241933, std=V.34+, prot=LAP-M, comp=V.42bis both, init-rx/tx b-rate=26400/24000, finl-rx/tx b-rate=28800/24000, rbs=0, d-pad=None, retr=1, sq=4, snr=27, rx/tx chars=136/6470, bad=2, rx/tx ec=134/184, bad=0, time=594, finl-state=Steady, disc(radius)=(n/a)/(n/a), disc(modem)=DF03 Tx (host to line) data flushing- OK/Requested by host/DTR droppedStep 4
!
interface Serial1/0/0:4:23no logging event link-statusno snmp trap link-status!interface Group-Async0no logging event link-statusno snmp trap link-status!In this example, only the fourth T1 of a T3 card is shown.
Note
Configuring the Syslog Daemon
In this case study, all the syslog messages from the access servers are sent to a single log file. The syslog messages from the backbone routers are sent to a different log file.
To configure the syslog daemon on a Solaris syslog server, follow these steps:
Step 1
|local0.debug /var/log/router.log|•
•
•
In the following example, the new line is in bold:
"syslog.conf" 53 lines, 1861 characters#ident "@(#)syslog.conf 1.3 93/12/09 SMI" /* SunOS 5.0 */## Copyright (c) 1991-1993, by Sun Microsystems, Inc.## syslog configuration file.## This file is processed by m4 so be careful to quote (`') names# that match m4 reserved words. Also, within ifdef's, arguments# containing commas must be quoted.#####Following is the new line. It adds a logging facility number and direcory path for the #log file (router.log).local0.debug /var/log/router.log
Note
Step 2
aurora:/etc ->touch /var/log/router.logaurora:/etc ->ls -l /var/log/router.log-rw-r--r-- 1 root other 27110 Jul 8 19:56 /var/log/router.logaurora:/etc ->Step 3
aurora:/etc ->ps -elf | grep syslog8 S root 169 1 0 41 20 60756cc8 187 604e3156 Jun 19 ? daurora:/etc ->Step 4
aurora:/etc ->rc2.d/S74syslog stopStopping the syslog service.aurora:/etc ->rc2.d/S74syslog startsyslog service starting.aurora:/etc ->ps -elf | grep syslog8 S root 4405 1 0 44 20 6042d320 187 604e3156 09:16:35 ? daurora:/etc ->Confirm that a new syslog process ID was assigned (for example, 4405) after the start/stop process.
Note
Inspecting Syslog Messages in the Log File
To inspect syslog messages by using Cisco IOS commands, Unix commands, FTP, and a web browser, follow these steps:
Step 1
travis-nas-01#configure terminalEnter configuration commands, one per line. End with CNTL/Z.travis-nas-01(config)#^Ztravis-nas-01#configure terminalEnter configuration commands, one per line. End with CNTL/Z.travis-nas-01(config)#^Ztravis-nas-01#Step 2
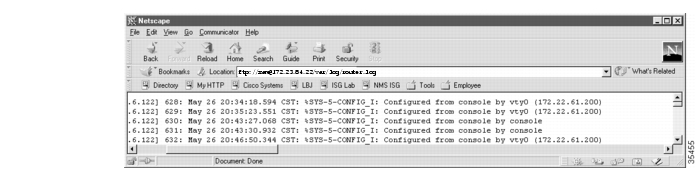
aurora:/etc ->tail -f /var/log/router.logMay 26 17:43:12 [172.21.101.20.6.122] 629: May 26 20:35:23.551 CST: %SYS-5-CONFIG_I: Configured from console by vty0 (172.22.61.200)May 26 17:51:15 [172.21.101.20.6.122] 630: May 26 20:43:27.068 CST: %SYS-5-CONFIG_I: Configured from console by consoleMay 26 17:51:19 [172.21.101.20.6.122] 631: May 26 20:43:30.932 CST: %SYS-5-CONFIG_I: Configured from console by consoleMay 26 17:54:38 [172.21.101.20.6.122] 632: May 26 20:46:50.344 CST: %SYS-5-CONFIG_I: Configured from console by vty0 (172.22.61.200)^Caurora:/etc ->Step 3
Figure 18 Syslog Messages that Appear by
Using FTP and a Web Browser
Table 21 shows the generic URL syntax to use. Be sure to replace the variables with your own information. The FTP server automatically prompts you for a login password.