-
Basic Dial NMS Implementation Guide
-
Preface
-
Overview of Basic SNMP Building Blocks
-
Network Design for a Dial NMS Case Study
-
Task 1--Enabling SNMP in a Cisco IOS Device
-
Task 2-- Exploring SNMP Capabilities by Using UCD-SNMP
-
Task 3--Using MRTG to Monitor and Graph Traffic Loads
-
Task 4--Using Syslog, NTP, and Modem Call Records to Troubleshoot Faults
-
Task 5--Setting Up a Web Portal for the Dial NMS
-
Task 6--Managing IP Addresses by Using DNS
-
Task 7--Using HP OpenView to Create the SNMP Framework
-
Task 8--Using CiscoWorks 2000 Resource Manager Essentials
-
Dial MIBs and OIDs Used in the Case Study
-
Index
-
 Feedback
Table Of Contents
Task 3—Using MRTG to Monitor and Graph Traffic Loads
How to Inspect and Interpret Data
Creating and Editing a Configuration File
Sending MRTG Graphs to a Web Server
Task 3—Using MRTG to Monitor and Graph Traffic Loads
About MRTG
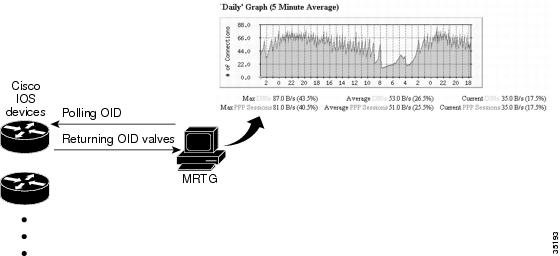
Multi Router Traffic Grapher (MRTG) is a free performance management application for Unix; it monitors SNMP statistics from any SNMP-capable device on your network and:
•
Captures, stores, and graphically presents SNMP data. By default, a web page with four graphs per MIB object (OID) is created by MRTG. The graphs show the variation of MIB data over time.
•
•
•
•
Figure 10
MRTG Polls for OIDs; OID Values that Are Returned to MRTG
For each OID referenced in the configuration file, MRTG creates the following graphs:
•
•
•
•
To quickly create images by using the GD graphics library, go to http://www.boutell.com/gd
About Selecting Dial OIDs
To select which dial OIDs to query when monitoring dial-up activity, see the OIDs listed in the following tables:
•
•
•
Caution
In this case study, the tools UCD-SNMP and SNMP Commander were used to inspect and understand the MIBs. Based on this research, the network engineers at THEnet identified the OIDs in the following tables to program in to MRTG.
To see the complete structure of the CISCO-POP-MGMT-MIB and CISCO-MODEM-MGMT-MIB, See the Appendix at the end of this document. For further MIB information, refer to the following links:
•
http://www.cisco.com/public/sw-center/netmgmt/cmtk/mibs.shtml.•
http://www.cisco.com/public/sw-center/netmgmt/cmtk/mibs.shtml.
How to Inspect and Interpret Data
Internet users spend approximately 80 percent of their time reading information—not downloading data. Modem traffic is very limited on a per user basis. People cannot read as fast as modems can download. Therefore, watch for the following types of trends and performance data on the access servers:
•
•
•
•
•
•
•
•
•
The Connection Success Rate (CSR) is an important metric for tracking and measuring the stability of a dial service. The CSR is defined by the number of modems that successfully train up and go in to connected state. In addition to the CSR, you must track and analyze additional areas. For example, SNMP MIBs can be used to measure the success rate for items such as PPP, AAA, and IP negotiation.
To collect the CSR service level counters, inspect the connection success and failure rate by using modem OIDs or the show modem Cisco IOS command. SNMP, rather than the Cisco IOS CLI, is the preferred method to collect these counters. SNMP can scale to support large numbers of access servers.
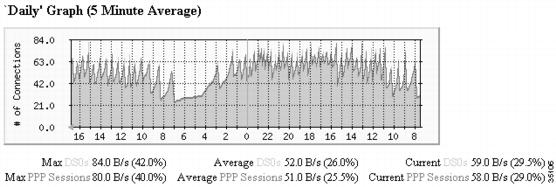
The following graphs show the DS0s and PPP sessions in use for 70,000 modem users calling in to a dial-up service at a large university. The graphs are taken from one Cisco AS5300 in a large dial-up modem pool.
Figure 11
Daily Graph: DS0s and PPP Sessions in Use
The jagged saw-tooth pattern at the top of the graph indicates a telephone-switch hunt group for the dial lines passing by the access servers. A "jump up" occurs each time the hunt group passes by a different T1 line. For a hunt group that rotates in a round-robin fashion, a jagged saw-tooth pattern is normal.
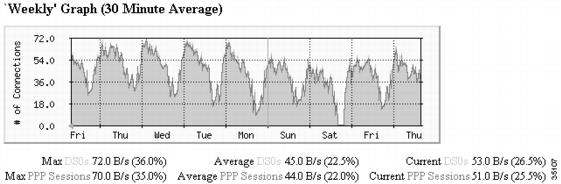
Figure 12
Weekly Graph: DS0s and PPP Sessions in Use
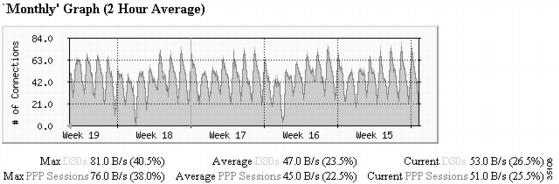
Figure 13
Monthly Graph: DS0s and PPP Sessions in Use
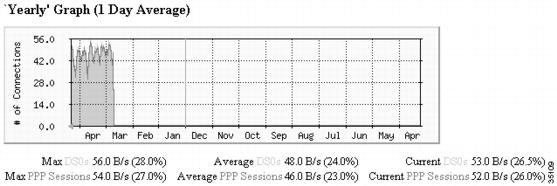
MRTG efficiently compresses and archives data to create graphs. For example, you can keep information for an entire year on a server without using much disk space.
Figure 14
Yearly Graph: DS0s and PPP Sessions in Use
The following is configuration file used to create these graphs. Note the numeric OIDs in the configuration file.
WorkDir: /opt/mrtg-2.8.8/outputOptions[_]: bits####################################################################### Description: Cisco Internetwork Operating System Software <BR>IOS (tm) 5300 Software (C5300-JS-M), Version 11.3(6)T1, RELEASE SOFTWARE (fc1) <BR>Copyright (c) 1986-1998 by Cisco Systems, Inc.<BR>Compiled Fri 16-Oct-98 03:37 by ccai# Contact: coe-iae@cisco.com# System Name: Travis53# Location:#---------------------------------------------------------------#This is the configuration for the Fast Ethernet port#Target[travis-as5800-01.the.net]: 2:public@travis-as5800-01.the.netMaxBytes[travis-as5800-01.the.net]: 12500000Title[travis-as5800-01.the.net]: Travis53 (travis-as5800-01.the.net): FastEthernet0PageTop[travis-as5800-01.the.net]: <H1>Traffic Analysis for FastEthernet0 </H1><TABLE><TR><TD>System:</TD><TD>Travis53 </TD></TR><TR><TD>Maintainer:</TD><TD></TD></TR><TR><TD>Interface:</TD><TD>FastEthernet0 (2)</TD></TR><TR><TD>IP:</TD><TD>travis-as5800-01.the.net (209.165.202.128)</TD></TR><TR><TD>Max Speed:</TD><TD>12.5 MBytes/s (ethernetCsmacd)</TD></TR></TABLE>#---------------------------------------------------------------#This is the configuration to get DSOs and PPP Sessons#Target[travis53_active_connections]:1.3.6.1.4.1.9.10.19.1.1.4.0&1.3.6.1.4.1.9.10.19.1.1.5 .0:public@travis-as5800-01.the.netMaxbytes[travis53_active_connections]: 200Ylegend[travis53_active_connections]: # of ConnectionsLegendI[travis53_active_connections]: DS0sLegendO[travis53_active_connections]: PPP SessionsTitle[travis53_active_connections]: DS0s and PPP sessions in UsePageTop[travis53_active_connections]: <H1>DS0s and PPP sessions in Use</H1><TABLE><TR><TD>System:</TD><TD>Travis53</TD></TR><TR><TD>MRTG by coe-iae@cisco.com</TD><TD></TD></TR><TR><TD>DS0s and PPP sessions in Use</TD><TD></TD></TR></TABLE>Options[travis53_active_connections]: gauge#----------------------------------------------------------------# Monitoring Modem calls_rejected and Modem calls_rejected_for_no_modem#----------------------------------------------------------Target[travis53_calls_rejected]:1.3.6.1.4.1.9.10.19.1.2.2.0&1.3.6.1.4.1.9.10.19.1.2.6.0:p ublic@travis-as5800-01.the.netMaxbytes[travis53_calls_rejected]:2000Ylegend[travis53_calls_rejected]: # Modem callsLegendI[travis53_calls_rejected]:RejectedLegendO[travis53_calls_rejected]:Rejected for no modemTitle[travis53_calls_rejected]:Number of modem calls rejected and rejected_for_no_modemPageTop[travis53_calls_rejected]: <H1>Number of modem calls calls_rejected and rejected_for_no_modem</H1><TABLE><TR><TD>System:</TD><TD>Travis53</TD></TR><TR><TD>MRTG by coe-iae@cisco.com</TD><TD></TD></TR><TR><TD>Number of modem calls calls_rejected and calls_rejected_for_no_modem</TD><TD></TD></TR></TABLE>Creating and Editing a Configuration File
Because dial interfaces normally go up and down as calls connect and disconnect, monitor counters such as:
•
•
•
Depending on how the dial interfaces are used on a access server, different types of counters may not be valuable to monitor, such as byte-packet counters on the interfaces in Table 17.
To enable MRTG to locate a device and poll it for network statistics, follow these steps:
Step 1
Step 2
•
•
Step 3
There are two basic ways to create the file:
•
or
•
Generic command syntax:
./cfgmaker communitystring@hostname-or-ipaddress >> outputfilename.cfgExample:
./cfgmaker 5urf5h0p@travis-nas-01 >> travis-nas-01.cfgIn the previous example:
5urf5h0p is the SNMP community string.
travis-nas-01 is the hostname of the managed device.
travis-nas-01.cfg is the configuration file that MRTG reads each time it starts up.
Note
Step 4
The following configuration file is from a Cisco AS5300. This file can be used as a configuration template for your environment, but use your own community string, work directory, and device name.
The following definitions are used in the example:
•
•
•
WorkDir: /export/home/www/mrtg/travis-nas-01/dial# set defaultsOptions[_]: growright# make legends reflect these are call countersYLegend[_]: Active CallsShortLegend[_]: callsLegendI[_]: calls:LegendO[_]: calls:#######################################################################---------------------------------------------------------------------------------------- ------# purpose: DS0s and PPP Sessions.#---------------------------------------------------------------------------------------- ------Target[travis-nas-01_DS0PPP]: 1.3.6.1.4.1.9.10.19.1.1.4.0&1.3.6.1.4.1.9.10.19.1.1.5.0:5urf5h0p@travis-nas-01MaxBytes1[travis-nas-01_DS0PPP]: 200MaxBytes2[travis-nas-01_DS0PPP]: 200Title[travis-nas-01_DS0PPP]: DS0s and PPP sessions in UsePageTop[travis-nas-01_DS0PPP]: <H2>DS0s and PPP sessions in Use</H2><TABLE><TR><TD>Device:</TD><TD>travis-nas-01</TD></TR><TR><TD><a href="/mrtg/mrtg.html">HOME</a></TD></TR></TABLE>Options[travis-nas-01_DS0PPP]: gauge#---------------------------------------------------------------------------------------# purpose: DS0s and Analog#---------------------------------------------------------------------------------------Target[travis-nas-01_DS0ANALOG]: 1.3.6.1.4.1.9.10.19.1.1.4.0&1.3.6.1.4.1.9.10.19.1.1.2.0:5urf5h0p@travis-nas-01MaxBytes1[travis-nas-01_DS0ANALOG]: 200MaxBytes2[travis-nas-01_DS0ANALOG]: 200Title[travis-nas-01_DS0ANALOG]: DS0s and Analog in UsePageTop[travis-nas-01_DS0ANALOG]: <H2>DS0s and Analog in Use</H2><TABLE><TR><TD>Device:</TD><TD>travis-nas-01</TD></TR><TR><TD><a href="/mrtg/mrtg.html">HOME</a></TD></TR></TABLE>Options[travis-nas-01_DS0ANALOG]: gauge#---------------------------------------------------------------------------------------- ------# purpose: DS0s and SerialX:Y#---------------------------------------------------------------------------------------- ------Target[travis-nas-01_DS0SERIAL]: 1.3.6.1.4.1.9.10.19.1.1.4.0&1.3.6.1.4.1.9.10.19.1.1.3.0:5urf5h0p@travis-nas-01MaxBytes1[travis-nas-01_DS0SERIAL]: 200MaxBytes2[travis-nas-01_DS0SERIAL]: 200Title[travis-nas-01_DS0SERIAL]: DS0s and SerialX:Y in UsePageTop[travis-nas-01_DS0SERIAL]: <H2>DS0s and SerialX:Y in Use</H2><TABLE><TR><TD>Device:</TD><TD>travis-nas-01</TD></TR><TR><TD><a href="/mrtg/mrtg.html">HOME</a></TD></TR></TABLE>Options[travis-nas-01_DS0SERIAL]: gauge#---------------------------------------------------------------------------------------- ------# purpose: DS0s and Sw56#---------------------------------------------------------------------------------------- ------Target[travis-nas-01_DS0Sw56]: 1.3.6.1.4.1.9.10.19.1.1.4.0&1.3.6.1.4.1.9.10.19.1.1.10.0:5urf5h0p@travis-nas-01MaxBytes1[travis-nas-01_DS0Sw56]: 200MaxBytes2[travis-nas-01_DS0Sw56]: 200Title[travis-nas-01_DS0Sw56]: DS0s and Sw56 in UsePageTop[travis-nas-01_DS0Sw56]: <H2>DS0s and Sw56 in Use</H2><TABLE><TR><TD>Device:</TD><TD>travis-nas-01</TD></TR><TR><TD><a href="/mrtg/mrtg.html">HOME</a></TD></TR></TABLE>Options[travis-nas-01_DS0Sw56]: gauge#---------------------------------------------------------------------------------------- ------# purpose: cpmISDNCallsRejected and cpmModemCallsRejected#---------------------------------------------------------------------------------------- ------Target[travis-nas-01_callrejects]: 1.3.6.1.4.1.9.10.19.1.2.1.0&1.3.6.1.4.1.9.10.19.1.2.2.0:5urf5h0p@travis-nas-01MaxBytes1[travis-nas-01_callrejects]: 200MaxBytes2[travis-nas-01_callrejects]: 200Title[travis-nas-01_callrejects]: travis-nas-01 cpmISDNCallsRejected and cpmModemCallsRejectedPageTop[travis-nas-01_callrejects]: <H2>cpmISDNCallsRejected and cpmModemCallsRejected</H2><TABLE><TR><TD>Device:</TD><TD>travis-nas-01</TD></TR><TR><TD><a href="/mrtg/mrtg.html">HOME</a></TD></TR></TABLE>#---------------------------------------------------------------------------------------- ------# purpose: cpmISDNCallsClearedAbnormally and cpmModemCallsClearedAbnormally#---------------------------------------------------------------------------------------- ------Target[travis-nas-01_clearAbnormal]: 1.3.6.1.4.1.9.10.19.1.2.3.0&1.3.6.1.4.1.9.10.19.1.2.4.0:5urf5h0p@travis-nas-01MaxBytes1[travis-nas-01_clearAbnormal]: 200MaxBytes2[travis-nas-01_clearAbnormal]: 200Title[travis-nas-01_clearAbnormal]: travis-nas-01 cpmISDNCallsClearedAbnormally and cpmModemCallsClearedAbnormallyPageTop[travis-nas-01_clearAbnormal]: <H2>cpmISDNCallsClearedAbnormally and cpmModemCallsClearedAbnormally</H2><TABLE><TR><TD>Device:</TD><TD>travis-nas-01</TD></TR><TR><TD><a href="/mrtg/mrtg.html">HOME</a></TD></TR></TABLE>#---------------------------------------------------------------------------------------- ------# purpose: cpmISDNNoResource and cpmModemNoResource#---------------------------------------------------------------------------------------- ------Target[travis-nas-01_callNoResource]: 1.3.6.1.4.1.9.10.19.1.2.5.0&1.3.6.1.4.1.9.10.19.1.2.6.0:5urf5h0p@travis-nas-01MaxBytes1[travis-nas-01_callNoResource]: 200MaxBytes2[travis-nas-01_callNoResource]: 200Title[travis-nas-01_callNoResource]: travis-nas-01 cpmISDNNoResource and cpmModemNoResourcePageTop[travis-nas-01_callNoResource]: <H2>cpmISDNNoResource and cpmModemNoResource</H2><TABLE><TR><TD>Device:</TD><TD>travis-nas-01</TD></TR><TR><TD><a href="/mrtg/mrtg.html">HOME</a></TD></TR></TABLE>#---------------------------------------------------------------------------------------- ------# purpose: cmSystemModemsInUse and cmSystemModemsAvailable#---------------------------------------------------------------------------------------- ------Target[travis-nas-01_modemcount]: 1.3.6.1.4.1.9.9.47.1.1.6.0&1.3.6.1.4.1.9.9.47.1.1.7.0:5urf5h0p@travis-nas-01MaxBytes1[travis-nas-01_modemcount]: 200MaxBytes2[travis-nas-01_modemcount]: 200Title[travis-nas-01_modemcount]: cmSystemModemsInUse and cmSystemModemsAvailablePageTop[travis-nas-01_modemcount]: <H2>cmSystemModemsInUse and cmSystemModemsAvailable</H2><TABLE><TR><TD>Device:</TD><TD>travis-nas-01</TD></TR><TR><TD><a href="/mrtg/mrtg.html">HOME</a></TD></TR></TABLE>Options[travis-nas-01_modemcount]: gauge#---------------------------------------------------------------------------------------- ------# purpose: cvpdnTunnelTotal and cvpdnDeniedUsersTotal#---------------------------------------------------------------------------------------- ------Target[travis-nas-01_vpdn_tunnelanddenied]: 1.3.6.1.4.1.9.10.24.1.1.1.0&1.3.6.1.4.1.9.10.24.1.1.3.0:5urf5h0p@travis-nas-01MaxBytes1[travis-nas-01_vpdn_tunnelanddenied]: 200MaxBytes2[travis-nas-01_vpdn_tunnelanddenied]: 200Title[travis-nas-01_vpdn_tunnelanddenied]: cvpdnTunnelTotal and cvpdnDeniedUsersTotalPageTop[travis-nas-01_vpdn_tunnelanddenied]: <H2>cvpdnTunnelTotal and cvpdnDeniedUsersTotal</H2><TABLE><TR><TD>Device:</TD><TD>travis-nas-01</TD></TR><TR><TD><a href="/mrtg/mrtg.html">HOME</a></TD></TR></TABLE>Options[travis-nas-01_vpdn_tunnelanddenied]: gauge#---------------------------------------------------------------------------------------- ------# purpose: activeDS0s and cvpdnSessionTotal#---------------------------------------------------------------------------------------- ------Target[travis-nas-01_activeDS0vpdnSession]: 1.3.6.1.4.1.9.10.19.1.1.4.0&1.3.6.1.4.1.9.10.24.1.1.2.0:5urf5h0p@travis-nas-01MaxBytes1[travis-nas-01_activeDS0vpdnSession]: 200MaxBytes2[travis-nas-01_activeDS0vpdnSession]: 200Title[travis-nas-01_activeDS0vpdnSession]: activeDS0s and cvpdnSessionTotalPageTop[travis-nas-01_activeDS0vpdnSession]: <H2>activeDS0s and cvpdnSessionTotal</H2><TABLE><TR><TD>Device:</TD><TD>travis-nas-01</TD></TR><TR><TD><a href="/mrtg/mrtg.html">HOME</a></TD></TR></TABLE>Options[travis-nas-01_activeDS0vpdnSession]: gaugeStep 5
igloo:/ ->crontab -e"/tmp/crontabmMaqZd" 14 lines, 610 characters#ident "@(#)root 1.19 98/07/06 SMI" /* SVr4.0 1.1.3.1 */## The root crontab should be used to perform accounting data collection.## The rtc command is run to adjust the real time clock if and when# daylight savings time changes.#10 3 * * 0,4 /etc/cron.d/logchecker10 3 * * 0 /usr/lib/newsyslog15 3 * * 0 /usr/lib/fs/nfs/nfsfind1 2 * * * [ -x /usr/sbin/rtc ] && /usr/sbin/rtc -c > /dev/null 2>&130 3 * * * [ -x /usr/lib/gss/gsscred_clean ] && /usr/lib/gss/gsscred_clean
Caution
Step 6
0,5,10,15,20,25,30,35,40,45,50,55 * * * * /opt/mrtg/run/mrtg
/opt/mrtg/run/conf/travis-nas-01.cfg
Note
"/tmp/crontabmMaqZd" 14 lines, 610 characters#ident "@(#)root 1.19 98/07/06 SMI" /* SVr4.0 1.1.3.1 */## The root crontab should be used to perform accounting data collection.## The rtc command is run to adjust the real time clock if and when# daylight savings time changes.#10 3 * * 0,4 /etc/cron.d/logchecker10 3 * * 0 /usr/lib/newsyslog15 3 * * 0 /usr/lib/fs/nfs/nfsfind1 2 * * * [ -x /usr/sbin/rtc ] && /usr/sbin/rtc -c > /dev/null 2>&130 3 * * * [ -x /usr/lib/gss/gsscred_clean ] && /usr/lib/gss/gsscred_clean0,5,10,15,20,25,30,35,40,45,50,55 * * * * /opt/downloads/mrtg/mrtg-2.8.8/run/mrtg/opt/downloads/mrtg/mrtg-2.8.8/run/travis-nas-01.cfgOn a 5-minute time interval, MRTG will start up, read the configuration file, and re-generate performance graphs.Sending MRTG Graphs to a Web Server
MRTG builds all the graphs and web pages.
To browse and view the graphs produced by MRTG, make sure the web server is running. For information on how to set up a web server, go to http://www.apache.org/
To send MRTG graphs to a web server, follow these steps:
Step 1
igloo:/opt/downloads/mrtg/mrtg-2.8.8/run ->more travis-nas-01.cfgWorkDir: /export/home/www/mrtg/travis-nas-01/dial# set defaultsOptions[_]: growright# make legends reflect these are call countersYLegend[_]: Active CallsShortLegend[_]: callsLegendI[_]: calls:LegendO[_]: calls:...Step 2
igloo:/opt/downloads/mrtg/mrtg-2.8.8/run ->./mrtg travis-nas-01.cfgigloo:/opt/downloads/mrtg/mrtg-2.8.8/run ->Now, the crontab will automatically perform this function every five minutes.
Ignore any Rateup WARNING errors, which means that crontab is working in the background.
Rateup WARNING: .//rateup The backup log file for 172.21.101.20.178 was invalidlRateup WARNING: .//rateup Can't remove 172.21.101.20.178.old updating log fileRateup WARNING: .//rateup Can't rename 172.21.101.20.178.log to 172.21.101.20.1eRateup WARNING: .//rateup could not read the primary log file for 172.21.101.209Step 3
Note
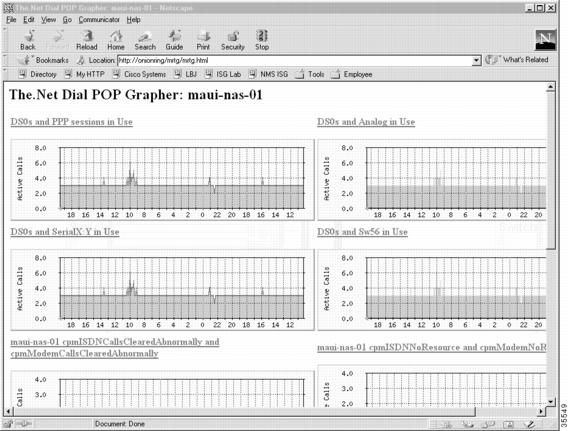
Figure 15
MRTG Graphs Viewed by Using a Web Browser
Appendix
CISCO-MODEM-MGMT-MIB
The output below shows the CISCO-MODEM-MGMT-MIB structures. First just the MIB structure, followed by description and examples of each of the tables in the MIB. For descriptions of the individual OIDs, refer to the following link
ftp://www.cisco.com/pub/mibs/v2/CISCO-MODEM-MGMT-MIB.my
Note
For ease of reading, the Tables (marked with **) are documented after initially showing the basic structure.
ciscoMgmt.47 ciscoModemMgmtMIBciscoMgmt.47.1 ciscoModemMgmtMIBObjectsciscoMgmt.47.1.1 cmSystemInfociscoMgmt.47.1.1.1 cmSystemInstalledModemciscoMgmt.47.1.1.2 cmSystemConfiguredGroupciscoMgmt.47.1.1.3 cmSystemWatchdogTimeciscoMgmt.47.1.1.4 cmSystemStatusPollTimeciscoMgmt.47.1.1.5 cmSystemMaxRetriesciscoMgmt.47.1.1.6 cmSystemModemsInUseciscoMgmt.47.1.1.7 cmSystemModemsAvailableciscoMgmt.47.1.1.8 cmSystemModemsUnavailableciscoMgmt.47.1.1.9 cmSystemModemsOfflineciscoMgmt.47.1.1.10 cmSystemModemsDeadciscoMgmt.47.1.2 cmGroupInfociscoMgmt.47.1.2.1 cmGroupTable **ciscoMgmt.47.1.2.2 cmGroupMemberTable **ciscoMgmt.47.1.3 cmLineInfociscoMgmt.47.1.3.1 cmLineStatusTable **ciscoMgmt.47.1.3.2 cmLineConfigTable **ciscoMgmt.47.1.3.3 cmLineStatisticsTable **ciscoMgmt.47.1.3.4 cmLineSpeedStatisticsTable **Tables:cmGroupTable------------Defined by Group-Async configurationciscoMgmt.47.1.2.1 cmGroupTableciscoMgmt.47.1.2.1.1 cmGroupEntryciscoMgmt.47.1.2.1.1.1 cmGroupIndexciscoMgmt.47.1.2.1.1.2 cmGroupTotalDevicesexample:UCD-SNMP: snmptable -ib -m all maui-nas-01 comm-string .1.3.6.1.4.1.9.9.47.1.2.1 2>/dev/nullSNMP table: enterprises.cisco.ciscoMgmt.ciscoModemMgmtMIB.ciscoModemMgmtMIBObjects.cmGroupInfo.cmGrou pTable.cmGroupEntryindex Index TotalDevices1 ? 48cmGroupMemberTable------------------ciscoMgmt.47.1.2.2 cmGroupMemberTableciscoMgmt.47.1.2.2.1 cmGroupMemberEntryciscoMgmt.47.1.2.2.1.1 cmSlotIndexciscoMgmt.47.1.2.2.1.2 cmPortIndexQuery was: snmptable -ib -m all maui-nas-01 comm-string .1.3.6.1.4.1.9.9.47.1.2.2 2>/dev/nullSNMP table: enterprises.cisco.ciscoMgmt.ciscoModemMgmtMIB.ciscoModemMgmtMIBObjects.cmGroupInfo.cmGrou pMemberTable.cmGroupMemberEntryindex SlotIndex PortIndex1.2.0 ? 01.2.1 ? 11.2.2 ? 21.2.3 ? 31.2.4 ? 41.2.5 ? 51.2.6 ? 61.2.7 ? 71.2.8 ? 81.2.9 ? 91.2.10 ? 101.2.11 ? 111.2.12 ? 121.2.13 ? 131.2.14 ? 141.2.15 ? 151.2.16 ? 161.2.17 ? 171.2.18 ? 181.2.19 ? 191.2.20 ? 201.2.21 ? 211.2.22 ? 221.2.23 ? 231.2.24 ? 241.2.25 ? 251.2.26 ? 261.2.27 ? 271.2.28 ? 281.2.29 ? 291.2.30 ? 301.2.31 ? 311.2.32 ? 321.2.33 ? 331.2.34 ? 341.2.35 ? 351.2.36 ? 361.2.37 ? 371.2.38 ? 381.2.39 ? 391.2.40 ? 401.2.41 ? 411.2.42 ? 421.2.43 ? 431.2.44 ? 441.2.45 ? 451.2.46 ? 461.2.47 ? 47ciscoMgmt.47.1.3.1 cmLineStatusTableciscoMgmt.47.1.3.1.1 cmLineStatusEntryciscoMgmt.47.1.3.1.1.1 cmInterfaceciscoMgmt.47.1.3.1.1.2 cmGroupciscoMgmt.47.1.3.1.1.3 cmManufacturerIDciscoMgmt.47.1.3.1.1.4 cmProductDetailsciscoMgmt.47.1.3.1.1.5 cmManageableciscoMgmt.47.1.3.1.1.6 cmStateciscoMgmt.47.1.3.1.1.7 cmCallDirectionciscoMgmt.47.1.3.1.1.8 cmDisconnectReasonciscoMgmt.47.1.3.1.1.9 cmCallDurationciscoMgmt.47.1.3.1.1.10 cmCallPhoneNumberciscoMgmt.47.1.3.1.1.11 cmCallerIDciscoMgmt.47.1.3.1.1.12 cmModulationSchemeUsedciscoMgmt.47.1.3.1.1.13 cmProtocolUsedciscoMgmt.47.1.3.1.1.14 cmTXRateciscoMgmt.47.1.3.1.1.15 cmRXRateciscoMgmt.47.1.3.1.1.16 cmTXAnalogSignalLevelciscoMgmt.47.1.3.1.1.17 cmRXAnalogSignalLevelexample:UCD-SNMP query: snmptable -ib -m all maui-nas-01 comm-string .1.3.6.1.4.1.9.9.47.1.3.1 2>/dev/nullSNMP table: enterprises.cisco.ciscoMgmt.ciscoModemMgmtMIB.ciscoModemMgmtMIBObjects.cmLineInfo.cmLineS tatusTable.cmLineStatusEntryindex Interface Group ManufacturerID ProductDetails Manageable State CallDirection DisconnectReason CallDuration CallPhoneNumber CallerID ModulationSchemeUsed ProtocolUsed TXRate RXRate TXAnalogSignalLevel RXAnalogSignalLevel2.0 111 1 "Mica Hex Modem" "Modem (Managed Option), Firmware Rev: 50.54.50.48" true onHook incoming dtrDrop 0:0:26:10.60 "81560" "" v34plus reliableLAPM 33600 33600 0 -142.1 112 1 "Mica Hex Modem" "Modem (Managed Option), Firmware Rev: 50.54.50.48" true onHook incoming dtrDrop 0:0:38:24.03 "81560" "" v34plus reliableLAPM 33600 33600 0 -142.2 113 1 "Mica Hex Modem" "Modem (Managed Option), Firmware Rev: 50.54.50.48" true onHook incoming dtrDrop 0:0:16:28.21 "81560" "" v34plus reliableLAPM 33600 33600 0 -142.3 114 1 "Mica Hex Modem" "Modem (Managed Option), Firmware Rev: 50.54.50.48" true onHook incoming dtrDrop 0:0:02:15.46 "81560" "" v34plus reliableLAPM 33600 33600 0 -142.4 115 1 "Mica Hex Modem" "Modem (Managed Option), Firmware Rev: 50.54.50.48" true onHook incoming dtrDrop 0:0:07:58.01 "81560" "" v34plus reliableLAPM 33600 33600 0 -142.5 116 1 "Mica Hex Modem" "Modem (Managed Option), Firmware Rev: 50.54.50.48" true onHook incoming dtrDrop 0:0:13:06.73 "81560" "" v34plus reliableLAPM 33600 33600 0 -142.6 117 1 "Mica Hex Modem" "Modem (Managed Option), Firmware Rev: 50.54.50.48" true onHook incoming dtrDrop 0:0:18:27.16 "81560" "" v34plus reliableLAPM 33600 33600 0 -142.7 118 1 "Mica Hex Modem" "Modem (Managed Option), Firmware Rev: 50.54.50.48" true onHook incoming dtrDrop 0:0:13:50.93 "81560" "" v34plus reliableLAPM 33600 33600 0 -142.8 119 1 "Mica Hex Modem" "Modem (Managed Option), Firmware Rev: 50.54.50.48" true onHook incoming dtrDrop 0:0:05:12.52 "81560" "" v34plus reliableLAPM 33600 33600 0 -142.9 120 1 "Mica Hex Modem" "Modem (Managed Option), Firmware Rev: 50.54.50.48" true onHook incoming dtrDrop 0:0:00:08.72 "81561" "" v34plus reliableLAPM 33600 33600 0 -142.10 121 1 "Mica Hex Modem" "Modem (Managed Option), Firmware Rev: 50.54.50.48" true onHook incoming dtrDrop 0:0:00:08.56 "81561" "" v34plus reliableLAPM 33600 33600 0 -142.11 122 1 "Mica Hex Modem" "Modem (Managed Option), Firmware Rev: 50.54.50.48" true onHook incoming dtrDrop 0:0:16:28.41 "81560" "" v34plus reliableLAPM 33600 33600 0 -142.12 123 1 "Mica Hex Modem" "Modem (Managed Option), Firmware Rev: 50.54.50.48" true onHook incoming remoteLinkDisconnect 0:0:05:39.64 "81560" "" v90 reliableLAPM 42666 21600 0 -302.13 124 1 "Mica Hex Modem" "Modem (Managed Option), Firmware Rev: 50.54.50.48" true onHook incoming remoteLinkDisconnect 0:0:35:44.57 "81560" "" v90 reliableLAPM 37333 21600 0 -302.14 125 1 "Mica Hex Modem" "Modem (Managed Option), Firmware Rev: 50.54.50.48" true onHook incoming remoteLinkDisconnect 0:0:45:52.68 "81560" "" v90 reliableLAPM 37333 19200 0 -302.15 126 1 "Mica Hex Modem" "Modem (Managed Option), Firmware Rev: 50.54.50.48" true onHook incoming remoteLinkDisconnect 0:0:15:08.74 "81560" "" v90 reliableLAPM 37333 19200 0 -302.16 127 1 "Mica Hex Modem" "Modem (Managed Option), Firmware Rev: 50.54.50.48" true onHook incoming remoteLinkDisconnect 0:0:17:55.96 "81560" "" v34plus reliableLAPM 26400 26400 0 -182.17 128 1 "Mica Hex Modem" "Modem (Managed Option), Firmware Rev: 50.54.50.48" true onHook incoming remoteLinkDisconnect 0:0:05:43.36 "81560" "" v34plus reliableLAPM 26400 26400 0 -182.18 129 1 "Mica Hex Modem" "Modem (Managed Option), Firmware Rev: 50.54.50.48" true onHook incoming remoteHangup 0:0:28:45.36 "81560" "" v34plus reliableLAPM 26400 26400 0 -192.19 130 1 "Mica Hex Modem" "Modem (Managed Option), Firmware Rev: 50.54.50.48" true onHook incoming remoteLinkDisconnect 0:0:24:18.44 "81560" "" v90 reliableLAPM 44000 21600 0 -302.20 131 1 "Mica Hex Modem" "Modem (Managed Option), Firmware Rev: 50.54.50.48" true onHook incoming trainupFailure 0:0:00:19.12 "81560" "" v90 reliableLAPM 45333 12000 0 -302.21 132 1 "Mica Hex Modem" "Modem (Managed Option), Firmware Rev: 50.54.50.48" true onHook incoming noCarrier 0:0:00:21.18 "81560" "" v34plus reliableLAPM 26400 26400 0 -222.22 133 1 "Mica Hex Modem" "Modem (Managed Option), Firmware Rev: 50.54.50.48" true onHook incoming remoteHangup 0:0:00:11.13 "81560" "" v34plus reliableLAPM 33600 33600 0 -142.23 134 1 "Mica Hex Modem" "Modem (Managed Option), Firmware Rev: 50.54.50.48" true onHook incoming remoteLinkDisconnect 0:0:03:44.39 "81560" "" v90 reliableLAPM 46666 19200 0 -302.24 135 1 "Mica Hex Modem" "Modem (Managed Option), Firmware Rev: 50.54.50.48" true onHook incoming remoteLinkDisconnect 0:0:14:39.06 "81560" "" v90 reliableLAPM 45333 24000 0 -282.25 136 1 "Mica Hex Modem" "Modem (Managed Option), Firmware Rev: 50.54.50.48" true onHook incoming remoteLinkDisconnect 0:0:23:17.87 "81560" "" v90 reliableLAPM 44000 21600 0 -302.26 137 1 "Mica Hex Modem" "Modem (Managed Option), Firmware Rev: 50.54.50.48" true onHook incoming remoteLinkDisconnect 0:0:11:03.71 "81560" "" v34plus reliableLAPM 28800 24000 0 -262.27 138 1 "Mica Hex Modem" "Modem (Managed Option), Firmware Rev: 50.54.50.48" true onHook incoming remoteLinkDisconnect 0:0:21:12.99 "81560" "" v90 reliableLAPM 37333 21600 0 -302.28 139 1 "Mica Hex Modem" "Modem (Managed Option), Firmware Rev: 50.54.50.48" true onHook incoming noCarrier 0:0:00:21.28 "81560" "" v34plus reliableLAPM 33600 33600 0 -142.29 140 1 "Mica Hex Modem" "Modem (Managed Option), Firmware Rev: 50.54.50.48" true onHook incoming dtrDrop 0:0:00:56.30 "81560" "" v34plus reliableLAPM 33600 33600 0 -142.30 141 1 "Mica Hex Modem" "Modem (Managed Option), Firmware Rev: 50.54.50.48" true onHook incoming dtrDrop 0:0:01:40.98 "81560" "" v34plus reliableLAPM 33600 33600 0 -142.31 142 1 "Mica Hex Modem" "Modem (Managed Option), Firmware Rev: 50.54.50.48" true onHook incoming dtrDrop 0:0:01:07.99 "81560" "" v34plus reliableLAPM 33600 33600 0 -142.32 143 1 "Mica Hex Modem" "Modem (Managed Option), Firmware Rev: 50.54.50.48" true onHook incoming dtrDrop 0:0:00:08.62 "81560" "" v34plus reliableLAPM 33600 33600 0 -142.33 144 1 "Mica Hex Modem" "Modem (Managed Option), Firmware Rev: 50.54.50.48" true onHook incoming dtrDrop 0:0:51:05.39 "81560" "" v34plus reliableLAPM 33600 33600 0 -142.34 145 1 "Mica Hex Modem" "Modem (Managed Option), Firmware Rev: 50.54.50.48" true onHook incoming dtrDrop 0:0:00:05.68 "81561" "" v34plus reliableLAPM 33600 33600 0 -142.35 146 1 "Mica Hex Modem" "Modem (Managed Option), Firmware Rev: 50.54.50.48" true onHook incoming dtrDrop 0:0:01:30.74 "81560" "" v34plus reliableLAPM 33600 33600 0 -142.36 147 1 "Mica Hex Modem" "Modem (Managed Option), Firmware Rev: 50.54.50.48" true onHook incoming dtrDrop 0:0:13:18.80 "81560" "" v34plus reliableLAPM 33600 33600 0 -142.37 148 1 "Mica Hex Modem" "Modem (Managed Option), Firmware Rev: 50.54.50.48" true onHook incoming dtrDrop 0:0:04:40.66 "81560" "" v34plus reliableLAPM 33600 33600 0 -142.38 149 1 "Mica Hex Modem" "Modem (Managed Option), Firmware Rev: 50.54.50.48" true onHook incoming dtrDrop 0:0:00:18.44 "81560" "" v34plus reliableLAPM 33600 33600 0 -142.39 150 1 "Mica Hex Modem" "Modem (Managed Option), Firmware Rev: 50.54.50.48" true onHook incoming dtrDrop 0:0:21:17.14 "81560" "" v34plus reliableLAPM 33600 33600 0 -142.40 151 1 "Mica Hex Modem" "Modem (Managed Option), Firmware Rev: 50.54.50.48" true onHook incoming dtrDrop 0:0:22:52.13 "81560" "" v34plus reliableLAPM 33600 33600 0 -142.41 152 1 "Mica Hex Modem" "Modem (Managed Option), Firmware Rev: 50.54.50.48" true onHook incoming dtrDrop 0:0:07:59.35 "81560" "" v34plus reliableLAPM 33600 33600 0 -142.42 153 1 "Mica Hex Modem" "Modem (Managed Option), Firmware Rev: 50.54.50.48" true onHook incoming dtrDrop 0:1:38:48.66 "81560" "" v34plus reliableLAPM 33600 33600 0 -142.43 154 1 "Mica Hex Modem" "Modem (Managed Option), Firmware Rev: 50.54.50.48" true onHook incoming dtrDrop 0:0:00:53.01 "81560" "" v34plus reliableLAPM 33600 33600 0 -142.44 155 1 "Mica Hex Modem" "Modem (Managed Option), Firmware Rev: 50.54.50.48" true onHook incoming dtrDrop 0:0:09:13.37 "81560" "" v34plus reliableLAPM 33600 33600 0 -142.45 156 1 "Mica Hex Modem" "Modem (Managed Option), Firmware Rev: 50.54.50.48" true onHook incoming dtrDrop 0:0:24:08.74 "81560" "" v34plus reliableLAPM 33600 33600 0 -142.46 157 1 "Mica Hex Modem" "Modem (Managed Option), Firmware Rev: 50.54.50.48" true onHook incoming dtrDrop 0:0:54:00.28 "81560" "" v34plus reliableLAPM 33600 33600 0 -142.47 158 1 "Mica Hex Modem" "Modem (Managed Option), Firmware Rev: 50.54.50.48" true onHook incoming dtrDrop 0:1:01:29.14 "81560" "" v34plus reliableLAPM 33600 33600 0 -14cmLineConfigTable-----------------ciscoMgmt.47.1.3.2 cmLineConfigTableciscoMgmt.47.1.3.2.1 cmLineConfigEntryciscoMgmt.47.1.3.2.1.1 cmATModePermitciscoMgmt.47.1.3.2.1.2 cmStatusPollingciscoMgmt.47.1.3.2.1.3 cmBusyOutRequestciscoMgmt.47.1.3.2.1.4 cmShutdownciscoMgmt.47.1.3.2.1.5 cmHoldResetciscoMgmt.47.1.3.2.1.6 cmBadexampleUCD-SNMP query was: snmptable -ib -m all maui-nas-01 comm-string .1.3.6.1.4.1.9.9.47.1.3.2 2>/dev/nullSNMP table: enterprises.cisco.ciscoMgmt.ciscoModemMgmtMIB.ciscoModemMgmtMIBObjects.cmLineInfo.cmLineC onfigTable.cmLineConfigEntryindex ATModePermit StatusPolling BusyOutRequest Shutdown HoldReset Bad2.0 ? true false false ? false2.1 ? true false false ? false2.2 ? true false false ? false2.3 ? true false false ? false2.4 ? true false false ? false2.5 ? true false false ? false2.6 ? true false false ? false2.7 ? true false false ? false2.8 ? true false false ? false2.9 ? true false false ? false2.10 ? true false false ? false2.11 ? true false false ? false2.12 ? true false false ? false2.13 ? true false false ? false2.14 ? true false false ? false2.15 ? true false false ? false2.16 ? true false false ? false2.17 ? true false false ? false2.18 ? true false false ? false2.19 ? true false false ? false2.20 ? true false false ? false2.21 ? true false false ? false2.22 ? true false false ? false2.23 ? true false false ? false2.24 ? true false false ? false2.25 ? true false false ? false2.26 ? true false false ? false2.27 ? true false false ? false2.28 ? true false false ? false2.29 ? true false false ? false2.30 ? true false false ? false2.31 ? true false false ? false2.32 ? true false false ? false2.33 ? true false false ? false2.34 ? true false false ? false2.35 ? true false false ? false2.36 ? true false false ? false2.37 ? true false false ? false2.38 ? true false false ? false2.39 ? true false false ? false2.40 ? true false false ? false2.41 ? true false false ? false2.42 ? true false false ? false2.43 ? true false false ? false2.44 ? true false false ? false2.45 ? true false false ? false2.46 ? true false false ? false2.47 ? true false false ? falsecmLineStatisticsTable---------------------ciscoMgmt.47.1.3.3 cmLineStatisticsTableciscoMgmt.47.1.3.3.1 cmLineStatisticsEntryciscoMgmt.47.1.3.3.1.1 cmRingNoAnswersciscoMgmt.47.1.3.3.1.2 cmIncomingConnectionFailuresciscoMgmt.47.1.3.3.1.3 cmIncomingConnectionCompletionsciscoMgmt.47.1.3.3.1.4 cmOutgoingConnectionFailuresciscoMgmt.47.1.3.3.1.5 cmOutgoingConnectionCompletionsciscoMgmt.47.1.3.3.1.6 cmFailedDialAttemptsciscoMgmt.47.1.3.3.1.7 cmNoDialTonesciscoMgmt.47.1.3.3.1.8 cmDialTimeoutsciscoMgmt.47.1.3.3.1.9 cmWatchdogTimeoutsciscoMgmt.47.1.3.3.1.10 cm2400OrLessConnectionsciscoMgmt.47.1.3.3.1.11 cm2400To14400ConnectionsciscoMgmt.47.1.3.3.1.12 cmGreaterThan14400ConnectionsciscoMgmt.47.1.3.3.1.13 cmNoCarriersciscoMgmt.47.1.3.3.1.14 cmLinkFailuresciscoMgmt.47.1.3.3.1.15 cmProtocolErrorsciscoMgmt.47.1.3.3.1.16 cmPollingTimeoutsciscoMgmt.47.1.3.3.1.17 cmTotalCallDurationexample:UCD-SNMP query was: snmptable -ib -m all maui-nas-01 comm-string .1.3.6.1.4.1.9.9.47.1.3.3 2>/dev/nullSNMP table: enterprises.cisco.ciscoMgmt.ciscoModemMgmtMIB.ciscoModemMgmtMIBObjects.cmLineInfo.cmLineS tatisticsTable.cmLineStatisticsEntryindex RingNoAnswers IncomingConnectionFailures IncomingConnectionCompletions OutgoingConnectionFailures OutgoingConnectionCompletions FailedDialAttempts NoDialTones DialTimeouts WatchdogTimeouts 2400OrLessConnections 2400To14400Connections GreaterThan14400Connections NoCarriers LinkFailures ProtocolErrors PollingTimeouts TotalCallDuration2.0 0 1 1 0 0 0 0 0 0 0 0 1 0 0 0 0 15742.1 0 1 1 0 0 0 0 0 0 0 0 1 0 0 0 0 23182.2 0 1 1 0 0 0 0 0 0 0 0 1 0 0 0 0 9942.3 0 1 1 0 0 0 0 0 0 0 0 1 0 0 0 0 1352.4 0 0 2 0 0 0 0 0 0 0 0 2 0 0 0 0 31932.5 0 0 2 0 0 0 0 0 0 0 0 2 0 0 0 0 10952.6 0 1 1 0 0 0 0 0 0 0 0 1 0 0 0 0 11282.7 0 0 2 0 0 0 0 0 0 0 0 2 0 0 0 0 9082.8 0 1 1 0 0 0 0 0 0 0 0 1 0 0 0 0 3612.9 0 0 2 0 0 0 0 0 0 0 0 2 0 0 0 0 4992.10 0 0 2 0 0 0 0 0 0 0 0 2 0 0 0 0 27562.11 0 0 2 0 0 0 0 0 0 0 0 2 0 0 0 0 19372.12 0 0 2 0 0 0 0 0 0 0 0 2 0 0 0 0 90912.13 0 0 2 0 0 0 0 0 0 0 0 2 0 0 0 0 26622.14 0 0 2 0 0 0 0 0 0 0 0 2 0 0 0 0 44362.15 0 0 2 0 0 0 0 0 0 0 0 2 0 0 0 0 95412.16 0 0 2 0 0 0 0 0 0 0 0 2 0 0 0 0 12112.17 0 0 2 0 0 0 0 0 0 0 0 2 0 0 0 0 4132.18 0 0 2 0 0 0 0 0 0 0 0 2 0 0 0 0 40282.19 0 0 2 0 0 0 0 0 0 0 0 2 0 0 0 0 56492.20 0 1 1 0 0 0 0 0 0 0 0 1 0 0 0 0 542.21 0 1 1 0 0 0 0 0 0 0 0 1 0 0 0 0 17812.22 0 1 0 0 0 0 0 0 0 0 0 0 0 0 0 0 112.23 0 0 1 0 0 0 0 0 0 0 0 1 0 0 0 0 2242.24 0 0 2 0 0 0 0 0 0 0 0 2 0 0 0 0 24562.25 0 0 2 0 0 0 0 0 0 0 0 2 0 0 0 0 14072.26 0 0 2 0 0 0 0 0 0 0 0 2 0 0 0 0 6722.27 0 0 2 0 0 0 0 0 0 0 0 2 0 0 0 0 12832.28 0 1 1 0 0 0 0 0 0 0 0 1 0 0 0 0 302.29 0 0 1 0 0 0 0 0 0 0 0 1 0 0 0 0 562.30 0 0 1 0 0 0 0 0 0 0 0 1 0 0 0 0 1002.31 0 0 1 0 0 0 0 0 0 0 0 1 0 0 0 0 672.32 0 0 1 0 0 0 0 0 0 0 0 1 0 0 0 0 82.33 0 0 1 0 0 0 0 0 0 0 0 1 0 0 0 0 30652.34 0 0 1 0 0 0 0 0 0 0 0 1 0 0 0 0 52.35 0 0 1 0 0 0 0 0 0 0 0 1 0 0 0 0 902.36 0 0 2 0 0 0 0 0 0 0 0 2 0 0 0 0 8472.37 0 0 2 0 0 0 0 0 0 0 0 2 0 0 0 0 3322.38 0 0 1 0 0 0 0 0 0 0 0 1 0 0 0 0 182.39 0 0 1 0 0 0 0 0 0 0 0 1 0 0 0 0 12772.40 0 0 1 0 0 0 0 0 0 0 0 1 0 0 0 0 13722.41 0 0 1 0 0 0 0 0 0 0 0 1 0 0 0 0 4792.42 0 0 1 0 0 0 0 0 0 0 0 1 0 0 0 0 59282.43 0 0 1 0 0 0 0 0 0 0 0 1 0 0 0 0 532.44 0 1 1 0 0 0 0 0 0 0 0 1 0 0 0 0 5992.45 0 1 1 0 0 0 0 0 0 0 0 1 0 0 0 0 14552.46 0 1 1 0 0 0 0 0 0 0 0 1 0 0 0 0 32482.47 0 1 1 0 0 0 0 0 0 0 0 1 0 0 0 0 3701cmLineSpeedStatisticsTable--------------------------note that this table produces a distinct entry for each TX speed established with each modem.ciscoMgmt.47.1.3.4 cmLineSpeedStatisticsTableciscoMgmt.47.1.3.4.1 cmLineSpeedStatisticsEntryciscoMgmt.47.1.3.4.1.1 cmInitialLineSpeedciscoMgmt.47.1.3.4.1.2 cmInitialLineConnectionsciscoMgmt.47.1.3.4.1.3 cmInitialTxLineConnectionsciscoMgmt.47.1.3.4.1.4 cmInitialRxLineConnectionsexample:UCD-SNMP query was: snmptable -ib -m all maui-nas-01 comm-string .1.3.6.1.4.1.9.9.47.1.3.4 2>/dev/nullSNMP table: enterprises.cisco.ciscoMgmt.ciscoModemMgmtMIB.ciscoModemMgmtMIBObjects.cmLineInfo.cmLineS peedStatisticsTable.cmLineSpeedStatisticsEntryindex LineSpeed LineConnections TxLineConnections RxLineConnections2.1.48000 ? 1 1 ?2.2.45333 ? 1 1 ?2.3.26400 ? 1 1 ?2.4.44000 ? 1 1 ?2.4.45333 ? 1 1 ?2.5.26400 ? 1 1 ?2.5.46667 ? 1 1 ?2.6.44000 ? 1 1 ?2.7.24000 ? 1 1 ?2.7.45333 ? 1 1 ?2.8.44000 ? 1 1 ?2.9.33600 ? 1 1 ?2.9.44000 ? 1 1 ?2.10.33600 ? 1 1 ?2.10.46667 ? 1 1 ?2.11.44000 ? 1 1 ?2.11.45333 ? 1 1 ?2.12.26400 ? 1 1 ?2.12.42667 ? 1 1 ?2.13.37333 ? 1 1 ?2.13.44000 ? 1 1 ?2.14.44000 ? 2 2 ?2.15.37333 ? 1 1 ?2.15.44000 ? 1 1 ?2.16.26400 ? 1 1 ?2.16.44000 ? 1 1 ?2.17.26400 ? 2 2 ?2.18.24000 ? 1 1 12.18.26400 ? 1 1 12.19.44000 ? 2 2 ?2.20.45333 ? 1 1 ?2.21.26400 ? 1 1 ?2.23.46667 ? 1 1 ?2.24.26400 ? 1 1 ?2.24.45333 ? 1 1 ?2.25.33600 ? 1 1 ?2.25.44000 ? 1 1 ?2.26.33600 ? 1 1 ?2.26.44000 ? 1 1 ?2.27.33600 ? 1 1 ?2.27.37333 ? 1 1 ?2.28.33600 ? 1 1 12.29.37333 ? 1 1 ?2.30.42667 ? 1 1 ?2.31.42667 ? 1 1 ?2.32.33600 ? 1 1 12.33.26400 ? 1 1 ?2.34.33600 ? 1 1 12.35.26400 ? 1 1 ?2.36.24000 ? 1 1 12.36.26400 ? 1 1 12.37.26400 ? 1 1 ?2.37.45333 ? 1 1 ?2.38.33600 ? 1 1 12.39.26400 ? 1 1 12.40.26400 ? 1 1 12.41.26400 ? 1 1 ?2.42.50667 ? 1 1 ?2.43.33600 ? 1 1 12.44.45333 ? 1 1 ?2.45.44000 ? 1 1 ?2.46.45333 ? 1 1 ?2.47.48000 ? 1 1 ?CISCO-POP-MGMT-MIB
The output below shows the MIB structures. First just the MIB structure, followed by description and examples of each of the tables in the MIB. For descriptions of the individual OIDs, refer to the following link:
ftp://www.cisco.com/pub/mibs/v2/CISCO-POP-MGMT-MIB.myTables (marked with **) are documented after initially showing the basic structure.
Note
ciscoExperiment.19 ciscoPopMgmtMIBciscoExperiment.19.1 ciscoPopMgmtMIBObjectsciscoExperiment.19.1.1 cpmDS0UsageciscoExperiment.19.1.1.1 cpmDS0UsageTable **ciscoExperiment.19.1.1.2 cpmISDNCfgBChanInUseForAnalogciscoExperiment.19.1.1.3 cpmISDNCfgBChannelsInUseciscoExperiment.19.1.1.4 cpmActiveDS0sciscoExperiment.19.1.1.5 cpmPPPCallsciscoExperiment.19.1.1.6 cpmV120CallsciscoExperiment.19.1.1.7 cpmV110CallsciscoExperiment.19.1.1.8 cpmActiveDS0sHighWaterMarkciscoExperiment.19.1.1.9 cpmDS1DS0UsageTable **ciscoExperiment.19.1.1.10 cpmSW56CfgBChannelsInUseciscoExperiment.19.1.2 cpmCallFailureciscoExperiment.19.1.2.1 cpmISDNCallsRejectedciscoExperiment.19.1.2.2 cpmModemCallsRejectedciscoExperiment.19.1.2.3 cpmISDNCallsClearedAbnormallyciscoExperiment.19.1.2.4 cpmModemCallsClearedAbnormallyciscoExperiment.19.1.2.5 cpmISDNNoResourceciscoExperiment.19.1.2.6 cpmModemNoResourceciscoExperiment.19.1.3 cpmActiveCallSummaryciscoExperiment.19.1.3.1 cpmActiveCallSummaryTable **ciscoExperiment.19.1.4 cpmCallHistorySummaryciscoExperiment.19.1.4.1 cpmCallHistorySummaryTableMaxLengthciscoExperiment.19.1.4.2 cpmCallHistorySummaryRetainTimerciscoExperiment.19.1.4.3 cpmCallHistorySummaryTable **Tables:ciscoExperiment.19.1.1.1 cpmDS0UsageTableciscoExperiment.19.1.1.1.1 cpmDS0UsageEntryciscoExperiment.19.1.1.1.1.1 cpmDS1SlotIndexciscoExperiment.19.1.1.1.1.2 cpmDS1PortIndexciscoExperiment.19.1.1.1.1.3 cpmChannelIndexciscoExperiment.19.1.1.1.1.4 cpmConfiguredTypeciscoExperiment.19.1.1.1.1.5 cpmDS0CallTypeciscoExperiment.19.1.1.1.1.6 cpmL2EncapsulationciscoExperiment.19.1.1.1.1.7 cpmCallCountciscoExperiment.19.1.1.1.1.8 cpmTimeInUseciscoExperiment.19.1.1.1.1.9 cpmInOctetsciscoExperiment.19.1.1.1.1.10 cpmOutOctetsciscoExperiment.19.1.1.1.1.11 cpmInPacketsciscoExperiment.19.1.1.1.1.12 cpmOutPacketsciscoExperiment.19.1.1.1.1.13 cpmAssociatedInterfaceRequested Cmd: table cpmDS0UsageTableRequested Device: maui-nas-01MIB: CISCO-POP-MGMT-MIBOID: Numberic = .1.3.6.1.4.1.9.10.19.1.1.1, Symbolic = cpmDS0UsageTableQuery was: snmptable -ib -m all maui-nas-01 comm-string .1.3.6.1.4.1.9.10.19.1.1.1 2>/dev/nullSNMP table: enterprises.cisco.ciscoExperiment.ciscoPopMgmtMIB.ciscoPopMgmtMIBObjects.cpmDS0Usage.cpmD S0UsageTable.cpmDS0UsageEntryindex DS1SlotIndex DS1PortIndex ChannelIndex ConfiguredType DS0CallType L2Encapsulation CallCount TimeInUse InOctets OutOctets InPackets OutPackets AssociatedInterface0.0.1 ? ? ? isdn idle idle 461 11:1:46:00.97 44982715 176835046 588552 802003 00.0.2 ? ? ? isdn idle idle 526 9:20:33:29.86 36208855 167507646 534831 708102 00.0.3 ? ? ? isdn idle idle 451 11:3:10:36.16 41248252 114100690 582169 674952 00.0.4 ? ? ? isdn idle idle 460 10:21:30:09.28 35820269 134593851 541276 673246 00.0.5 ? ? ? isdn idle idle 456 12:0:42:59.16 36713595 106348001 539414 661495 00.0.6 ? ? ? isdn digital ppp 447 12:5:26:40.81 36252194 97184233 538126 637106 130.0.7 ? ? ? isdn digital ppp 477 10:15:33:05.26 31382442 108382154 498961 611513 140.0.8 ? ? ? isdn digital ppp 517 10:5:00:08.13 41354732 112750451 561400 689899 150.0.9 ? ? ? isdn idle idle 477 10:21:07:34.02 42995378 108258834 591331 707045 00.0.10 ? ? ? isdn idle idle 490 11:3:16:21.31 37089916 112267777 548112 687521 00.0.11 ? ? ? isdn idle idle 459 11:11:48:45.57 48401400 122513022 624014 769786 00.0.12 ? ? ? isdn idle idle 0 0:0:00:00.00 0 0 0 0 00.0.13 ? ? ? isdn idle idle 0 0:0:00:00.00 0 0 0 0 00.0.14 ? ? ? isdn idle idle 0 0:0:00:00.00 0 0 0 0 00.0.15 ? ? ? isdn idle idle 0 0:0:00:00.00 0 0 0 0 00.0.16 ? ? ? isdn idle idle 0 0:0:00:00.00 0 0 0 0 00.0.17 ? ? ? isdn idle idle 0 0:0:00:00.00 0 0 0 0 00.0.18 ? ? ? isdn idle idle 0 0:0:00:00.00 0 0 0 0 00.0.19 ? ? ? isdn idle idle 0 0:0:00:00.00 0 0 0 0 00.0.20 ? ? ? isdn idle idle 0 0:0:00:00.00 0 0 0 0 00.0.21 ? ? ? isdn idle idle 0 0:0:00:00.00 0 0 0 0 00.0.22 ? ? ? isdn idle idle 0 0:0:00:00.00 0 0 0 0 00.0.23 ? ? ? isdn idle idle 0 0:0:00:00.00 0 0 0 0 00.0.24 ? ? ? isdn idle idle 0 0:0:00:00.00 1631071 1601699 335265 335265 00.1.1 ? ? ? isdn idle idle 0 0:0:00:00.00 0 0 0 0 00.1.2 ? ? ? isdn idle idle 0 0:0:00:00.00 0 0 0 0 00.1.3 ? ? ? isdn idle idle 0 0:0:00:00.00 0 0 0 0 00.1.4 ? ? ? isdn idle idle 0 0:0:00:00.00 0 0 0 0 00.1.5 ? ? ? isdn idle idle 0 0:0:00:00.00 0 0 0 0 00.1.6 ? ? ? isdn idle idle 0 0:0:00:00.00 0 0 0 0 00.1.7 ? ? ? isdn idle idle 0 0:0:00:00.00 0 0 0 0 00.1.8 ? ? ? isdn idle idle 0 0:0:00:00.00 0 0 0 0 00.1.9 ? ? ? isdn idle idle 0 0:0:00:00.00 0 0 0 0 00.1.10 ? ? ? isdn idle idle 0 0:0:00:00.00 0 0 0 0 00.1.11 ? ? ? isdn idle idle 0 0:0:00:00.00 0 0 0 0 00.1.12 ? ? ? isdn idle idle 0 0:0:00:00.00 0 0 0 0 00.1.13 ? ? ? isdn idle idle 0 0:0:00:00.00 0 0 0 0 00.1.14 ? ? ? isdn idle idle 0 0:0:00:00.00 0 0 0 0 00.1.15 ? ? ? isdn idle idle 0 0:0:00:00.00 0 0 0 0 00.1.16 ? ? ? isdn idle idle 0 0:0:00:00.00 0 0 0 0 00.1.17 ? ? ? isdn idle idle 0 0:0:00:00.00 0 0 0 0 00.1.18 ? ? ? isdn idle idle 0 0:0:00:00.00 0 0 0 0 00.1.19 ? ? ? isdn idle idle 0 0:0:00:00.00 0 0 0 0 00.1.20 ? ? ? isdn idle idle 0 0:0:00:00.00 0 0 0 0 00.1.21 ? ? ? isdn idle idle 0 0:0:00:00.00 0 0 0 0 00.1.22 ? ? ? isdn idle idle 0 0:0:00:00.00 0 0 0 0 00.1.23 ? ? ? isdn idle idle 0 0:0:00:00.00 0 0 0 0 00.1.24 ? ? ? isdn idle idle 0 0:0:00:00.00 12 12 4 4 0ciscoExperiment.19.1.1.9 cpmDS1DS0UsageTableciscoExperiment.19.1.1.9.1 cpmDS1DS0UsageEntryciscoExperiment.19.1.1.9.1.1 cpmDS1UsageSlotIndexciscoExperiment.19.1.1.9.1.2 cpmDS1UsagePortIndexciscoExperiment.19.1.1.9.1.3 cpmDS1ActiveDS0sciscoExperiment.19.1.1.9.1.4 cpmDS1ActiveDS0sHighWaterMarkRequested Cmd: table DS1DS0 Usage TableRequested Device: maui-nas-01MIB: CISCO-POP-MGMT-MIBOID: Numberic = .1.3.6.1.4.1.9.10.19.1.1.9, Symbolic = cpmDS1DS0UsageTableQuery was: snmptable -ib -m all maui-nas-01 comm-string .1.3.6.1.4.1.9.10.19.1.1.9 2>/dev/nullSNMP table: enterprises.cisco.ciscoExperiment.ciscoPopMgmtMIB.ciscoPopMgmtMIBObjects.cpmDS0Usage.cpmD S1DS0UsageTable.cpmDS1DS0UsageEntryindex UsageSlotIndex UsagePortIndex ActiveDS0s ActiveDS0sHighWaterMark0.0 ? ? 3 80.1 ? ? 0 00.2 ? ? 0 00.3 ? ? 0 0ciscoExperiment.19.1.3.1 cpmActiveCallSummaryTableciscoExperiment.19.1.3.1.1 cpmActiveCallSummaryEntryciscoExperiment.19.1.3.1.1.1 cpmActiveCallStartTimeIndexciscoExperiment.19.1.3.1.1.2 cpmActiveCallSummaryIndexciscoExperiment.19.1.3.1.1.3 cpmActiveUserIDciscoExperiment.19.1.3.1.1.4 cpmActiveUserIpAddrciscoExperiment.19.1.3.1.1.5 cpmActiveCallTypeciscoExperiment.19.1.3.1.1.6 cpmActiveModemSlotciscoExperiment.19.1.3.1.1.7 cpmActiveModemPortciscoExperiment.19.1.3.1.1.8 cpmActiveCallDurationciscoExperiment.19.1.3.1.1.9 cpmActiveEntrySlotciscoExperiment.19.1.3.1.1.10 cpmActiveEntryPortciscoExperiment.19.1.3.1.1.11 cpmActiveEntryChannelciscoExperiment.19.1.3.1.1.12 cpmActiveRemotePhoneNumberciscoExperiment.19.1.3.1.1.13 cpmActiveLocalPhoneNumberciscoExperiment.19.1.3.1.1.14 cpmActiveTTYNumberRequested Cmd: table cpmActiveCallSummaryTableRequested Device: maui-nas-01MIB: CISCO-POP-MGMT-MIBOID: Numberic = .1.3.6.1.4.1.9.10.19.1.3.1, Symbolic = cpmActiveCallSummaryTableQuery was: snmptable -ib -m all maui-nas-01 comm-string .1.3.6.1.4.1.9.10.19.1.3.1 2>/dev/nullSNMP table: enterprises.cisco.ciscoExperiment.ciscoPopMgmtMIB.ciscoPopMgmtMIBObjects.cpmActiveCallSum mary.cpmActiveCallSummaryTable.cpmActiveCallSummaryEntryindex CallStartTimeIndex CallSummaryIndex UserID UserIpAddr CallType ModemSlot ModemPort CallDuration EntrySlot EntryPort EntryChannel RemotePhoneNumber LocalPhoneNumber TTYNumber286967118.0 ? ? "rbrown-isdn-rad" 0.0.0.0 digital -1 -1 0:2:21:51.51 0 0 6 "" "81560" -1286970118.0 ? ? "rbrown-isdn-rad" 0.0.0.0 digital -1 -1 0:2:21:21.52 0 0 7 "" "81560" -1286984294.0 ? ? "dleyland-isdn" 0.0.0.0 digital -1 -1 0:2:18:59.76 0 0 8 "" "81560" -1ciscoExperiment.19.1.4.3 cpmCallHistorySummaryTableciscoExperiment.19.1.4.3.1 cpmCallHistorySummaryEntryciscoExperiment.19.1.4.3.1.1 cpmCallDisconnectTimeIndexciscoExperiment.19.1.4.3.1.2 cpmCallStartTimeIndexciscoExperiment.19.1.4.3.1.3 cpmCallHistorySummaryIndexciscoExperiment.19.1.4.3.1.4 cpmUserIDciscoExperiment.19.1.4.3.1.5 cpmUserIpAddrciscoExperiment.19.1.4.3.1.6 cpmCallTypeciscoExperiment.19.1.4.3.1.7 cpmModemSlotciscoExperiment.19.1.4.3.1.8 cpmModemPortciscoExperiment.19.1.4.3.1.9 cpmCallDurationciscoExperiment.19.1.4.3.1.10 cpmEntrySlotciscoExperiment.19.1.4.3.1.11 cpmEntryPortciscoExperiment.19.1.4.3.1.12 cpmEntryChannelciscoExperiment.19.1.4.3.1.13 cpmRemotePhoneNumberciscoExperiment.19.1.4.3.1.14 cpmLocalPhoneNumberciscoExperiment.19.1.4.3.1.15 cpmTTYNumber