-
Cisco Prime Network User Guide, 4.0
-
Preface
-
Setting Up Devices and Using the GUI Clients
-
Working with the Cisco Prime Network Vision Client
-
Viewing and Managing NE Properties
-
Device Configurations and Software Images
-
Working with Prime Network Vision Maps
-
Working with Links
-
Labeling NEs Using Business Tags
-
Tracking Faults Using Prime Network Events
-
Working with Tickets in Cisco Prime Network Vision
-
Working with Reports
-
Using Cisco PathTracer to Diagnose Problems
-
Monitoring Carrier Ethernet Services
-
Monitoring Carrier Grade NAT Properties
-
Monitoring DWDM Properties
-
Monitoring Ethernet Operations, Administration, and Maintenance Tool Properties
-
Monitoring Y.1731 IPSLA Configuration
-
IPv6 and IPv6 VPN over MPLS
-
Monitoring MPLS Services
-
Viewing IP and MPLS Multicast Configurations
-
Monitoring MToP Services
-
Viewing and Managing SBCs
-
Monitoring AAA Configurations
-
Monitoring IP Pools
-
Monitoring BNG Configurations
-
Monitoring Mobile Technologies
-
Monitoring Data Center Configurations
-
Monitoring the Cable Technologies
-
Monitoring ADSL2+ and VDSL2 Technology Enhancements
-
Icon and Button Reference
-
Glossary
-
Index
-
 Feedback
Table Of Contents
Working with Tickets in Prime Network Vision
User Roles Required to Work with Tickets in Prime Network Vision
Viewing Tickets and Network Events for Elements in a Map
Managing Tickets in the Tickets Tab
Filtering Tickets by Network Element
Impact Analysis in Prime Network
Working with Tickets in Prime Network Vision
These topics describe how to work with tickets in Prime Network Vision:
•
User Roles Required to Work with Tickets in Prime Network Vision
•
•
What are Tickets?
A ticket represents the complete hierarchy of correlated alarms representing a single specific fault scenario. A ticket points to the root cause alarm that is the top-most alarm in the correlation hierarchy. Examples of alarms are Link Down, Device Unreachable, or Module Out. Some event types are capable of creating tickets. When an event is generated, it is correlated to an existing event, which is correlated to a ticket. If there is no existing ticket, a new ticket is created.
Prime Network identifies the relationship between a root cause alarm and its consequent alarms. It automatically correlates the consequent alarms as children of the root alarm. The ticket pane displays the ticket (the root cause alarm), the aggregated severity of the ticket, and the severity of the root cause alarm. The root cause alarm severity is the top-most severity of its contained alarms. In addition, the ticket pane displays the time at which the original event was detected, the ticket creation time, and a description of the event that caused the ticket creation.
User Roles Required to Work with Tickets in Prime Network Vision
This topic identifies the roles that are required to work with tickets in Prime Network Vision. Prime Network determines whether you are authorized to perform a task as follows:
•
•
For more information on user authorization, see the topic on device scopes in the Cisco Prime Network 4.0 Administrator Guide.
The following conditions apply when working with tickets in Prime Network Vision:
•
–
–
•
•
•
•
•
Table 9-1 identifies the roles required to perform the high level tasks:
Table 9-1 Default Roles/Permissions Required for Working with Tickets in Prime Network Vision
Acknowledge/deacknowledge tickets
—
—
X1
X
X
Add notes to a ticket
—
—
X1
X
X
Clear and remove tickets
—
—
X1
X
X
Clear tickets
—
—
X1
X
X
Filter tickets
X
X
X
X
X
Find affected elements
X
X
X
X
X
Remove tickets
—
—
X1
X
X
View ticket properties
X
X
X
X
X
View tickets
X
X
X
X
X
1 In addition, the security level for the device scope must be OperatorPlus or higher for the device that holds the root alarm for a ticket.
Viewing Tickets and Network Events for Elements in a Map
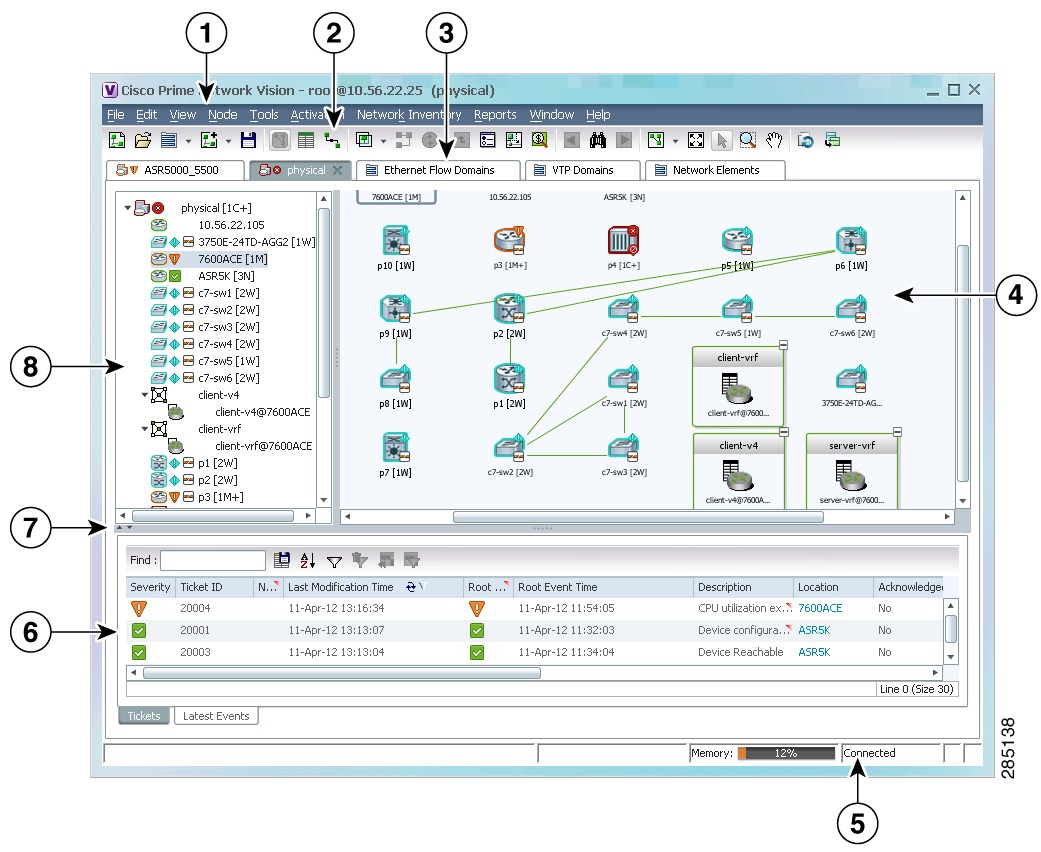
The ticket pane, located below the navigation and content panes in the Prime Network Vision window, displays tickets and network events specific to the elements in the currently displayed map (see Figure 9-1). You can view or hide the ticket pane by clicking the arrows displayed below the navigation pane.
The ticket pane contains two tabs:
•
•
–
–
–
–
–
Figure 9-1 Prime Network Vision Window
Menu bar
Status bar
Toolbar
Ticket pane
Inventory and map tabs
Hide/Display ticket pane
Content pane
Navigation pane
Managing Tickets in the Tickets Tab
Table 9-2 describes the functions that are available from the Tickets tab in the ticket pane.
Table 9-3 describes the information displayed in the ticket pane.
Table 9-3 Ticket Information Displayed in the Ticket Pane
Severity
Severity of alarm, represented by an icon. The icon and its color indicate the alarm severity and thereby the impact of the alarm on the network. For more information about severity, see Map View.
•
•
•
•
•
•
•
Ticket ID
Ticket identifier, assigned sequentially. Click the hyperlinked entry to view ticket properties, and to acknowledge, clear, or refresh the ticket. For more information, see Chapter 9 "Working with Tickets in Prime Network Vision."
Notes
An icon in this column indicates that a note has been added for the ticket. Click on the icon to read the note and add your own note, if necessary.
Last Modification Time
Date and time (per the database) that the ticket was last updated. Updates can result from either manual or automatic operations.
Root Cause
Severity of the root cause alarm, represented by a bell icon. The color indicates the severity of the root cause alarm, as described in the Severity field.
Root Event Time
Date and time that the event that created the root cause alarm of the ticket was detected.
Description
Description of the event that caused the ticket creation.
Location
Entity that triggered the ticket, as a hyperlink that displays the relevant location in the inventory.
Element Type
The type of element that triggered the root event, e.g., Cisco 7606.
Acknowledged
Whether the ticket is acknowledged or has been modified: Yes, No, or Modified. If the ticket is acknowledged, this field also displays the user who acknowledged the ticket; for example, Yes(root).
Creation Time
Date and time (per the database) that the ticket was created.
Event Count
Number of events associated with the ticket.
Affected Devices Count
Number of devices affected by the ticket, including the sources of the alarm and their subsequent alarms.
Duplication Count
For network events, the duplication count is calculated by the VNE and pertains only to flapping events. The duplication count represents the number of noncleared events aggregated by the flapping event.
For tickets, the duplication count is the sum of the duplication counts of all events that are associated with the root alarm.
Reduction Count
For network events, the reduction count is calculated by the VNE and pertains only to flapping events. The reduction count represents the number of events that are aggregated by the flapping event.
Ticket reduction count is the sum of reduction counts of all the events that are associated to the ticket. The History tab in the Windows Properties window displays one reduction count for each event listed.
Alarm Count
Total number of alarms associated with the ticket, including the root alarm.
The ticket details in the ticket pane change automatically as new information arrives. For example, Port Down is updated to Port Up.
By default, the tickets in the ticket pane are sorted according to the last modification time.
The Find field enables you to search for information in the ticket pane table according to the selected column. For more information about the buttons displayed in Prime Network Vision tables and table functionality, see Filtering and Sorting Tabular Content.
Filtering Tickets by Network Element
Prime Network Vision enables you to filter the tickets that are shown in the ticket pane so that you see only the tickets that have the selected network element as the root cause.
If the selected network element is alarmed due to an operation that occurred on a different VNE, element, or link, no tickets are displayed.
To view tickets that have a specific network element as the root cause, do either of the following:
•
•
In response:
•
•
Click Clear Filter in the ticket pane to view all tickets.
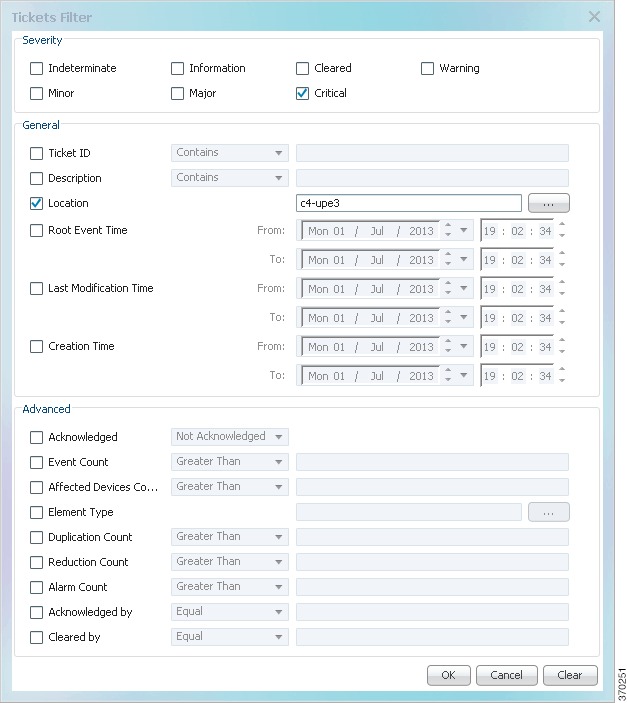
Filtering Tickets by Criteria
Prime Network Vision enables you to define a filter for the tickets displayed in the ticket pane according to various criteria. For example, tickets can be filtered according to the number of affected parties or acknowledged tickets.
To define a ticket filter:
Step 1
Figure 9-2 Ticket Filter Dialog Box
Step 2
a.
b.
c.
Step 3
Note
To remove a ticket filter:
Step 1
Step 2
Step 3
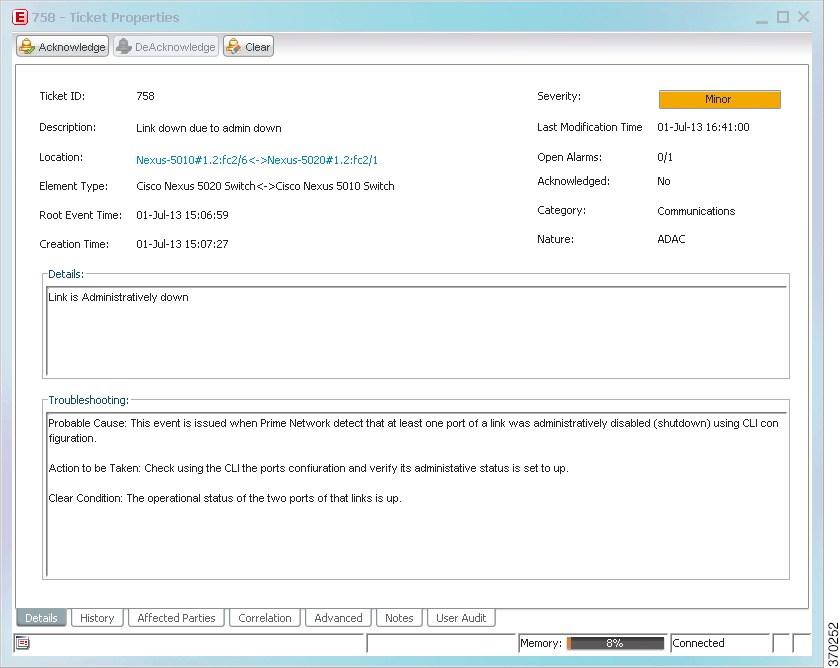
Viewing Ticket Properties
In Prime Network Vision, open the Ticket Properties window in one of the following ways:
•
•
Figure 9-3 shows the Ticket Properties window.
Figure 9-3 Ticket Properties Window
The information displayed in the Ticket Properties window corresponds with the information displayed in the Prime Network Vision ticket pane or the Prime Network Vision window. The ID number displayed in the header corresponds to the ID number of the ticket selected in the ticket pane.
The Ticket Properties window contains the following components:
Details Tab
Table 9-5 describes the information that is displayed in the Details tab about the ticket.
History Tab
The History tab enables you to display the history of the ticket, including all the events. Table 9-6 describes the information that is displayed in the History tab.
Affected Parties Tab
The Affected Parties tab displays the service resources (pairs) that are affected by an event, an alarm, or a ticket. When a fault occurs, Prime Network automatically calculates the affected parties and embeds this information in the ticket along with all the correlated faults. You can view a list of all the endpoints that are affected.
The Affected Parties tab displays the service resources (affected pairs) that are affected by the ticket.
The Affected Parties tab contains two tables: Source and Destination. Table 9-7 describes the information that is displayed in the Affected Properties tab.
Table 9-7 Ticket Properties Window - Affected Parties Tab
Location
Hyperlinked entry to the port with the affected parties.
Key
Unique value taken from the affected element's business tag key, if it exists.
Name
Subinterface (site) name or business tag name of the affected element, if it exists.
Type
Business tag type.
IP Address
If the affected element is an IP interface, the IP address of the subinterface site.
Affected Status (Agg)
Status for the affected pair (destination). The same source can be part of multiple pairs, and therefore each pair can have a different affected status. The highest affected status reflects the highest among these. The affected status can be one of the following:
•
•
•
•
Location
Hyperlinked entry to the port with the affected parties.
Key
Unique value taken from the affected element's business tag key, if it exists.
Name
Subinterface name or business tag name of the affected element, if it exists.
Type
Business tag type.
IP Address
If the affected element is an IP interface, the IP address of the subinterface site.
Affected Status
Status of the affected pair as calculated by the client according to the rules defined in Status Values for Affected Parties.
Alarm Clear State
For each pair, an indication of the clear state of the alarm:
•
•
When an affected side is selected in the Source table, the Destination table lists all endpoints with services that have been affected between them and the entry selected in the Source table.
Note
•
•
Correlation Tab
The Correlation tab displays all the alarms that are correlated to the selected ticket. Table 9-8 describes the information that is displayed in the Correlation tab.
Advanced Tab
The Advanced tab displays the following values for the selected ticket:
•
–
–
•
–
–
•
•
Notes Tab
The Notes tab enables you to add and save notes for the selected ticket. To add text, enter text in the Notes field and click Save Notes. The new text is added to any previously existing text.
After you save a note, it appears in the Previous Notes section of the Notes tab, with the name of the user who added the note and the time it was added. If the user is an external user (for example, a Netcool user), the username will be displayed in the following format:
"Added by prime-networkUserName (as externalUserName)"The following restrictions apply to the Notes tab:
•
–
–
•
•
•
User Audit Tab
The User Audit tab enables you to see which ticket-related actions were carried out by which users, and when the action took place.
If the user is an external user (for example, a Netcool user), the username will be displayed in the following format in the User Name column:
"Added by prime-networkUserName (as externalUserName)"The following actions are reported in the User Audit tab:
•
•
•
Managing Tickets
The following topics describe how to manage tickets:
•
•
You can acknowledge, clear, remove, or clear and remove a ticket only if both of the following conditions are true:
•
•
Note
Finding Affected Elements
To locate elements affected by a ticket in Prime Network Vision, right-click the desired ticket in the ticket pane and then choose Find Affected Elements.
Depending on the number of affected elements, the results are displayed in one of the following ways:
•
•
Acknowledging/Deacknowledging a Ticket
You can acknowledge a ticket to indicate that the ticket is being handled. The change is reported to the Prime Network gateway and all open Prime Network applications. You can acknowledge multiple tickets at the same time.
If a new event is correlated to an acknowledged ticket, the ticket status becomes "Modified" and the ticket must be acknowledged again.
Acknowledged tickets can be manually deacknowledged.
To acknowledge/deacknowledge a ticket, right-click on the ticket and choose Acknowledge/Deacknowledge.
Clearing a Ticket
You can manually clear tickets when the issues they represent have been addressed. When an open ticket is cleared, the following operations are performed:
•
•
•
After a ticket is cleared, it remains open for one hour (default) before it is archived. Incoming events can be correlated to the ticket during this time, effectively re-opening the ticket. An administrator can lock tickets so that they remain cleared and no new events can be correlated to them. For more information, see the section, "Changing Oracle Database Fault Settings: Clear, Archive, and Purge Fault Data", in the Cisco Prime Network 4.0 Administrator Guide.
To clear one or more tickets, do one of the following:
•
•
To clear and remove a ticket at the same time, select Clear and Remove from the right-click menu.
If the system is set to automatically clear tickets, every minute the system scans for tickets that are not archived, not cleared, and that have not been modified in the last four minutes. If all the ticket's events that are not defined as auto-clear are cleared, the system will automatically clear the ticket.
Note
Removing a Ticket
Prime Network Vision enables you to completely remove a ticket and all of its active alarms. The ticket is archived and removed from the ticket pane. The change is reported to the Prime Network gateway and all instances of Prime Network that are open. Only tickets with a status of Cleared or Information can be removed.
Note
When a ticket is removed:
•
•
To remove one or more tickets, select the required tickets in the ticket pane, and then right-click and choose Remove.
For more information, see Filtering Tickets by Network Element.
Clearing and Removing Tickets
Clearing and removing a ticket:
•
•
•
You can clear and remove multiple tickets at the same time. This operation will attempt to modify any ticket which is not being used by other processes, such as a ticket that is being updated with new network events. In order to clear and remove a highly active ticket, you should select only that ticket. That way, the system will wait until it becomes available for an update before removing it.
To clear and remove one or more tickets, select the required tickets in the ticket pane, and then right-click and choose Clear and Remove.
Note
Impact Analysis in Prime Network
Impact analysis enables you to identify the network elements and services that are impacted by a network fault or outage. These topics explain how to manage and interpret impact analysis:
•
•
•
•
•
Prime Network offers two modes of impact analysis:
•
Note
•
Note
Status Values for Affected Parties
In automatic mode, the affected parties can be marked with one of the following status values:
•
•
•
Initially, Prime Network might identify the services as either potentially or real affected. As time progresses and more information is accumulated from the network, Prime Network updates the information to indicate which of the potentially affected parties are real or recovered.
The indications for these states are available through both the API and in the GUI.
Note
Accumulating Affected Parties
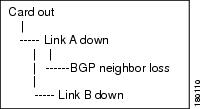
During automatic impact analysis, Prime Network automatically calculates the accumulation of affected parties. This information is embedded in the ticket along with all of the correlated faults.
In the following example, these alarm types exist in the correlation tree:
•
•
•
An event sequence is correlated to each of these alarms.
Figure 9-4 Correlation Tree Example
Prime Network identifies the affected parties for each type of alarm and accumulates the following information:
•
•
The gathered information includes the accumulation of the affected report of all the events in its own correlation tree.
For example, in Figure 9-4:
•
•
Accumulating the Affected Parties in an Alarm
If two events form part of the same event sequence in a specific alarm, the recurring affected pairs are displayed only once in the Affected Parties tab. If different affected severities are reported for the same pair, the pair is marked with the severity that was reported by the latest event, according to the time stamp.
Accumulating the Affected Parties in the Correlation Tree
If two or more alarms that are part of the same correlation tree report on the same affected pair of edgepoints and have different affected severities, the recurring affected pairs are displayed only once in the Affected Parties tab. If different affected severities are reported for the same pair, the pair is marked with the highest severity.
For example, assume that X and Y are the OIDs of edgepoints in the network, and a service is running between them. Both alarms, Link B Down and BGP Neighbor Loss, report on the pair X < > Y as affected:
•
•
The affected severity priorities are:
•
•
•
Card Out reports on X < > Y as real, affected only once.
Updating Affected Severity over Time
In some cases, Prime Network updates the affected severity of the same alarm over time because the effect of the fault on the network cannot be determined until the network has converged.
For example, a Link Down alarm creates a series of affected severity updates over time. These updates are added to the previous updates in the system database. In this case, the system provides the following reports:
•
•
•
•
This functionality is available only in the link-down scenario in MPLS networks.