-
Cisco Prime Network User Guide, 4.0
-
Preface
-
Setting Up Devices and Using the GUI Clients
-
Working with the Cisco Prime Network Vision Client
-
Viewing and Managing NE Properties
-
Device Configurations and Software Images
-
Working with Prime Network Vision Maps
-
Working with Links
-
Labeling NEs Using Business Tags
-
Tracking Faults Using Prime Network Events
-
Working with Tickets in Cisco Prime Network Vision
-
Working with Reports
-
Using Cisco PathTracer to Diagnose Problems
-
Monitoring Carrier Ethernet Services
-
Monitoring Carrier Grade NAT Properties
-
Monitoring DWDM Properties
-
Monitoring Ethernet Operations, Administration, and Maintenance Tool Properties
-
Monitoring Y.1731 IPSLA Configuration
-
IPv6 and IPv6 VPN over MPLS
-
Monitoring MPLS Services
-
Viewing IP and MPLS Multicast Configurations
-
Monitoring MToP Services
-
Viewing and Managing SBCs
-
Monitoring AAA Configurations
-
Monitoring IP Pools
-
Monitoring BNG Configurations
-
Monitoring Mobile Technologies
-
Monitoring Data Center Configurations
-
Monitoring the Cable Technologies
-
Monitoring ADSL2+ and VDSL2 Technology Enhancements
-
Icon and Button Reference
-
Glossary
-
Index
-
 Feedback
Table Of Contents
Tracking Faults Using Prime Network Events
User Roles Required to Work with Prime Network Events
Launching Prime Network Events
Viewing Events and Tickets in Cisco Prime Network Events
Working with Cisco Prime Network Events
Refreshing Cisco Prime Network Events Information
Tracking Faults Using Prime Network Events
The following topics describe how to use Cisco Prime Network Events (Prime Network Events) to view and manage faults:
•
User Roles Required to Work with Prime Network Events
•
•
•
User Roles Required to Work with Prime Network Events
This topic identifies the roles that are required to work with Prime Network Events. Prime Network determines whether you are authorized to perform a task as follows:
•
•
For more information on user authorization, see the topic on device scopes in the Cisco Prime Network 4.0 Administrator Guide.
Launching Prime Network Events
To launch Prime Network Events, choose Start > Programs > Cisco Prime Network > gateway IP address > Cisco Prime Network Events, and enter your username and password. If any client updates are available, Prime Network automatically installs them.
Note
Setting Up Your Events View
The Prime Network Events Options dialog box enables you to change various aspects of the event display in Prime Network Events. To set up your events view, choose Tools > Options from the main menu. Table 8-1 lists the available options.
Viewing Events and Tickets in Cisco Prime Network Events
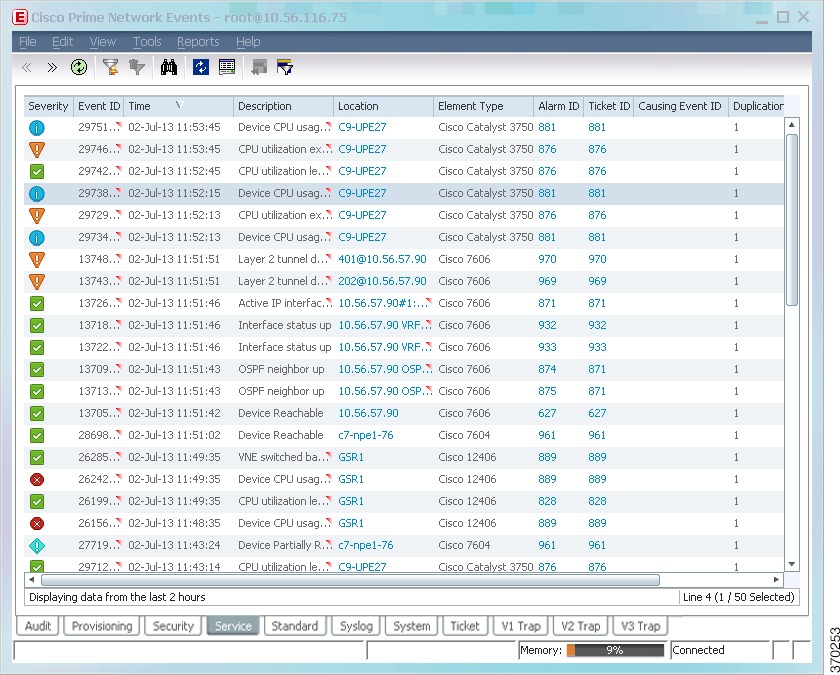
Events are displayed according to event categories, which are represented by tabs in the Cisco Prime Network Events window. Each tab displays an events list log that provides event information for the specific event category. Events can be of system type or network type. The Ticket tab displays the tickets that have been generated for correlated events. Events and tickets are sorted by date, with the latest item displayed first and the oldest item displayed last.
Note
Prime Network Events displays events for the last two hours by default. To modify the default number of hours for which events are displayed, see Setting Up Your Events View. Increasing the number of hours can affect how long it takes for the events to be displayed.
Figure 8-1 shows an example of the Prime Network Events window.
Figure 8-1 Prime Network Events Window
Event Severity Indicators
The Severity column contains color-coded icons that reflect the severity of the event. An icon appears for each ticket or event in the Prime Network Events tabs (based on its severity) as shown in Table 8-2.
Event Types and Categories
Events are grouped in tabs according to type. Each tab displays basic information about the events, including severity, event ID, time, and description. In addition, most event tabs show the Location parameter, which indicates the entity that triggered the event and is a hyperlink that can be clicked to access the entity's properties.
Note
The following categories of events can be viewed in Prime Network Events:
In addition to events, you can also view and manage tickets in Prime Network Events. See Tickets for more information.
Audit Events
Events related to all login activity and audit of other activities of the system users. The Audit tab displays the following parameters that specifically relate to audit events:
Provisioning Events
Events displayed in the Provisioning tab are events triggered during the configuration of a device, for example, execution of a configuration script.
The Provisioning tab displays the following parameters that specifically relate to provisioning events:
Security Events
Security events are related to client login and user activity when managing the system and the environment.
The Security tab displays the following parameters that specifically relate to security events:
Table 8-5 Security Events
Username
Name of the logged in user.
Originating IP
IP address of the client where the event was triggered.
For more information about the system security events displayed in this tab, see Cisco Prime Network Supported System and Security Events.
System Events
System events are related to the everyday working of the internal system and its components, such as alarm thresholds, disk space and AVMs.
The System tab displays the following parameters
Table 8-6 System Tab
Severity
Icon indicating the severity of the alarm on the event (the color and type of alarm are displayed in the Properties window Severity field). See Event Severity Indicators.
Event ID
Identifier of the event, assigned sequentially.
Time
Date and time when the event happened and was logged and recorded.
Description
Description of the event, such as "AVM 77 is shutting down. Unit = 11.22.33.444."
Location
Entity that triggered the event.
For more information about the system error and event messages displayed in this tab, see Cisco Prime Network 4.0 Supported System and Security Events.
Service Events
Service events are network events such as link down events, adaptive polling events, BGP neighbor loss events, and so on.
The Service tab displays the following parameters that specifically relate to service events.
For more information about the service alarms that are displayed in this tab, see Cisco Prime Network 4.0 Supported Service Alarms.
Syslogs
Syslogs are received from the devices by the VNEs, and syslog events are generated.
The Syslog tab displays the following parameters that specifically relate to syslog events.
V1 Traps
The V1 Trap tab displays the following parameters that relate specifically to V1 traps:
For more information about traps, see Cisco Prime Network Supported Traps.
V2 Traps
The V2 Trap tab displays the following parameters that relate specifically to V2 traps:
For more information about the Cisco IOS and Cisco IOX traps displayed in this tab, see Cisco Prime Network Supported Traps.
V3 Traps
The V3 Trap tab displays the following parameters that relate specifically to V3 traps:
Table 8-11 V3 Trap Tab
Severity
Icon indicating the severity of the alarm on the event (the color and type of alarm are displayed in the Properties window Severity field). See Event Severity Indicators.
Event ID
Calculated correlation identifier.
Time
Date and time when the event happened and was logged and recorded.
Description
Description of the event, such as "Enterprise generic trap."
Location
Hyperlink to the entity that triggered the trap.
Element Type
The type of element that triggered the root event, e.g., Cisco 7606.
Alarm ID
Identifier of the alarm associated with the event, hyperlinked to the Alarm Properties window.
Ticket ID
Sequential identifier of the ticket, hyperlinked to the Ticket Properties window.
Causing Event ID
Identifier of the causing event, hyperlinked to the Network Event Properties window.
Duplication Count
For network events, the duplication count is calculated by the VNE and pertains only to flapping events. The duplication count represents the number of noncleared events aggregated by the flapping event.
Reduction Count
For network events, the reduction count is calculated by the VNE and pertains only to flapping events. The reduction count represents the number of events that are aggregated by the flapping event.
Trap Type OID
Trap object identifier.
Translated Enterprise
Translation of the OID using the MIB. For example, an enterprise OID of .1.3.6.1.2.1.88.2 is displayed in this column as .iso.org.dod.internet.mgmt.mib-2.dismanEventMIB.dismanEventMIBNotificationPrefix.
Enterprise
Enterprise OID for the trap, representing the company or organization that is associated with the trap.
For more information about the Cisco IOS and Cisco IOX traps displayed in this tab, see Cisco Prime Network 4.0 Supported Traps.
Tickets
The Ticket tab displays detailed information specific to tickets. For information about viewing and managing tickets in Prime Network Vision, see Working with Tickets in Prime Network Vision.
Table 8-12 describes the information that is displayed in the Ticket tab.
Table 8-12 Ticket Tab
Severity
Icon indicating the severity of the alarm on the ticket (the color and type of alarm are displayed in the Ticket Properties window Severity field). See Event Severity Indicators.
Ticket ID
Sequentially assigned identifier of the ticket, hyperlinked to the Ticket Properties window.
Notes
An icon in this column indicates that a note has been added for the ticket. Click on the icon to read the note and add your own note, if necessary.
Last Modification Time
Date and time (per the database) that the ticket was last updated. Updates can result from either manual or automatic operations.
Root Event Time
Date and time that the event that created the root cause alarm of the ticket was detected.
Description
Description of the event, such as "Layer 2 tunnel down."
Location
Hyperlink to the entity that triggered the event.
Element Type
The type of element that triggered the root event, e.g., Cisco 7606.
Acknowledged
Whether the ticket is acknowledged or has been modified: Yes, No, or Modified. If a ticket changes after it has been acknowledged, it is marked as Modified. If an acknowledged ticket is deacknowledged, the status changes from Yes to No in this column.
Creation Time
Date and time that the ticket was created.
Event Count
Number of events associated with the ticket.
Affected Devices Count
Number of devices affected by the ticket (the sources of the alarm and their subsequent alarms).
Duplication Count
For tickets, the duplication count is the sum of the duplication counts of all events that are associated with the root alarm.
Reduction Count
Ticket reduction count is the sum of reduction counts of all the events that are associated to the ticket. The History tab in the Ticket Properties window displays one reduction count for each event listed. For more information, see Chapter 9 "Working with Tickets in Prime Network Vision."
Alarm Count
Total number of alarms associated with the ticket, including the root alarm.
For information about viewing ticket properties, see Viewing Ticket Properties.
Working with Cisco Prime Network Events
The following topics describe how to view, filter, and display the properties of specific events and tickets, and how to refresh and export events:
•
Viewing Event Properties
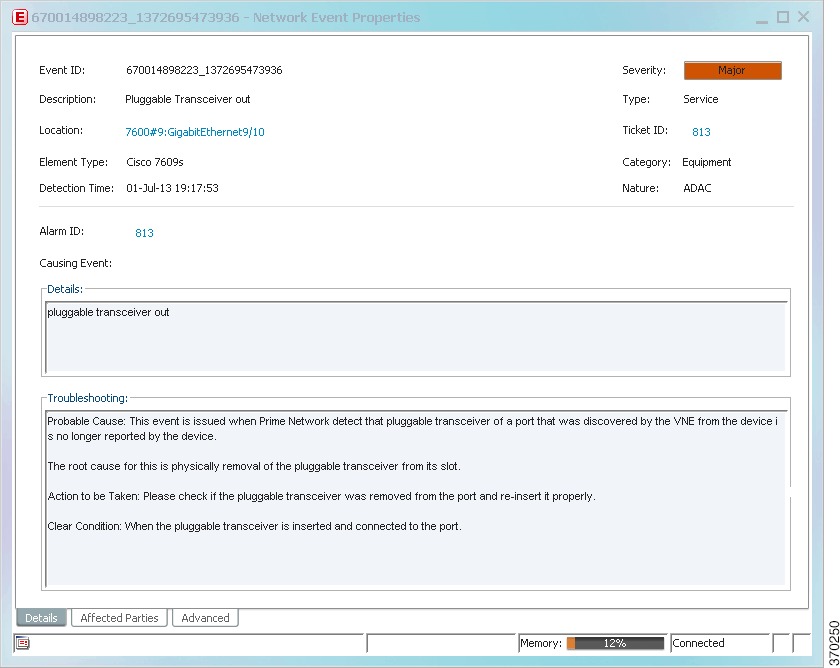
Cisco Prime Network Events enables you to view the properties of a specific event type. The Event Properties window displays detailed information about the event; for example, the severity and the number of affected parties.
Tip
To view event properties:
Step 1
Step 2
Figure 8-2 Network Event Properties Window - Details Tab
Table 8-13 describes the information that is displayed in the Details tab in the Event Properties window.
Step 3
•
•
•
•
•
•
The tabs that are displayed depend on the type of event, such as a Service event or a Provisioning event.
Table 8-16 Provisioning Tab
User Name
Name of the user who performed the provisioning operation.
Status
Status of the operation: Success or Fail.
The properties of a selected ticket can be viewed in the Ticket Properties window. For a detailed description of the Ticket tab properties, see Viewing Ticket Properties.
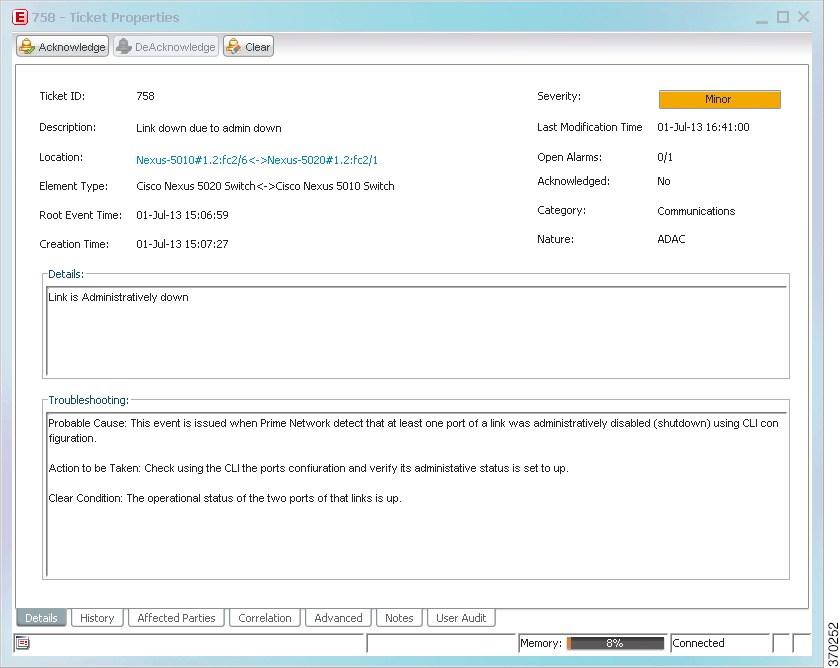
Viewing Ticket Properties
You can view the properties of a selected ticket in Cisco Prime Network Events by displaying the Ticket Properties window. To view ticket properties in Cisco Prime Network Events:
Step 1
Step 2
Figure 8-3 Ticket Properties Window - Details Tab
Table 8-19 describes the information that is displayed in the Details tab in the Ticket Properties window.
Table 8-19 Ticket Properties Window - Details Tab
Acknowledge
Acknowledges that the ticket is being handled. For more information, see Acknowledging/Deacknowledging a Ticket.
If a ticket is acknowledged, and events are correlated to it after correlation, the ticket is considered to have not been acknowledged.
This button is enabled only if the ticket is not acknowledged.
DeAcknowledge
A ticket that has been acknowledged can be deacknowledged, indicating that it still needs to be handled.
Clear
Requests the Prime Network system to remove the faulty network element from the Prime Network networking inventory. In addition, it sets the ticket to Cleared severity or status and automatically changes the acknowledged status of the ticket to Yes. For more information, see Clearing a Ticket.
This button is enabled only if the severity of the alarm is higher than Cleared or Normal.
Ticket ID
Sequentially assigned identifier of the ticket.
Severity
Severity of the ticket, indicated by color and text label.
Description
Description of the ticket.
Last Modification Time
Date and time (per the database) that the ticket was last updated. Updates can result from either manual or automatic operations.
Location
Hyperlink to the entity that triggered the event.
Note
Open Alarms
Number of open alarms out of all alarms, such as 3/4.
Element Type
The type of device that triggered the root event.
Root Event Time
Date and time that the event that created the root cause alarm of the ticket was detected.
Acknowledged
Whether or not the ticket has been acknowledged: Yes or No.
Creation Time
Date and time when the ticket was created.
Device Time
The time zone of the device.
Note
Category
The category of the fault, which can be any one of the following:
•
•
•
•
•
•
Nature
The nature of the fault, which can be one of the following:
•
•
Details
Detailed description of the ticket.
Troubleshooting
The probable cause of the last event in the root alarm, the action to be taken to rectify the problem and the clearing condition.
Note
Step 3
Table 8-20 Ticket Properties Window - Additional Tabs
History
Contains the history of the ticket, including all the events. For more information, see History Tab.
Affected Parties
The services (affected pairs) that are potentially affected (potential impact analysis) by the ticket. For more information, see Affected Parties Tab.
Correlation
Displays all alarms that are correlated to the selected ticket. For more information, see Correlation Tab.
Advanced
The number of affected devices, correlations, duplications, and reductions for the selected ticket. In addition, it provides any other additional information available about the ticket. For more information, see Advanced Tab.
Notes
Enables you to add and save notes for the selected ticket. The Notes tab is not available for tickets that have been archived. For more information, see Notes Tab.
User Audit
Enables you to see which ticket-related actions were carried out by which users, and when the action took place. For more information, see User Audit Tab.
Refreshing Cisco Prime Network Events Information
Cisco Prime Network Events displays current information in lists in each tab. While you view a list, the information is not updated unless you manually refresh the list or activate autorefresh. The default autorefresh setting is 60 seconds and can be adjusted (see Adjusting the Prime Network Vision GUI Client Settings). Your filter settings remain intact.
Table 8-21 shows the refresh buttons.
To manually refresh a list, choose View > Refresh from the main menu. To automatically refresh a list, click Auto Refresh in the toolbar.
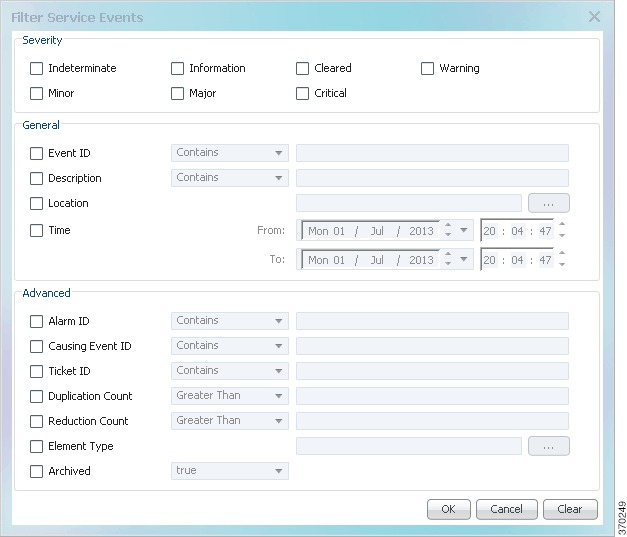
Filtering Events
The Filter Events dialog box allows you to filter events according to a number of criteria including severity, identifier, time stamp, description, location, and category-specific information.
You may also use the filter to search for information in the database.
The Filter icon toggles to indicate that a filter has been applied.
The following settings in the Cisco Prime Network Events Options dialog box also affect your filters:
•
•
For more information, see Adjusting the Prime Network Vision GUI Client Settings.
See the following topics for more information about filtering events:
For information about filtering tickets, see Filtering Tickets by Criteria.
Defining Filters
To define a filter:
Step 1
Figure 8-4 Filter Events Dialog Box - Service Events
Step 2
a.
b.
c.
Step 3
Removing Filters
To remove a filter:
Step 1
Step 2
Step 3
Exporting Displayed Data
Cisco Prime Network Events enables you to export the currently displayed data from the Cisco Prime Network Events table according to the criteria defined in the Cisco Prime Network Events Options dialog box. You can then import and view at a later time.
To export a table to a file:
Step 1
Step 2
Step 3
Step 4