Table Of Contents
Creating Reports
Overview to Report Creation
Creating Reports
Editing Reports
Exporting Reports
Deleting Reports
Creating Reports
The following topics provide an overview to Cisco Prime Analytics reports.
•
Overview to Report Creation
•
Creating Reports
•
Editing Reports
•
Exporting Reports
•
Deleting Reports
Overview to Report Creation
For reports, Prime Analytics has implemented Saiku Reports. See http:/www.analytical-labs.com. In general, Saiku Reports are intuitive and easy to create. The Prime Analytics report generation process includes the following steps:
1.
Connect to a data source. This is usually a database, although you can also pull data from a flat file.
2.
Constrain the data with a query.
3.
Arrange the data elements in the report workspace
4.
Apply report formatting; this can be through application of a report template or by formatting text and background color manually in your report.
5.
Add formulas or calculated fields using data retrieved from your query.
6.
Save your report in one of multiple formats including CSV, text, PDF, Excel, and many others.
Your report will consist mostly of data retrieved from a database query that you will create through the data source wizard or by hand. After you have a dataset, you can further constrain it to show specific details, and then move on to report layout and design.
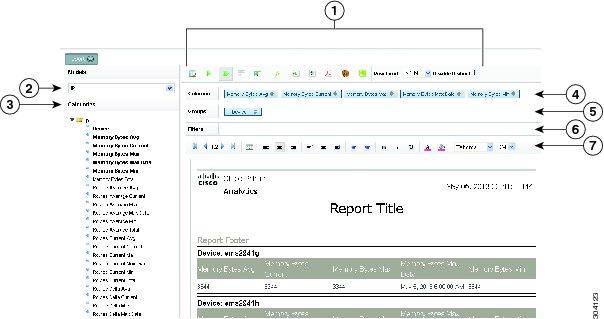
In general, you will find report creation fairly intuitive. Figure 6-1 shows the report workspace. Report workspace elements include:
•
Report toolbar—Provides report actions including global display and report export options.
•
Model—The data source model used for the report.
•
Categories—The data source model categories you can choose to include in the report.
•
Columns—The report columns, selected from the data source categories.
•
Groups—Allows you to group your report based on a model category.
•
Filter—Allows you to filter your report based on a model category.
•
Report format toolbar—Provides options for formatting your report, including the ability to apply a report template.
Figure 6-1 Reports Workspace
1
|
Report toolbar
|
5
|
Groups
|
2
|
Models
|
6
|
Filters
|
3
|
Categories
|
7
|
Format toolbar
|
4
|
Columns
|
|
|
Creating Reports
To create a report, complete the following steps:
Step 1
Log into the Prime Analytics user console. For procedures, see Logging Into the User Console.
Step 2
From the File menu, choose Manage > Data Source.
Step 3
Verify the data source you want to use for the report is displayed. If not, you must create it. For procedures, see Chapter 4 "Setting Up the Data Sources."
Step 4
From the File menu, choose New > Report.
A new Report tab is displayed.
Step 5
Save your report:
a.
From the File menu, choose Save As.
b.
In the Filename field, enter the report name.
c.
In the Location field, enter the directory where you want to store the report or double-click the directories to navigate to the directory you want.
d.
Click Save.
Step 6
Under Models, choose your report data source.
The available report categories are displayed.
Step 7
Click the categories you want included in your report.
The categories are added to the Columns space and the category text is placed in bold text.
Step 8
Click a column.
Step 9
In the Setup Column column_name dialog box, modify any of the following parameters:
•
Display Name—Edits the column name displayed in the report.
•
Format—Adds text or numbers before or after the report data.
•
Hide Repeating Values—If checked, hides repeating column values.
•
Hide on Report—If checked, hides the column from display in the report. This parameter is useful if you want to prepare multiple report versions and temporarily hide columns.
•
Aggregation—Sets the aggregation method used. The methods displayed depend on the column type. For numbers, the following aggregation methods are available:
–
Count Distinct
–
Maximum
–
Average
–
Sum
–
Count
–
Minimum
•
Summary—Adds a summary cell to the column and defines the summary method, which are the same as listed for Aggregation.
Step 10
After you complete the column edits, click Save.
Step 11
Repeat Steps 8 through 10 for each report column.
Step 12
If you want to group your columns, drag the category you want to use to the Group space.
For example, if you want to group columns by device, you would move the Device column to the Group space. The report will change to reflect your group
Step 13
If needed, repeat Steps 8 through 10 to modify parameters of the category column.
Step 14
If you want to filter your report, drag the category you want to use to the Filter space.
Step 15
If needed, repeat Steps 8 through 10 to modify parameters of the filter column.
Step 16
If needed, add a calculated column to your report:
a.
On the report toolbar, click Add Calculated Column.
b.
Enter the column name and the formula you want to use.
c.
As needed, complete other column parameters listed in Step 9.
d.
Click Save.
After you add your report columns and set up any groups, filters, and calculated columns, you can begin formatting the report.
Step 17
Double-click the Report Title text and type the name of your report.
Step 18
As needed, modify the title format using the format toolbar:
•
Horizontal Alignment: left, centered, right
•
Vertical Alignment: top, middle, bottom
•
Padding: right or left
•
Text: bold, italic, underlining, color, background color, font type, and size.
Note
All format changes except text and background color are applied immediately. To modify the text and background color, click the Text or Background Color tool, choose the color on the color panel, then click the small circle at the lower bottom of the color panel to apply the color.
Step 19
Double-click Report Footer and repeat Step 17 through 18 to format the report footer.
You can format the report body in one of two ways:
•
You can highlight individual table cells, rows, or columns and use the format toolbar to apply the formatting, or,
•
You can apply a template and global report settings.
Step 20
To apply a template your report,
a.
On the report format toolbar, click Select Template.
b.
Under Document Template, scroll through the templates and select the one you want to apply. By default, the following templates are provided:
–
Saiku_small
–
jade_4_left_alignment_grid
–
cobalt_4_left_alignment_grid
–
maple_4_left_alignment_grid
–
nickel_4_left_alignment_grid
c.
Under Page Settings, choose the page setting you want to apply, and indicate whether you want vertical or horizontal orientation. Available page settings are based on ANSI, ISO, and other standards organizations.
d.
Under Page Margins, modify the page margins, if needed. The default is 18 for all margins.
e.
Click Save.
Your template and global page settings are applied.
Step 21
If needed, you limit the number of rows that are displayed by clicking Row Limit and choosing one of the following row limits: None, 10, 100, 1000.
Step 22
After completing your report setup, from the File menu, choose Save.
Editing Reports
Editing reports follows much the same process as report creation. To edit a report:
Step 1
Log into the Prime Analytics user console. For procedures, see Logging Into the User Console.
Step 2
From the File menu, choose Manage > Edit.
Step 3
In the Open dialog box, navigate to the directory containing the report you want to edit, select it, then click Open.
The report is displayed with the tab name: Editing report_name.
Step 4
Complete Steps 8 through 21 of the "Creating Reports" procedure to edit any report items and layout.
Step 5
When finished, from the File menu, choose Save.
Exporting Reports
You can export reports into multiple formats. To export a report:
Step 1
Log into the Prime Analytics user console. For procedures, see Logging Into the User Console.
Step 2
From the File menu, choose Manage > Edit.
Step 3
In the Open dialog box, navigate to the directory containing the report you want to export, select it, then click Open.
The report is displayed with the tab name: Editing report_name.
Step 4
On the report toolbar, click one of the following options:
•
Export XLS—Saves your report in Excel format to a directory of your choosing.
•
Export CSV—Saves your report in CSV format to a directory of your choosing.
•
Export PDF—Saves your report in PDF format to a directory of your choosing.
•
Export CSV—Saves your report in Excel format to a directory of your choosing.
•
Export PRPT—Saves your report in Saiku report format to the Prime Analytics project directory of your choosing. A username and password is required.
•
Export CDA—Saves your report in Pentaho Community Database Access format to the Prime Analytics project directory of your choosing.
Deleting Reports
To delete a report:
Step 1
Log into the Prime Analytics user console. For procedures, see Logging Into the User Console.
Step 2
In the Browse directory, navigate to the directory containing the report you want to delete.
Step 3
Choose the report, click the Options tool above the report file name and choose Delete.
Step 4
On the confirmation, click OK.