Cisco Prime Analytics 1.0 User Guide
Creating an Analysis

Table Of Contents

Creating an Analysis

Overview to Analytics

Creating an Analysis

Editing an Analysis

Exporting an Analysis

Deleting an Analysis


Creating an Analysis


Prime Analytics helps you visualize data trends and reveal useful information about your network by creating static reports from an analysis data source, traversing an analytics cube through an analytics report, showing how data points compare by using charts, and monitoring the status of certain trends and thresholds with dashboards.

The following topics tell you how to create an analysis in Cisco Prime Analytics:

Overview to Analytics

Creating an Analysis

Editing an Analysis

Exporting an Analysis

Deleting an Analysis

Overview to Analytics

Prime Analytics analytics is based on Mondrian, an Online Analytical Processing (OLAP) server that enables you to analyze large data volumes in real-time. Mondrian queries are written in the Multidimensional Expressions (MDX) language. MDX queries data contained in a relational database (RDBMS) and presents results in multidimensional formats called cubes.

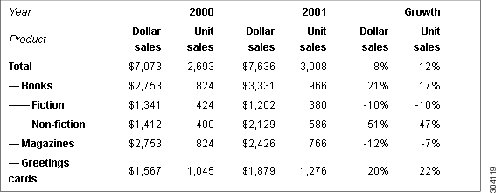
While relational databases store data in rows and columns, multidimensional datasets consist of axes and cells. For example, in Figure 7-1, the rows axis consists of all Product members: Books, Fiction, Non-fiction, and so forth. The columns axis consists of the cartesian products 2000 and 2001, and the calculation, Growth, plus the measures Unit sales and Dollar sales. Each cell represents sales of a product category in a particular year; for example, the dollar sales of Magazines in 2001 were $2,426.

Multidimensional dataset members are not always relational column values. Total, Books and Fiction are members at successive levels in a hierarchy; each is rolled up to the next. Even though Growth is at the same level as the years, 2000 and 2001, Growth is a calculated member, which introduces a formula for computing cells from other cells.

Figure 7-1 OLAP Dataset

The dimensions used in this example—products, time, and measures—are three of many dimensions by which you can categorize and filter datasets. The collection of dimensions, hierarchies and measures is called a cube.

To prepare an analysis, you consolidate data from multiple sources into one source and optimize it for the metrics you want to analyze. You then create an analysis schema to describe the data. You improve that schema so that it meets your users needs; and create aggregation tables for frequently computed views.

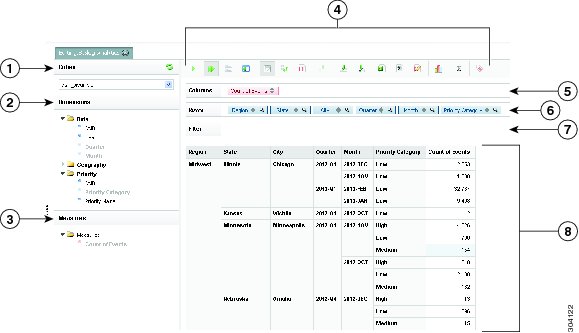
Prime Analytics has implemented Saiku analytics to display your analytics data. Figure 7-2 shows the Analytics workspace with the sample application, Syslog Analytics, displayed. Workspace elements include:

Cube—The multidimensional data source selected for analytics display.

Dimensions—The data sets comprising the cube. Each dimension is an individual, non-overlapping data element. In the example, dimensions are data, geography, and priority.

Measures—Numeric values that summarize various aggregation levels. In the example, the Count of Events is the measure.

Analytics toolbar—Provides actions that allow you to manage the analysis, including different ways to display the analysis and export the data to other formats.

Columns—The columns of the cube.

Rows—The rows of the cube.

Filter—The attribute used to filter the data.

Analytics work area—The display of the cube dimensions, measures, columns, and rows.

Figure 7-2 OLAP Dataset

1

Cubes

5

Columns

2

Dimensions

6

Rows

3

Measures

7

Analytics data

4

Analytics toolbar

8

Analytics work area


Creating an Analysis

To create an analysis, complete the following steps:


Step 1 Log into the Prime Analytics user console. For procedures, see Logging Into the User Console.

Step 2 From the File menu, choose Manage > Data Source.

Step 3 Verify the cube you want to use for the report is displayed. If not, you must create it. For procedures, see Chapter 4 "Setting Up the Data Sources."

Step 4 From the File menu, choose New > Analysis.

A new Analytics tab is displayed.

Step 5 Save your analysis:

a. From the File menu, choose Save As.

b. In the Filename field, enter the analysis name.

c. In the Location field, enter the directory where you want to store the analysis or double-click the directories to navigate to the directory you want.

d. Click Save.

Step 6 Under Cubes, choose the cube you want to use as the analysis data source.

The available analytics dimensions and measures are displayed.

Step 7 Click the dimensions you want included in your analysis.

The dimensions are added to the Columns and Rows spaces and the dimension text is placed in faint text.

Step 8 Continue adding dimensions and measures to your analysis. If you want to filter your report, drag the dimension you want to use to the Filter space.


Note The analysis must have a minimum of one measure.


Step 9 As needed, Analytics toolbar actions to modify your analysis and its display:

Run Query—Runs the analysis query manually.

Automatic Query—If selected, automatically runs the query. This tool is a toggle; click to turn on, click to turn off.

Toggle Fields—Displays or hides the Columns, Rows, and Filter spaces.

Toggle Sidebar—Displays or hides the Cubes, Dimensions, and Measures tree.

Swap Axis—Rotates the analysis axis.

Show MDX—Displays the analysis MDX code in a popup window.

Query Scenario—Is not available in this release.

Cell drill-through options allow you to drill down a cell containing an analytics measure. Options include:

Cell Drill-Through on Cell—Allows you to drill through on individual analytics cells.

Export Drill-Through on Cell to CSV—Allows you to drill through on individual cells to the CSV.

Export XLS—Exports the analysis as Excel file.

Export CSV—Exports the analysis in CSV format.

Switch to MDX Mode—Displays the MDX code in an area above the analysis.

Basic Statistics—Displays the analysis minimum, maximum, sum, average, and standard deviation while hiding other analysis data.

Tags—Allows you to add tags to individual cells. Select a cell, click Tag, Enter the tag text, then click Save. Clicking the tab displays the cell data. To remove the tag, click the small x just above the tag.

Toggle Chart—Switches the analysis to graphic display. Five visual representations are available:

Bar

Stacked Bar

Line

Pie

Heat Grid

Step 10 After completing your analysis, from the File menu, choose Save.


Editing an Analysis

Editing an analysis follows much the same process as analysis creation. To edit an analysis:


Step 1 Log into the Prime Analytics user console. For procedures, see Logging Into the User Console.

Step 2 From the File menu, choose Manage > Edit.

Step 3 In the Open dialog box, navigate to the directory containing the analysis you want to edit, select it, then click Open.

The analysis is displayed with the tab name: Editing analysis_name.

Step 4 Complete Steps 6 through 10 of the "Creating an Analysis" procedure to edit any analysis items and layout.

Step 5 When finished, from the File menu, choose Save.


Exporting an Analysis

You can export your analysis into an Excel spreadsheet or as a text file in CSV format. To export an analysis:


Step 1 Log into the Prime Analytics user console. For procedures, see Logging Into the User Console.

Step 2 From the File menu, choose Manage > Edit.

Step 3 In the Open dialog box, navigate to the directory containing the analysis you want to export, select it, then click Open.

The analysis is displayed with the tab name: Editing analysis_name.

Step 4 On the Analytics toolbar, click one of the following options:

Export XLS—Saves your analysis in Excel format to a directory of your choosing.

Export CSV—Saves your analysis in CSV format to a directory of your choosing.


Deleting an Analysis

To delete an analysis:


Step 1 Log into the Prime Analytics user console. For procedures, see Logging Into the User Console.

Step 2 In the Browse directory, navigate to the directory containing the analysis you want to delete.

Step 3 Choose the analysis, click the Options tool above the analysis file name and choose Delete.

Step 4 On the confirmation, click OK.