-
User Guide for the Cisco Mobile Wireless Transport Manager 6.0
-
About this Guide
-
Overview
-
Configuring Security
-
Setting Up Your Server
-
Getting Started
-
Basic Operations
-
Understanding Basic Object Functions
-
Managing Views
-
Understanding Detailed Object Functions
-
Managing Events
-
Viewing Network Topology
-
Accessing Data from the Web Interface
-
Managing ITP Reports
-
Editing an ITP Route Table File
-
Editing an ITP Global Title Translation Table
-
Editing ITP MLR Address Table Files
-
Object Map Reference
-
Command Reference
-
FAQs
-
Troubleshooting MWTM and the Network
-
Status Definitions
-
MIB Reference
-
Trap Reference
-
Configuring MWTM to Run with Various Networking Options
-
Archived Reports File Formats
-
MWTM Ports
-
Open Source License Notices for the Cisco Mobile Wireless Transport Manager
-
Glossary
-
Index
-
 Feedback
Table Of Contents
Accessing Data from the Web Interface
Accessing the MWTM Web Interface
Overview of the MWTM Web Interface
MWTM Web Interface Navigation Tree
MWTM Web Interface Content Area
Downloading the MWTM Client from the Web
Download the Linux Client (Unsupported)
Accessing Software Updates and Additional Information
Viewing the MWTM Technical Documentation
Displaying the Administrative Page
Viewing System Information for the MWTM
Viewing MWTM User Action Messages
Viewing All Archived MWTM Messages
Viewing System Status Information
Viewing the Event Automation Log
Viewing Web Configuration Properties
Viewing Trap Forwarding Properties
Displaying Objects within a View
Displaying RAN-O Historical Statistics
Displaying Performance Statistics
Displaying Shorthaul Performance Statistics
Displaying Backhaul Performance Statistics
Displaying Shorthaul Error Statistics
Displaying Backhaul Error Statistics
Generating RAN Data Export Files
Accessing Data from the Web Interface
This chapter provides information about accessing Cisco Mobile Wireless Transport Manager (MWTM) data from the MWTM web interface by using a web browser. This chapter includes:
•
Accessing the MWTM Web Interface
•
•
•
•
Accessing the MWTM Web Interface
The home page of the MWTM web interface is the first window to appear when you launch the MWTM web interface.
To access the MWTM web interface, use one of these methods:
•
Note
•
The MWTM Home page window opens in the browser window. For details about the Home page, see Displaying the Home Page.
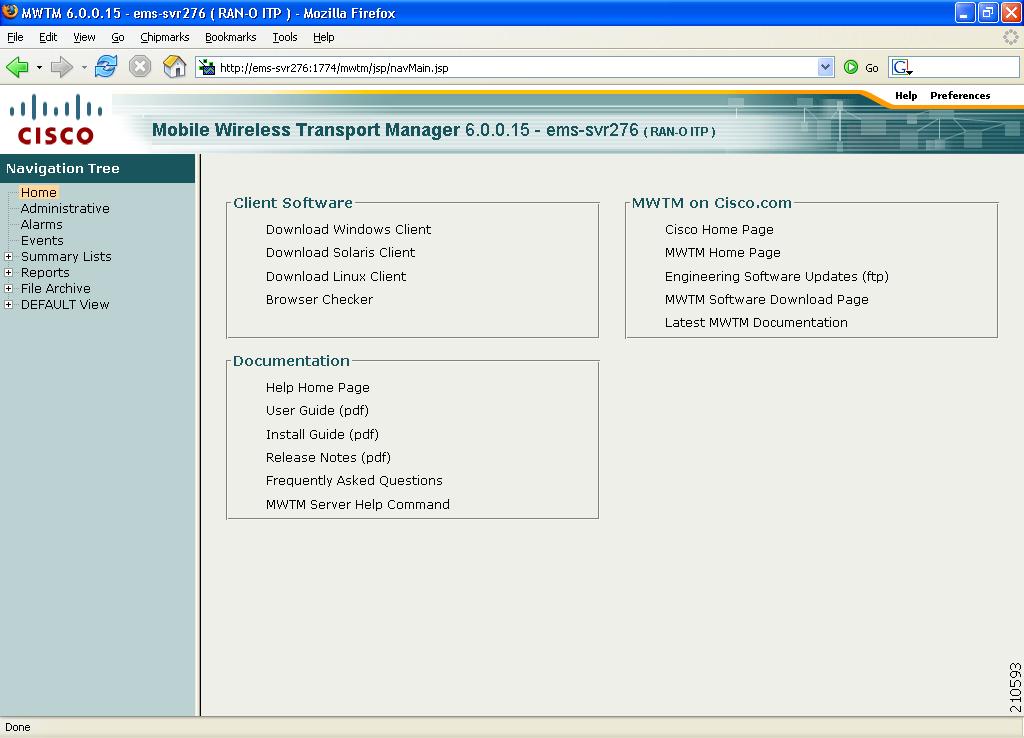
Overview of the MWTM Web Interface
The MWTM web interface shows basic information about the events and objects that the MWTM manages.
Figure 11-1 MWTM Web Interface
The MWTM web interface shows these panes:
Title Bar
Shows:
•
•
•
•
•
Navigation Tree
In the left pane, shows a tree of information organized by categories (see MWTM Web Interface Navigation Tree).
Content Area
In the right pane, shows detailed information about the object selected in the navigation tree (see MWTM Web Interface Content Area).
MWTM Web Interface Navigation Tree
You can easily navigate the features of the MWTM web interface by using the navigation tree in the left pane. To view detailed information about a selection in the navigation tree, click the item in the tree. The content area in the right pane shows details about the selected item. A plus (+) or minus (-) just to the left of the item indicates whether the item has subtending items under its domain.
The MWTM automatically updates the navigation tree when changes occur to discovered nodes or to the network. When any changes occur in the MWTM client navigation tree, the MWTM web interface reflects these changes in its navigation tree. For example, if you delete a node in the MWTM client, the MWTM web interface removes that node from its navigation tree.
Note
The MWTM web interface navigation tree contains:
Home
Shows links to MWTM client software, Cisco documentation, and information about the MWTM on the Cisco web (see Displaying the Home Page).
Administrative
Shows MWTM system information including messages, logs, status, and properties (see Displaying the Administrative Page).
If MWTM User-Based Access is enabled, only users with authentication level 3 (Network Operator) and higher can see all options. Users of all other levels see only the System Information and System Status panes.
Alarms
Shows alarms (see Displaying Alarms).
Events
Shows information about the events delivered by the MWTM event logger and event processor for events that the MWTM event logger and event processor deliver for all objects in the current network view (see Displaying Events).
Summary Lists
Shows summaries of all objects that the MWTM manages (see Displaying Summary Lists).
Reports
Shows:
•
•
If MWTM User-Based Access is enabled, only users with authentication level 4 (Network Administrator) and higher can see the Reports menu.
DEFAULT View
Shows a current list of nodes in the DEFAULT view (see Displaying Objects within a View).
MWTM Web Interface Content Area
The content area of the MWTM client interface is fully described in MWTM Client Content Area, page 4-26. That description also applies to the web interface. Additional navigational features that appear only in the web interface include:
Customizing the Date Range
Some windows require that you select date ranges for generating historical charts (see Displaying RAN-O Historical Statistics). Standard date ranges (for example, Last 24 Hours or Last 7 Days) are available from a drop-down menu. However, if you want to customize the date range:
Step 1
Step 2
a.
b.
Note
Step 3
The MWTM web interface generates a report for the specified time period.
Using the Toolbar
The web interface toolbar provides these context-sensitive tools depending on the object that you select in the navigation tree:
Modify event filter
Opens the Event Filter dialog box. You can create a filter to display only the events in which you are interested (see Setting an Event Filter, page 9-8).
Remove filter
Applies or removes a filter that you created.
Customize Date and Time Range
Opens the Customize Date and Time Range dialog box (see Customizing the Date Range).
Graph Series Editor
Opens the Graph Series Editor dialog box, which provides a check box for each shorthaul that is associated with the selected RAN backhaul. To display a data series, check the check box. To hide a series, uncheck the check box.
The MWTM displays no more than 12 series by default. To change this default setting, see Display Series Dialog Box, page 8-129.
Run
Runs the report type for the selected duration.
Export
Exports the raw chart data to a report with comma-separated values (CSV file). You can save this file to disk or open it with an application that you choose (for example, Microsoft Excel).
>
Advances the display to the next page of information.
>>
Advances the display to the last page of information.
<
Advances the display to the previous page of information.
<<
Advances the display to the first page of information.
Data Range
Label that shows the selected time range for the historical statistics.
Duration
Drop-down list of default time ranges. Select one of these options, then click the Run tool. To specify a nondefault time range, click the Customize Date and Time Range tool.
Page Size
Drop-down list of different page sizes (the number of table rows in the display). Click the drop-down arrow to select a different value. The value that you select becomes the default page size for all pages in the web interface.
The title bar displays the current page and total number of table entries.
Status Refresh Interval
Allows you change the default refresh interval of 180 seconds. Enter a value between 180 and 900 seconds.
Note
Slow Poller Interval
Allows you to change the default slow poller interval of 60 seconds. Enter a value between 60 and 300 seconds.
Note
Type
Drop-down list of different types of reports that you can generate.
For descriptions of the different report types, see:
•
•
•
Displaying the Home Page
The MWTM web interface Home page provides access to MWTM client software, Cisco documentation, and information about the MWTM.
To access the Home page of the MWTM web interface, click Home under the navigation tree in the left pane.
The content area in the right pane shows these GUI elements:
Client Software
Download Windows Client
Download Solaris Client
Download Linux Client
Browser Checker
Shows the download instructions for the:
•
•
•
•
For details, see Downloading the MWTM Client from the Web.
MWTM on Cisco.com
Cisco Home Page
MWTM Home Page
Engineering Software Updates (FTP)
MWTM Software Download Page
Latest MWTM Documentation
Shows hyperlinks to:
•
•
•
•
•
For details, see Accessing Software Updates and Additional Information.
Documentation
Help Home Page
User Guide
Install Guide
Release Notes
Frequently Asked Questions
MWTM Server Help Command
Shows:
•
•
–
–
–
•
•
For details, see Viewing the MWTM Technical Documentation.
1 To access the latest versions, go to the parent index for Cisco MWTM user documents: http://www.cisco.com/en/US/products/ps6472/tsd_products_support_series_home.html
Downloading the MWTM Client from the Web
You can access the MWTM client installation software for Linux (unsupported), Solaris, and Windows from the MWTM web interface Home page. This access is useful if you do not have the CD-ROM, or if you prefer to download the software by using your web browser. Once you have downloaded the MWTM client installation software to your workstation, you must install the software on your local system.
For more information about installing the MWTM client software by using a web server, see the following chapters in the Installation Guide for the Cisco Mobile Wireless Transport Manager 6.0:
•
•
•
Download the Solaris Client
To access the MWTM Client for Solaris page, select Download Solaris Client.
The web interface shows the supported Solaris versions and instructions for downloading the Solaris client. See the Installation Guide for the Cisco Mobile Wireless Transport Manager 6.0 for a detailed procedure.
To start the client after installation, add the /opt/CSCOsgmClient/bin subdirectory to your path, then enter the mwtm client command from the command line.
Download the Windows Client
To access the MWTM Client for Windows page, select Download Windows Client.
The web interface shows supported Windows versions and instructions for downloading the Windows setup program. After downloading the setup program onto your desktop or other Windows directory, double-click the setup.exe icon to start the setup program and launch the installation wizard. See the Installation Guide for the Cisco Mobile Wireless Transport Manager 6.0 for detailed procedures.
To start the client after installation, launch it from the Windows Start menu or double-click the MWTM Client icon on your desktop.
Download the Linux Client (Unsupported)
To access the MWTM Client for Linux page, select Download Linux Client.
Note
The web interface shows the supported Linux versions and instructions for downloading the Linux client. See the Installation Guide for the Cisco Mobile Wireless Transport Manager 6.0 for a detailed procedure.
To start the client after installation, add the /opt/CSCOsgmClient/bin subdirectory to your path, then enter the mwtm client command from the command line.
Checking Your Browser
Note
To check your browser and screen settings, select Browser Checker.
The Browser Checker window contains:
Accessing Software Updates and Additional Information
You can access this information about the MWTM from the MWTM web interface Home page. To:
•
•
•
•
•
Note
Viewing the MWTM Technical Documentation
From the MWTM web interface Home page, you can view this MWTM technical documentation. To view the:
•
•
•
•
•
•
Caution
Displaying the Administrative Page
The MWTM web interface Administrative page provides access to MWTM system information, including messages, logs, status, and properties.
To access the Administrative page of the MWTM web interface, click Administrative under the navigation tree in the left pane. The right pane displays the information indicated in Table 11-1.
Note
Table 11-1 Administrative Home Page Information
System Information
•
•
•
•
•
•
•
•
–
–
For details, see Viewing System Information for the MWTM.
System Messages
•
•
•
•
Shows tabular information about different types of system messages.
For details, see Viewing System Messages.
System Status
•
•
•
•
Shows the output of these system commands:
•
•
•
•
For details, see Viewing System Status Information.
System Logs
•
•
•
•
•
•
•
•
Shows the contents of these system logs:
•
•
•
•
•
•
•
•
For details, see Viewing System Logs.
Properties
•
•
•
•
•
Shows the contents of these system property files:
•
•
•
•
•
For details, see Viewing Properties.
Viewing System Information for the MWTM
You can view this MWTM system information from the Administrative page:
•
To access the MWTM README page, select README from the Administrative page.
•
–
–
–
–
–
–
–
To access the MWTM ITP OS README page, select ITP OS README from the Administrative page.
•
–
–
–
To access the MWTM RAN-O OS README page, select RAN-O OS README from the Administrative page.
•
Each MIB appears in a list as a clickable link. You can open or download the contents of the MIB by clicking the MIB name. See Appendix F, "MIB Reference," for a complete list and high-level description of each supported MIB.
To access the MIBs page, select MIBs from the Administrative page of the MWTM web interface.
Viewing System Messages
You can view these MWTM system messages from the Administrative page:
Note
•
•
Viewing Info Messages
The System Messages: Last number Info Messages page shows informational messages in the MWTM system log. These messages can be useful when diagnosing and correcting MWTM operational problems.
To access this page, click Info Messages from the Administrative page, or Info from the web page menu bar, if visible.
The Last Info Messages table contains:
Viewing Error Messages
The System Messages: Last number Error Messages page shows error messages stored in the MWTM system log. These messages can be useful when diagnosing and correcting MWTM operational problems.
To access this page, click:
•
•
The Last Error Messages table contains:
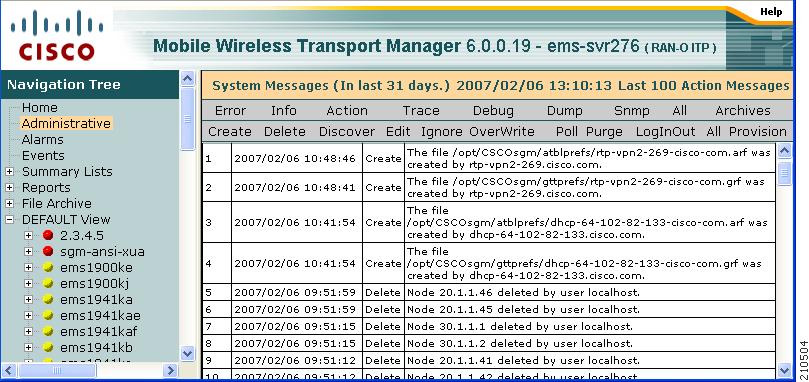
Viewing MWTM User Action Messages
The System Messages: Last number Action Messages page shows user action messages stored in the MWTM system log. These messages can be useful when diagnosing and correcting MWTM operational problems, and when monitoring audit trails of user actions.
To access this page, use one of these procedures. Click:
•
•
The MWTM shows the System Messages: Last number Action Messages page.
Figure 11-2 System Messages: Last X Action Messages Page
The System Messages: Last number Action Messages page has these sections:
Last Action Messages Menu
By default, the MWTM shows action messages of all classes on the System Messages: Last number Action Messages page. However, the MWTM provides menu options that enable you to display only messages of a specific class on the page.
The Last Action Messages menu contains:
Last Action Messages Table
The Last Action Messages table contains:
Viewing All Archived MWTM Messages
The System Message Archives: All Messages page shows all archived messages in the MWTM system logs, including:
•
•
•
•
•
•
•
To access the System Message Archives: All Messages page, use one of these options. Click:
•
•
On the System Message Archives: All Messages page, messages are archived by timestamp. Each archived file contains all MWTM system messages for a single session for the server to which you are connected, and which is currently running the MWTM server. (If you restart the server, the MWTM creates a new file.)
To view archived messages, click a timestamp. The System Messages Archive: Last number All Messages page appears, which shows all messages that were in the system log at the specified timestamp.
Note
The Last All Messages table contains this information (without column headers):
Viewing System Status Information
You can view this MWTM system status information from the Administrative page:
Viewing System Status
To access system status information, click System Status from the Administrative page. (The MWTM might take a few seconds to display this page.) This page shows the status of all MWTM servers, local clients, and processes.
Viewing System Versions
To access version information, click System Versions from the Administrative page. (The MWTM might take a few seconds to display this page.) This page shows version information for all MWTM servers, clients, and processes.
Viewing Connected Clients
To access connected client information, click Connected Clients from the Administrative page. This page lists all MWTM clients that are currently connected to the MWTM server. It also lists all Solaris and Linux users that are logged in to the MWTM server.
Viewing User Accounts
To access user account information, click User Accounts from the Administrative page. This page shows information about all user accounts that have been defined for the MWTM server. If no user accounts have been defined, the MWTM shows this message:
User Database is EmptyThe user accounts page displays the output of the mwtm users command. For example:
/opt/CSCOsgm/bin/mwtm usersUser Name Last Login Level Name & Number Status-----------------------------------------------------------------User1 Wed Jan 17 14:03:13 EST 2007 System Admin 5 [Account Enabled]User2 Unknown System Admin 5 [Account Enabled]User3 Wed Jan 17 13:43:30 EST 2007 System Admin 5 [Account Enabled]User Based Access Protection is Enabled.Authentication type = localThe the mwtm users command output contains:
User Name
The MWTM user for whom a User-Based Access account has been set up.
Last Login
Date and time the user last logged in to the MWTM.
Level Name & Number
Authentication level and number for the user. Valid levels and numbers are:
•
•
•
•
•
Status
Current status of the user's account. Valid status settings are:
•
•
–
–
–
Viewing System Logs
From the Administrative page, you can view:
•
Viewing the Console Log
The Console Log shows the contents of the MWTM system console log file for the server to which you are connected, and which is currently running the MWTM. The console log file contains unexpected error and warning messages from the MWTM server, such as those that might occur if the MWTM server cannot start. It also provides a history of start-up messages for server processes and the time each message appeared.
To access the Console Log, click Console Log in the System Logs pane of the Administrative page. You can also view the Console Log with the mwtm console command.
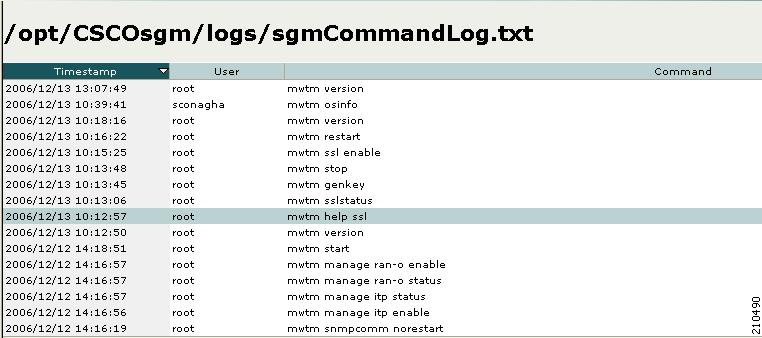
Viewing the Command Log
The Command Log shows the contents of the MWTM system command log file for the server to which you are connected, and which is currently running the MWTM server. The system command log lists all mwtm commands that have been entered for the MWTM server, the time each command was entered, and the user who entered the command.
To access the Command Log, click Command Log in the System Logs pane of the Administrative page. You can also view the Command Log with the mwtm cmdlog command.
The MWTM Command Log page appears.
Figure 11-3 MWTM Command Log Page
The Command Log table contains:
Viewing the Event Automation Log
The Event Automation Log shows the contents of the system event automation log file for the server to which you are connected, and which is currently running the MWTM server. The system event automation log lists all messages that event automation scripts generate.
The default path and filename for the system event automation log file is /opt/CSCOsgm/logs/eventAutomationLog.txt. If you installed the MWTM in a directory other than /opt, then the system event automation log file is in that directory.
To access the Event Automation Log, click Event Automation Log in the System Logs pane of the Administrative page. You can also view the Event Automation Log with the mwtm eventautolog command.
Related Topic
Changing the Way the MWTM Processes Events, page 9-27
Viewing the Security Log
The Security Log shows the contents of the MWTM system security log file for the server to which you are connected, and which is currently running the MWTM server. The system security log lists:
•
•
•
•
The default path and filename for the system security log file is /opt/CSCOsgm/logs/sgmSecurityLog.txt. If you installed the MWTM in a directory other than /opt, then the system security log file is in that directory.
To access the Security Log, click Security Log in the System Logs pane of the Administrative page. You can also view the Security Log with the mwtm seclog command.
The Last Security Entries table contains these columns:
Viewing the Install Log
The Install Log shows the contents of the MWTM system installation log. The installation log contains messages and other information recorded during installation, which can be useful when troubleshooting problems. The Install Log also records the installer's selections (for example, whether the installer chose to configure the MWTM to receive SNMP traps).
The default path and filename for the install log file is /opt/CSCOsgm/install/cisco_sgmsvr_install.log. If you installed the MWTM in a directory other than /opt, then the install log file is in that directory.
To access the Install Log, click Install Log in the System Logs pane of the Administrative page. You can also view the Install Log with the mwtm installlog command.
Viewing the Web Access Logs
The Web Access Logs page shows a list of web access log files for the server to which you are connected, and which is currently running the MWTM server. The web access log lists all system web access messages that have been logged for the MWTM server, providing an audit trail of all access to the MWTM server through the MWTM web interface.
The default path and filename for the web access log file is /opt/CSCOsgm/apache/logs/access_log. If you installed the MWTM in a directory other than /opt, then the web access log file is in that directory.
To access the Web Access Logs page, click Web Access Logs from with the System Logs pane of the Administrative page. You can also view the Web Access Logs page using the mwtm webaccesslog command.
Viewing the Web Error Logs
The Web Error Logs page shows a list of web error log files for the server to which you are connected, and which is currently running the MWTM server. The web server error log lists all system web error messages that have been logged for the MWTM web server. You can use the web error log to troubleshoot the source of problems that users may have encountered while navigating the MWTM web interface.
The default path and filename for the web error log file is /opt/CSCOsgm/apache/logs/error_log. If you installed the MWTM in a directory other than /opt, then the web error log file is in that directory.
To access the Web Error Logs page, click Web Error Logs in the System Logs pane of the Administrative page. You can also view the Web Error Logs page using the mwtm weberrorlog command.
Viewing the Report Log
The Report Log shows the message log for ITP reports for the server to which you are connected, and which is currently running the MWTM server. You can view this log to determine the beginning and finish times for report generation. The log also records errors that occurred during report generation (for example, server connection errors).
The default path and filename for the report log file is /opt/CSCOsgm/logs/sgmReportLog.txt. If you installed the MWTM in a directory other than /opt, then the report log file is in that directory.
To access the Report Log, click Report Log in the System Logs pane of the Administrative page. You can also view the Report Log with the mwtm replog command.
Viewing Properties
Property files for the MWTM are in the /opt/CSCOsgm/properties directory. You can view these MWTM properties from the Administrative page.
•
•
Viewing Properties
To access the System Properties file, click System in the Properties pane of the Administrative page. The MWTM shows the contents of the /opt/CSCOsgm/properties/System.properties file.
The System Properties file contains MWTM server and client properties that control various MWTM configuration parameters.
You can use MWTM commands to change these system properties:
Viewing Server Properties
To access the Server Properties file, click Server in the Properties pane of the Administrative page. The MWTM shows the contents of the /opt/CSCOsgm/properties/Server.properties file.
The Server Properties file contains MWTM various properties that control the MWTM server.
You can use MWTM commands to change these server properties:
DEMAND_POLLER_TIMELIMIT
SNMP_MAX_ROWS
UNKNOWN_AGING_TIMEOUT
To change poller parameters in the Server Properties file, see the "Changing MWTM Server Poller Settings" section on page 3-2.
Viewing Web Configuration Properties
To access the Web Configuration Properties file, click WebConfig in the Properties pane of the Administrative page. The MWTM shows the contents of the /opt/CSCOsgm/properties/
WebConfig.properties file.The Web Configuration Properties file contains properties that control the configuration of the MWTM web interface. For example:
MAX_ASCII_ROWS = 6000MAX_HTML_ROWS = 100# The selectable page sizes start at MIN_SELECTABLE_PAGE_SIZE and doubles until# the MAX_SELECTABLE_PAGE_SIZE value is reached# (e.g. 25, 50, 100, 200, 400, 800)MIN_SELECTABLE_PAGE_SIZE = 25MAX_SELECTABLE_PAGE_SIZE = 800LOG_UPDATE_INTERVAL = 300WEB_UTIL = percentWEB_NAMES = displayMAX_EV_HIST = 15000You can use the MWTM to change the web configuration properties:
LOG_UPDATE_INTERVAL
To control how often, in seconds, the MWTM updates certain web output, use the mwtm weblogupdate command. The valid range is 1 second to an unlimited number of seconds. The default value is 300 seconds (5 minutes).
MAX_ASCII_ROWS
To set the maximum number of rows for MWTM ASCII web output, such as displays of detailed debugging information, use the mwtm maxasciirows command. The valid range is 1 row to an unlimited number of rows. The default value is 6,000 rows.
MAX_EV_HIST
To set the maximum number of rows for MWTM to search in the event history logs, use the mwtm maxevhist command. The event history logs are the current and archived MWTM network status logs for status change and SNMP trap messages. The MWTM sends the results of the search to the web browser, where the results are further limited by the setting of the mwtm maxhtmlrows command. The valid range is 1 row to an unlimited number of rows. The default value is 15,000 rows.
MAX_HTML_ROWS
To set the maximum number of rows for MWTM HTML web output, such as displays of statistics reports, status change messages, or SNMP trap messages, use the mwtm maxhtmlrows command. This lets you select a page size (if you have not explicitly chosen a page size). Once you select a page size from any page, the MWTM remembers your preference until you delete your browser cookies. The default value is 100 rows.
MIN_SELECTABLE_PAGE_SIZE
This setting determines the minimum page size for the user to select from the Page Size drop-down menu. The page size values start with the MIN_SELECTABLE_PAGE_SIZE and double until they reach the MAX_SELECTABLE_PAGE_SIZE.
MAX_SELECTABLE_
PAGE_SIZEThis setting determines the maximum page size for the user to select from the Page Size drop-down menu. The page size values start with the MIN_SELECTABLE_PAGE_SIZE and double until they reach the MAX_SELECTABLE_PAGE_SIZE.
WEB_NAMES
To specify whether the MWTM should show real DNS names or display names in web pages, enter the mwtm webnames command. To show:
•
•
WEB_UTIL
To specify whether the MWTM should display send and receive utilization as percentages or in Erlangs in web pages, enter the mwtm who command. To show:
•
•
See Chapter 8, "Viewing RAN-O Performance and Error Data" for more information on send and receive utilization for shorthauls and backhauls.
See Chapter 12, "Managing ITP Reports" for more information on send and receive utilization for linksets and links.
Each of the web configuration commands requires you to be logged in as the root user, as described in the "Becoming the Root User (Server Only)" section on page 4-2, or as a superuser, as described in the "Specifying a Super User (Server Only)" section on page 2-18.
Related Topic
Viewing Reports Properties
To access the Reports Properties file, click Reports in the Properties pane of the Administrative page. The MWTM shows the contents of the /opt/CSCOsgm/properties/Reports.properties file.
The Reports Properties file contains properties that control various aspects of the reports that are available in the MWTM web interface.
You can use MWTM commands to change these reports properties:
Viewing Trap Forwarding Properties
To access the Trap Forwarding Properties file, click TrapForwarding in the Properties pane of the Administrative page. The MWTM shows the contents of the /opt/CSCOsgm/properties/TrapForwarder.properties file.
The Trap Forwarder Properties file contains a list of the destination addresses for the trap forwarder. Enter each destination address on its own line and use this format:
SERVERxx=destination_IP_address[:port_number]
The port_number parameter is optional.
Displaying Alarms
Displaying alarms in the web interface is essentially the same as displaying them in the MWTM client. Only minor differences exist. The Alarms table in the web interface:
•
•
•
For descriptions of the columns in the Alarms table, see the "Displaying Alarms" section on page 4-30.
Displaying Events
The Events table lists the events that the MWTM manages. To access the Events table of the MWTM web interface, click Events in the navigation tree in the left pane. The content area in the right pane shows the Events table.
Some differences exist between the web and client interface displays of the Events table. For example, the Events table in the MWTM web interface also shows archived events in addition to recent events. The MWTM web interface also shows fewer columns, has fewer buttons on the toolbar, and displays colored status balls in the Severity column.
For descriptions of the columns, see the "Event Table" section on page 9-5.
For descriptions of the tools in the toolbar, see the "Using the Toolbar" section.
To navigate the columns of the Events table, see Navigating Table Columns, page 5-23.
Displaying Summary Lists
Displaying Summary Lists in the web interface is essentially the same as displaying them in the MWTM client. Only minor differences exist. Clicking on an object under the Summary Lists in the web interface causes the content area to show information about the object. The content area:
•
•
For complete information about Summary Lists, see the "Displaying Object Windows" section on page 6-2.
Displaying Software Versions
The Software Versions table lists the software versions for each node the MWTM manages.
To access the Software Versions page:
•
•
For details on navigating the columns of the Software Versions table, see Navigating Table Columns, page 5-23.
The Software Versions table contains:
Displaying Reports
Note
You can display reports primarily for ITP objects in the MWTM Web interface. An overview and a complete list and description of these reports is available in Chapter 12, "Managing ITP Reports."
Event reports are also available for both RAN-O and ITP networks, also available within the Reports menu. For details, see the "Viewing Archived Event Files on the Web" section on page 9-22 and the "Viewing the Event Metrics Report on the Web" section on page 9-23.
Displaying Objects within a View
Displaying objects within a view in the MWTM web interface is essentially the same as viewing them in the MWTM client. Only minor differences exist. The MWTM web interface:
•
•
•
For details on each object type, see the "Displaying Object Windows" section on page 6-2.
Displaying RAN-O Historical Statistics
The MWTM web interface provides access to RAN-O historical statistics in the MWTM database. You can use these statistics for capacity planning and trend analysis. For example, you can generate charts:
•
•
•
Using this information, you can perform detailed analysis of historical traffic utilization on the backhaul and shorthaul links to plan future facility upgrades.
Note
This section provides information about:
•
•
Displaying Performance Statistics
You can view performance data for a shorthaul or backhaul interface within the MWTM:
•
•
Note
MIB not compliant for reportsInstall a version of IOS software on the node that is compatible with the MWTM. For a list of compatible IOS software, from the MWTM:
•
•
The Performance tab shows one or more charts depending on whether you selected a shorthaul or a backhaul interface. These charts depict send and receive rates of optimized IP traffic over a specified time range. The charts display the traffic in bits per second. Each data series shows maximum, minimum, and average rates of optimized traffic.
The Performance tab for a backhaul interface shows total rates for GSM and UMTS traffic, including total error rates.
This section provides information about:
•
•
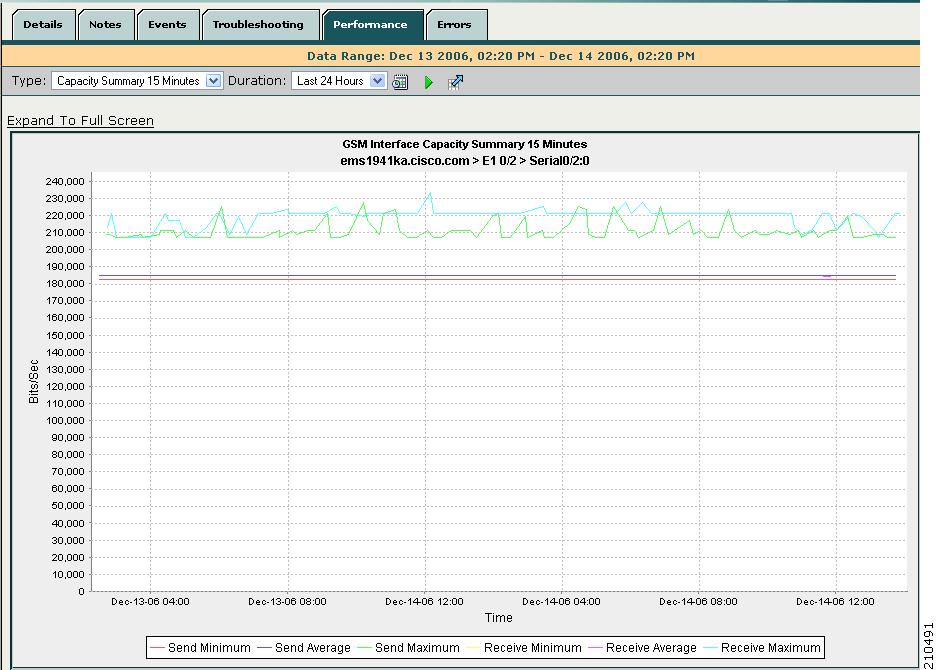
Displaying Shorthaul Performance Statistics
The Performance tab for a shorthaul interface shows the maximum, minimum, and average rates for send and receive traffic.
Figure 11-4 Example of Performance Tab for Shorthaul Interface
The Performance tab for a shorthaul interface contains:
Toolbar
Provides functions to select a report type and duration, and to export the report to a CSV file. See the "Using the Toolbar" section.
Type:
Capacity Summary
A comprehensive summary of minimum, average, and maximum capacity statistics for send and receive traffic on the RAN shorthaul. You can choose from 15-minute, hourly, or daily data report types.
Expand to Full Screen
Text link that shows a chart in a new, full-screen window for easier viewing.
Bits/Sec
Y-axis label that shows traffic rate in bits per second. The Y axis automatically scales to the interface speed.
Note
Time
X-axis label that shows a historical time scale and the server time zone.
Legend
Color-coded legend that shows labels for traffic rates.
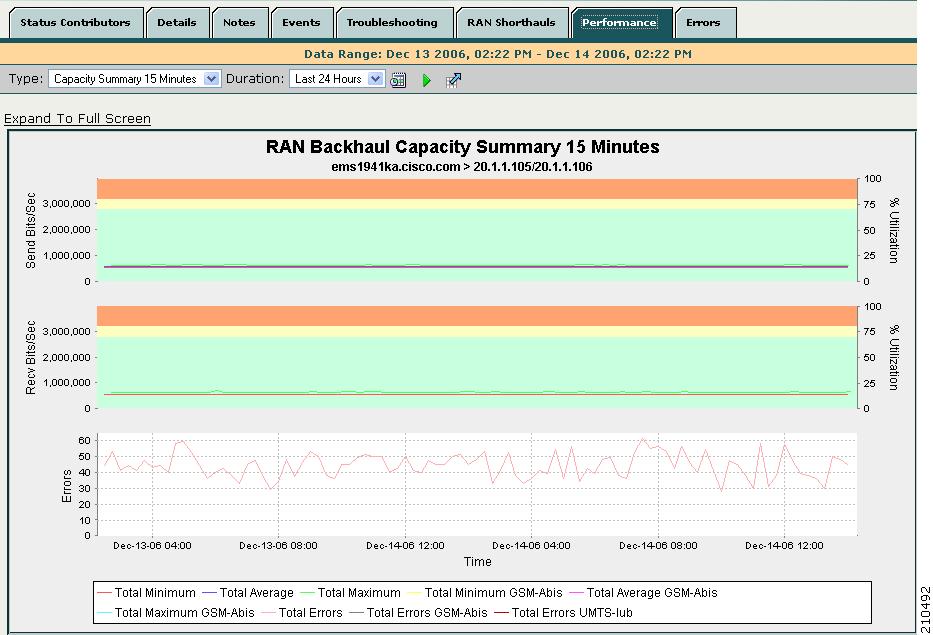
Displaying Backhaul Performance Statistics
The Performance tab for a backhaul interface shows minimum, average, and maximum traffic rates for send and receive traffic. You can also determine the percentage of backhaul utilization that various traffic types occupy. Error rates appear, too.
Figure 11-5 Example of Performance Tab for Backhaul Interface
The Performance tab for a backhaul interface contains:
Toolbar
Provides functions to select a report type and duration, customize the display of associated shorthauls, and export the report to a CSV file. See the "Using the Toolbar" section.
Type:
Capacity Summary
A comprehensive summary of minimum, average, and maximum capacity statistics for total (GSM-Abis and UMTS-Iub) traffic, total GSM-Abis traffic, and total UMTS-Iub traffic. You can choose from 15-minute, hourly, or daily data report types.
Statistics appear in three fully expandable charts:
•
•
•
Type:
Capacity
Depending on your selection, the minimum, average, or maximum capacity statistics for the backhaul interface. You can choose from 15-minute, hourly, or daily data report types.
Send and receive rate statistics appear in separate panes. Each pane shows two fully expandable charts:
•
•
Expand to Full Screen
Text link that shows a chart in a new, full-screen window for easier viewing.
Bits/Sec
Primary Y-axis label (left side of chart) that shows traffic rate in bits per second. The Y axis automatically scales to the User Bandwidth. See the"Editing Properties for a RAN-O Backhaul" section on page 6-33.
Note
% Utilization
Secondary Y-axis label (right side of chart) that shows the backhaul utilization as a percentage of the User Bandwidth. The chart background has three horizontal bars that are color-coded to indicate these thresholds:
•
•
•
For definitions of these thresholds, see the "Threshold Information (RAN-O Only)" section on page 8-42.
To change the threshold settings, see the "Editing Properties for a RAN-O Backhaul" section on page 6-33.
Time
X-axis label that shows a user-specified, historical time scale and the server time zone.
Legend
Color-coded legend that shows labels for traffic and error rates.
Displaying Error Statistics
You can view error data for a shorthaul or backhaul interface within the MWTM:
•
•
Note
MIB not compliant for reportsInstall a version of IOS software on the node that is compatible with the MWTM. For a list of compatible IOS software, from the MWTM:
•
•
You view error data for a shorthaul or backhaul interface by selecting the interface in the navigation tree and clicking the Errors tab in the content area. The Errors tab shows total error counts and average error rates in table and chart format.
This section provides information about:
•
•
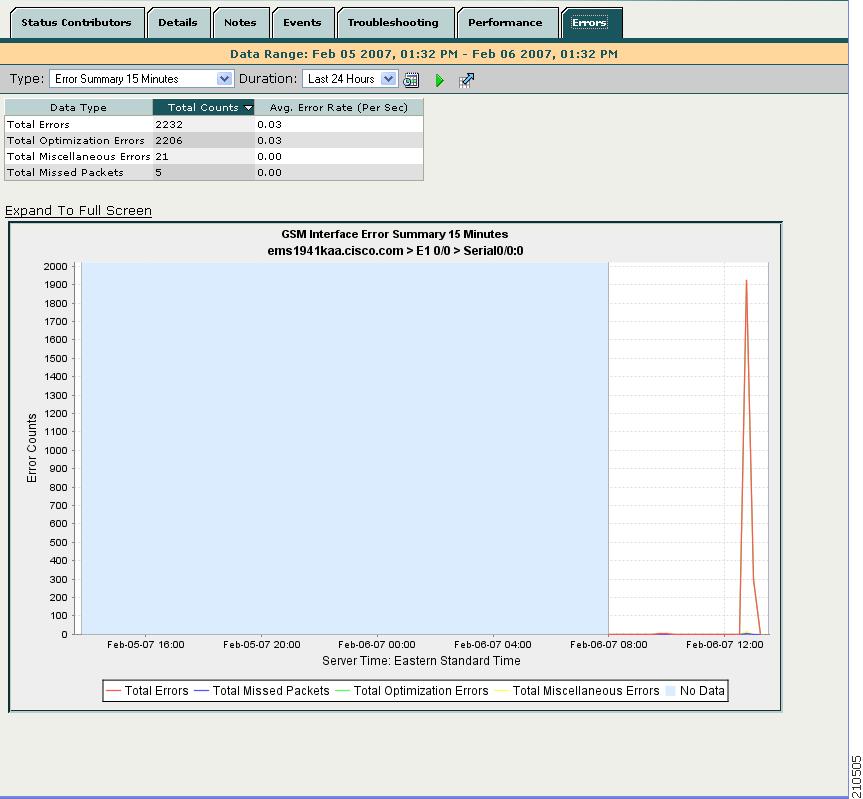
Displaying Shorthaul Error Statistics
The Errors tab for a shorthaul interface shows a single table and a chart that shows the error rates and counts for different types of GSM-Abis and UMTS-Iub errors.
Figure 11-6 Example of Errors Tab for Shorthaul Interface
The Errors tab for a shorthaul interface contains:
Toolbar
Provides functions to select a report type and duration, and to export the report to a CSV file. See the "Using the Toolbar" section.
Type:
Errors Summary
A comprehensive summary of total error counts and average error rates for optimization, missed-packet, and miscellaneous errors for the selected shorthaul. You can choose from 15-minute, hourly, or daily data report types. Statistics appear in table and chart format.
Type:
Errors
Depending on your selection, the optimization, missed packet, or miscellaneous errors for the shorthaul interface. You can choose from 15-minute, hourly, or daily data report types. Statistics appear in table and chart format.
For definitions of these error types, see the:
•
•
Table
Table that shows these columns:
•
•
•
Note
Expand to Full Screen
Text link that shows a chart in a new, full-screen window for easier viewing.
Error Counts
Y-axis label on left side of chart that shows traffic rate in bits per second.
Note
Time
X-axis label that shows a user-specified, historical time scale and the server time zone.
Legend
Color-coded legend that shows labels for traffic and error rates.
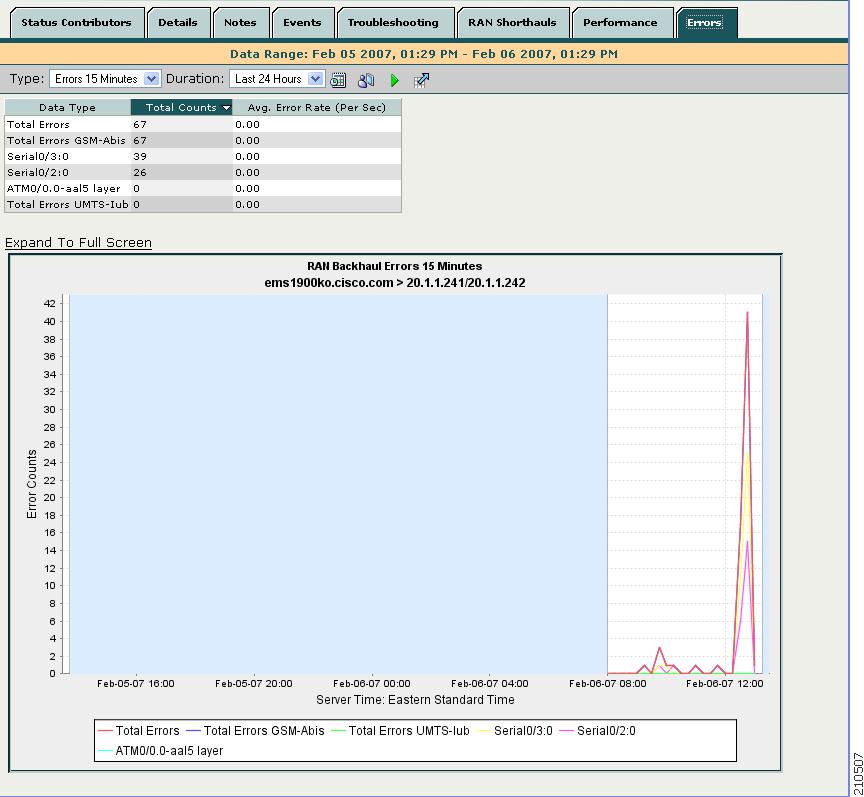
Displaying Backhaul Error Statistics
The Errors tab for a RAN backhaul interface shows a single table and a chart that shows the error rates and counts for different interfaces belonging to the backhaul.
Figure 11-7 Example of Errors Tab for Backhaul Interface
The Errors tab for a backhaul interface contains:
Toolbar
Provides functions to select a report type and duration, customize the display of associated shorthauls, and export the report to a CSV file. See the "Using the Toolbar" section.
Table
Table that shows these columns:
•
•
•
Note
Expand to Full Screen
Text link that shows a chart in a new, full-screen window for easier viewing.
Error Counts
Y-axis label on left side of chart that shows traffic rate in bits per second.
Time
X-axis label that shows a user-specified, historical time scale and the server time zone.
Legend
Color-coded legend that shows labels for traffic and error rates.
Generating RAN Data Export Files
You can easily generate historical reports for RAN backhauls and shorthauls in the web interface. You can then export this data to a report with comma-separated values (CSV file). You can save this file to disk or open it with an application that you choose (for example, Microsoft Excel).
To export RAN data:
Step 1
Step 2
Step 3
Step 4