User Guide for the Cisco Mobile Wireless Transport Manager 6.0
Managing ITP Reports

Table Of Contents

Managing ITP Reports

Enabling ITP Reports

Viewing Reports by Using the MWTM Web Interface

Including or Excluding Specified Objects in ITP Reports

Customizing ITP Report Preferences

Locating Stored ITP Reports

Changing the MWTM Reports Directory

Understanding ITP Reports

Application Server Reports

Hourly Application Server Reports

Daily Application Server Reports

Daily Application Server Peaks Reports

Daily Application Server Archived Reports

Hourly Application Server Archived Reports

Application Server Process Reports

Hourly Application Server Process Reports

Daily Application Server Process Reports

Daily Application Server Process MTP3 Reports

Daily Application Server Process Peaks Reports

Daily Application Server Process MTP3 Peaks Reports

Daily Application Server Process Archived Reports

Hourly Application Server Process Archived Reports

Link Reports

Hourly Link Reports

Daily Link Reports

Daily Link Peaks Reports

Link Multi-Day Utilization Report

Hourly Link Statistics Archived Reports

Daily Link Statistics Archived Reports

Linkset Reports

Hourly Linkset Reports

Daily Linkset Reports

Daily Linkset Peaks Reports

Hourly Linkset Statistics Archived Reports

Daily Linkset Statistics Archived Reports

MLR Reports

Daily MLR Reports

Daily MLR Statistics Archived Reports

MSU Rates Reports

MSU Load Reports

MSU Peaks Reports

GTT Accounting Reports

GTT Accounting Statistics Daily Summary Reports

Daily GTT Accounting Statistics Archived Reports

MTP3 Accounting Reports

MTP3 Accounting Statistics Daily Detail Reports

Daily MTP3 Accounting Statistics Archived Reports

ITP Point Code Reports

Current Point Code Inventory

Daily Point Code Archived Reports

MTP3 Event Reports

Hourly MTP3 Event Reports

Custom MTP3 Event Reports

Enabling Custom Archived Statistics Reports

Including and Excluding Specified Objects in Custom Archived Reports

Including Specified Nodes or Signaling Points in Custom Archived Reports

Including Specified Linksets in Custom Archived Reports

Excluding Specified Nodes or Signaling Points from Custom Archived Reports

Excluding Specified Linksets from Custom Archived Reports

Understanding Custom Archived Reports

Custom MTP3 Events Detail Reports

Custom GTT Accounting Detail Reports

Custom MLR Statistics Detail Reports

Custom MLR Abort and Continues Detail Reports

Custom MLR Processed Detail Reports

Custom MLR Result Invokes Detail Reports

Custom MLR Rule Matches Detail Reports

Custom MLR Subtriggers Detail Reports

Custom MLR Triggers Detail Reports

Custom MTP3 Accounting Detail Reports

Custom Application Server Statistics Detail Reports

Custom Application Server Process Statistics Detail Reports

Custom Link Statistics Detail Reports

Custom Linkset Statistics Detail Reports

Understanding Network Statistics Archived Reports

Hourly Network Statistics Archived Reports

Daily Network Statistics Archived Reports

Rolling Network Statistics Archived Reports

Viewing the MWTM Statistics Reports Logs

Viewing the MWTM Report Log

Viewing the MWTM Report Parameters and Timers


Managing ITP Reports


At scheduled intervals, you can configure the Cisco Mobile Wireless Transport Manager (MWTM) to gather critical information from network objects that it detects. The MWTM uses that information to calculate statistics (accounting statistics, inventory statistics, and so on) and generates reports based on those statistics.

This chapter contains:

Enabling ITP Reports

Viewing Reports by Using the MWTM Web Interface

Including or Excluding Specified Objects in ITP Reports

Customizing ITP Report Preferences

Locating Stored ITP Reports

Changing the MWTM Reports Directory

Understanding ITP Reports

Enabling Custom Archived Statistics Reports

Understanding Custom Archived Reports

Understanding Network Statistics Archived Reports

Viewing the MWTM Statistics Reports Logs

Enabling ITP Reports

You can enable ITP reports on the MWTM server by using CLI commands to configure general or custom reports:

General CLI commands continuously generate reports for all objects of a specified type.

Custom CLI commands perform a one-time report generation for one or more objects of a specified type.

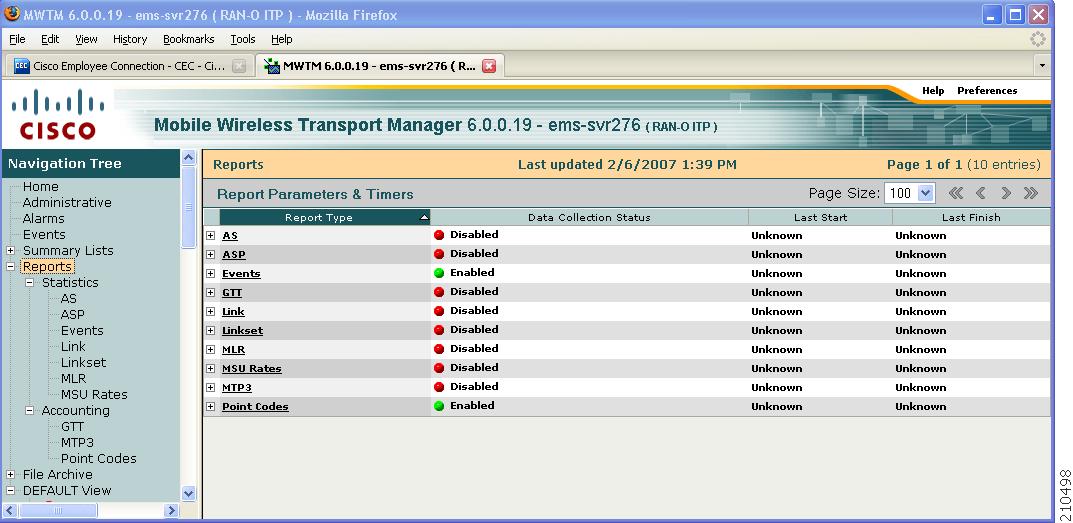
To see which reports are enabled or disabled, and which general CLI commands configure and disable each report:


Step 1 Do one of the following:

Within a Web browser, launch the MWTM Web interface (see Accessing the MWTM Web Interface, page 11-1). In the navigation tree, click Reports.

From the MWTM client, within the MWTM main window, choose View > Web > Reports.


Note If you enable MWTM User-Based Access, the Reports menu is available to users with authentication level 4 (Network Administrator) and higher.


Step 2 The Reports page in the content area shows the Report Type and the Data Collection Status (enabled or disabled).

Step 3 Click the plus (+) sign to expand a Report Type. The associated Data Collection Status appears next to each Report Type. Note that clicking a Report Type takes you directly to the report data page.

If you enable the Data Collection Status, a green status ball appears next to the word Enabled.

If the Data Collection Status is disabled, a red status ball appears next to the word Disabled. To see which general CLI command enables a disabled report, click Disabled (you must expand the Report type to see the Disabled link). A popup window appears with the Enable command. As the root user, you can log in to the MWTM server and run the specified command to enable the report.


Note For more descriptions of CLI commands, see Appendix B, "Command Reference."


Viewing Reports by Using the MWTM Web Interface

Once you enable ITP reports by using the CLI commands, you can view the reports by using the MWTM web interface. You can view reports for all objects of a specific type (for example, all link reports for all links); or, reports for a specific object (for example, all link reports for a specific link).

You access ITP reports in the MWTM web interface through these categories:

Category
Report Type
Related Content

Reports > Statistics

AS

Application Server Reports

ASP

Application Server Process Reports

Events

The event metrics reports are applicable for RAN-O and ITP networks. You can find information on event metrics reports in the "Managing Events" chapter (see Viewing the Event Metrics Report on the Web, page 9-23).

Link

Link Reports

Linkset

Linkset Reports

MLR

MLR Reports

MSU Rates

MSU Rates Reports

Reports > Accounting

GTT

GTT Accounting Reports

MTP3

MTP3 Accounting Reports

Point Codes

ITP Point Code Reports

File Archive > Events

N/A

Archived event reports are applicable for RAN-O and ITP networks. You can find information on archived event reports in the "Managing Events" chapter (see Viewing the Event Metrics Report on the Web, page 9-23).

File Archive > Reports

Custom

Understanding Custom Archived Reports

Daily

Daily Network Statistics Archived Reports

Hourly

Linkset Reports

Rolling

Rolling Network Statistics Archived Reports

AS

Daily Application Server Archived Reports

Hourly Application Server Archived Reports

Custom Application Server Statistics Detail Reports

ASP

Daily Application Server Process Archived Reports

Hourly Application Server Process Archived Reports

Custom Application Server Process Statistics Detail Reports

GTT

Daily GTT Accounting Statistics Archived Reports

Custom GTT Accounting Detail Reports

Link

Hourly Link Statistics Archived Reports

Daily Link Statistics Archived Reports

Custom Link Statistics Detail Reports

Linkset

Hourly Linkset Statistics Archived Reports

Daily Linkset Statistics Archived Reports

Custom Linkset Statistics Detail Reports

MLR

Daily MLR Statistics Archived Reports

Custom MLR Statistics Detail Reports

MTP3

Daily MTP3 Accounting Statistics Archived Reports

Custom MTP3 Accounting Detail Reports

Point Codes

Daily Point Code Archived Reports

Q752

Enabling Custom Archived Statistics Reports


Note If you enable MWTM User-Based Access, the Reports and File Archive menus are available to users with authentication level 4 (Network Administrator) and higher.


To view a Web report:


Step 1 For all objects of a specified type:

From the MWTM web navigation tree, in Reports or File Archive, click the type of report you want to view in the web navigation tree; for example, if you want to view current link reports, select Reports > Statistics > Link. All link reports appear.

For a single object of a specified type do one of the following. From the MWTM:

Web navigation tree, in DEFAULT View, click a node or drill down to click an object in a node. In the content area in the right pane, click the Reports tab. Reports appear for the active object only.

Client, right-click an object and click Latest Reports. The Reports tab in the MWTM web interface opens for the active object only.

Figure 12-1 MWTM Web Interface—Reports


Note In the MWTM web interface, if you do not enable data collection on the active report, a red status indicator and the words Data Collection Disabled appear next to the report title. Click the Data Collection Disabled link to see which command enables the report.


Step 2 Choose the Type and Duration from the drop-down lists; for example, if you wanted to view hourly link reports for the last 12 hours, choose Link Hourly from the Type list and Last 12 Hours from the Duration list.

Step 3 (Optional) For most Statistics and Accounting reports, to customize the date or time range, or both you click the Customize icon.

Step 4 Click the green arrow to run the report. If you change the Type or Duration, an information message appears:

Click the green arrow to show the selected report. 

Step 5 To disable this error message, click Hide Message. To display the message again, click the Information icon.

Step 6 (Optional) For Statistics and Accounting reports, to export the report as a .csv file, click the Export
icon.


Note For more details on using the MWTM web interface, see Chapter 11, "Accessing Data from the Web Interface."


Once you open a report, you can drill down to:

See raw data for an object (helpful in diagnosing problems,) click the first Filter icon located at the beginning of a row, next to the Date column.

Drill down under an object, click the Filter icon located on the left of the object. Drilling down shows objects beneath other objects.


Note To navigate to the Details tab for an object, click the underlined object in the report; for example, to go to the Details tab for a node, click the underlined node in the reports table.


Including or Excluding Specified Objects in ITP Reports

You can include or exclude specific nodes, signaling points, or linksets in ITP reports by creating a user-defined file, named:

nodes.include—Includes only specified nodes or signaling points in reports

nodes.exclude—Excludes only specified nodes or signaling points in reports

linksets.include—Includes only specified linksets in reports

linksets.exclude—Excludes only specified linksets in reports

The nodes, signaling points, and/or linksets that you specify in these files will be included or excluded from all enabled MWTM statistics reports and in custom reports enabled with the default keyword (or no node-list keyword at all), which include:

mwtm accstats

mwtm gttstats

mwtm linkstats

mwtm mlrstats

mwtm mtpevents

mwtm q752stats

mwtm xuastats

When creating user-defined files, remember that if you installed the MWTM in:

The default directory, /opt, then the user-defined file resides within /opt/CSCOsgm/reports/etc/<user-defined file>.

A different directory, or if you moved the report files directory using the mwtm repdir command, then the /reports/etc/<user-defined file> resides in that directory.

Wildcard matching is not supported.

If a node, signaling point, or linkset appears in both the include file and the exclude file, it is excluded. That is, excluding an object overrides including the same object.

If you specify a special include file on the mwtm accstats, mwtm gttstats, mwtm linkstats, mwtm mlrstats, mwtm mtpevents, mwtm q752stats, or mwtm xuastats command, the MWTM ignores the include or exclude file.

When creating a nodes.include or nodes.exclude file:

Each line in the file must contain a single node name, or node name and signaling point name, separated by a colon (:) that matches exactly the real, fully qualified name of the node; for example:

mwtm-75-59a.cisco.com
mwtm-26-51a.cisco.com

To include a specific signaling point, specify the node name and signaling point:

mwtm-75-59a.cisco.com:1.2.7;net0
mwtm-26-51a.cisco.com:1.2.7;net0

When creating a linksets.include or linksets.exclude file:

Each line in the file must contain a single linkset name that matches exactly the real, fully qualified linkset name of the linkset, including the node name and signaling point name; for example:

mwtm-75-59a.cisco.com:1.2.7;net0:linkset2
mwtm-26-51a.cisco.com:1.2.7;net0:linkset1

Customizing ITP Report Preferences

This table lists server CLI commands that allow you to customize your report preferences:

Command
Description

mwtm evreps clean, page B-83

Removes all data from MTP3 event reports, restoring the reports to a "clean" state.

mwtm evreps cleancustom, page B-83

Removes all data from one or more MTP3 event reports, restoring the reports to a "clean" state.

mwtm evreps diskcheck, page B-83

Specifies whether the MWTM should verify that a disk has at least 10 MB of space remaining before enabling MTP3 event reports.

mwtm evreps hourlyage, page B-84

Maximum number of days the MWTM should archive hourly MTP3 event reports.

mwtm evreps status, page B-85

Shows the current status of all MWTM network MTP3 event report parameters.

mwtm evreps timer, page B-85

Shows the timer file for MTP3 event reports.

mwtm replog, page B-101

Uses PAGER to display the contents of the system reports log. The reports log lists all messages about the creation and maintenance of reports.

Note You can also view the reports log on the web. For more information, see Viewing the MWTM Report Log.

mwtm statreps clean, page B-105

Removes all data from MWTM network statistics and accounting reports, restoring the reports to a clean (normal) state.

mwtm statreps cleancustom, page B-106

Removes all data from one or more custom statistics and accounting reports, restoring the custom reports to a clean (normal) state.

mwtm statreps custage, page B-106

or

mwtm repcustage, page B-100

Sets the maximum number of days the MWTM should archive custom network statistics and accounting reports.

mwtm statreps dailyage, page B-107

or

mwtm repdailyage, page B-43

Sets the maximum number of days the MWTM should archive daily network statistics and accounting reports.

mwtm statreps diskcheck, page B-107

Specifies whether the MWTM should verify that a disk has at least 10 MB of space remaining before enabling network statistics and accounting reports.

mwtm statreps servratio, page B-114

or

mwtm rephourlyage, page B-44

Sets the maximum number of days the MWTM should archive hourly network statistics and accounting reports.

mwtm statreps iplinks, page B-110

Specifies whether the MWTM should include links that use the Stream Control Transmission Protocol (SCTP) IP transport protocol in network statistics and accounting reports.

mwtm statreps nullcaps, page B-113

Specifies whether the MWTM should include SCTP links that do not have planned send and receive capacities in network statistics, and accounting reports.

mwtm statreps servratio, page B-114

Specifies whether the MWTM should display a red ball in the In-Service cell in a network statistics and accounting report.

mwtm statreps status, page B-114

Shows the current status of all MWTM network statistics and accounting report parameters.

mwtm statreps timemode, page B-115

Sets the time mode for dates in network statistics and accounting reports.

mwtm statreps timer, page B-115

Shows the timer file for MWTM network statistics and accounting reports.

mwtm statreps utilratio, page B-116

Specifies whether the MWTM should display a red ball in the Send Utilization or Receive Utilization cell in a network statistics and accounting report.

mwtm webnames, page B-71

Specifies whether the MWTM should show real node names or display names in web pages.

Note For more information about display names, see Editing Properties, page 6-29.

mwtm who, page B-72

Specifies whether the MWTM should display send and receive utilization for linksets and links as a percentage (%) or in Erlangs (E) on web pages.


Locating Stored ITP Reports

The MWTM stores all reports in the report files directory on the /reports directory. If you installed the MWTM in:

The default directory, /opt, then the default report files directory is /opt/CSCOsgm/reports.

A different directory or used the mwtm repdir command to specify a new directory in which the MWTM should store report files, then the default report files directory resides in that directory.


Note For details on changing the default reports directory by using the mwtm repdir command, see Changing the MWTM Reports Directory.


The /reports directory contains these subdirectories:

Subdirectory
Description

/custom

Contains all custom report files. These are the report files that you enable by using these commands:
mwtm accstats, mwtm gttstats, mwtm linkstats, mwtm mlrstats, mwtm mtpevents, mwtm q752stats, and mwtm xuastats

Note A unique ID tag, specified when you enter the command, identifies each file. If the user does not specify an ID tag, the MWTM uses the process ID of the command.

/daily

Contains all daily report files, stored in .Z format.

/etc

Contains additional files that the MWTM reporting scripts and web pages use, including the nodes.include, linksets.include, nodes.exclude, and linksets.exclude files, if they exist.

/exportdaily

Contains all daily report files, edited and formatted for export, which are stored as .zip files in comma-separated value (CSV) format.

/exporthourly

Contains all hourly report files, edited and formatted for export, which are stored as .zip files in CSV format.

/exportrolling

Contains all rolling report files, edited and formatted for export, which are stored as .zip files in CSV format. The MWTM rebuilds the files in this subdirectory every hour.

/hourly

Contains all hourly report files, which are stored in .Z format.


Changing the MWTM Reports Directory

On the server, you can change the directory in which the MWTM stores reports.

To change the MWTM report files directory, log in as the root user, as described in Starting the MWTM Client, page 4-2; or, as a superuser, as described in Specifying a Super User (Server Only), page 2-18, and enter:

# cd /opt/CSCOsgm/bin
# ./mwtm repdir directory


where directory is the new directory.


Note This command copies all files in the current directory to the new directory. If you log in as the superuser and you do not own the new directory, you might not be able to copy the files. In that case, you must specify a directory that you own or log in as the root user.


Understanding ITP Reports

This section contains:

Application Server Reports

Application Server Process Reports

Link Reports

Linkset Reports

MLR Reports

MSU Rates Reports

GTT Accounting Reports

MTP3 Accounting Reports

ITP Point Code Reports

MTP3 Event Reports

Application Server Reports


Note If you enable MWTM User-Based Access, these reports are available to users with authentication level 4 (Network Administrator) and higher.


The xUA statistics encompass Message Transfer Part 3 User Adaptation (M3UA) and Signaling Connection Control Part User Adaptation (SUA). xUA connects application servers to SS7 networks.

You can view summary reports of hourly and daily xUA statistics. You can also export the reports.

This section covers:

Hourly Application Server Reports

Daily Application Server Reports

Daily Application Server Peaks Reports

Daily Application Server Archived Reports

Hourly Application Server Archived Reports

Hourly Application Server Reports

You can view hourly summaries of xUA statistics for all application servers that the MWTM detects for the specified date and hour range. The AS Hourly Report page shows summary reports of hourly application server statistics by date and hour.

The AS Hourly Report table is sorted based on the information in the Packets From MTP3 column; however, you can sort the table based on the information in one of the other columns (see Navigating Table Columns, page 5-23).


Note If you do not enable data collection on the active report, a red status indicator and the words Data Collection Disabled appear next to the report title. Click the Data Collection Disabled link to see which command enables the report.

If a statistics calculation results in an undefined value, such as a number divided by zero (0), or an undefined number, based on the configuration, then MathError appears in the field.


Field or Column
Description

Date

Date of the report.

Node

Name of the node for the application server.

Network Name

Name of the network for the application server.

Signaling Point

Name of the signaling point for the application server.

AS

Name of the application server.

Packets From MTP3

Total number of packets that the application server received, sent from the MTP3 layer.

Packets To ASPs

Total number of packets that the application server sent to the application server processes.


Daily Application Server Reports

You can view a daily summary of statistics for all application servers that the MWTM detects for a specified date range. The AS Daily Report page shows summary reports of daily application server statistics that are archived by date and hour.

The AS Daily Report table is sorted based on the information in the Packets From MTP3 column; however, you can sort the table based on the information in one of the other columns (see Navigating Table Columns, page 5-23).


Note If you do not enable data collection on the active report, a red status indicator and the words Data Collection Disabled appear next to the report title. Click the Data Collection Disabled link to see which command enables the report.

If a statistics calculation results in an undefined value, such as a number divided by zero (0), or an undefined number, based on the configuration, then MathError appears in the field.


Field or Column
Description

Date

Date of the report.

Node

Name of the node for the application server.

Network Name

Name of the network for the application server.

Signaling Point

Name of the signaling point for the application server.

AS

Name of the application server.

Packets From MTP3

Total number of packets that the application server receives from the MTP3 layer for the specified date.

Peak From MTP3

Highest hourly Packets From MTP3 for the application server for the specified date.

Peak From Hour

Hour in which the Peak From MTP3 for the application server occurred for the specified date.

Click the hour to see the AS Hourly Report for the selected application server and hour.

Packets To ASPs

Total number of packets that the application server sent to the application server processes for the specified date.

Peak To ASPs

Highest hourly Packets To ASPs for the application server for the specified date.

Peak To Hour

Hour in which the Peak To ASPs for the application server occurred for the specified date.

Click the hour to see the AS Hourly Report for the selected application server and hour.


Daily Application Server Peaks Reports

You can view an application server statistics Peaks Report to see peak values for each day and the hour in which each peak value occurred. The AS Peaks Daily Report page shows summary reports of daily application server peak statistics by date and hour.

The AS Peaks Daily Report table is sorted based on the information in the Peak From MTP3 column; however, you can sort the table based on the information in one of the other columns (see Navigating Table Columns, page 5-23).


Note If you do not enable data collection on the active report, a red status indicator and the words Data Collection Disabled appears next to the report title. Click the Data Collection Disabled link to see which command enables the report.

If a statistics calculation results in an undefined value, such as a number divided by zero (0), or an undefined number, based on the configuration, then MathError appears in the field.


Field or Column
Description

Date

Date of the report.

Node

Name of the node for the application server.

Network Name

Name of the network for the application server.

Signaling Point

Name of the signaling point for the application server.

AS

Name of the application server that recorded the peak value.

Peak From MTP3

Highest hourly Packets From MTP3 for the application server for the last 30 days.

Peak From Hour

Hour in which the Peak From MTP3 for the application server occurred.

Click the hour to see the AS Hourly Report for the selected application server and hour.

Peak To ASPs

Highest hourly Packets To ASPs for the application server for the last 30 days.

Peak To Hour

Hour in which the Peak To ASPs for the application server occurred.

Click the hour to see the AS Hourly Report for the selected application server and hour.


Daily Application Server Archived Reports

The AS Daily Archived Reports page shows summary reports for all archived MWTM daily network statistics for all application servers that the MWTM detects for the server to which you connect. The information is stored as downloadable .zip files.

The .zip files are archived by type and date; for example, the sgmASEStats.DailySum.2007-02-13.csv.zip file contains the summary report for daily application server statistics for February 13, 2007.

Each archived .zip file contains a comma-separated value (CSV) text file with a summary report of daily network statistics for all application servers that the MWTM detects on that date and hour. You can download the .zip files and extract them.

To download a .zip file, click a filename, then save the file to a location of your choice. You can also import the file directly into Microsoft Excel.

For more information about the format of daily application server statistics archived reports, see Application Server Statistics Daily and Peaks Daily Format, page I-4.

Hourly Application Server Archived Reports

The AS Hourly Archived Reports page shows all summary reports for archived MWTM hourly network statistics for all application servers that the MWTM detects for the server to which you connect. The information is stored as downloadable .zip files.

The .zip files are archived by type, date, and hour; for example, the sgmASEStats.2007-02-13-08.csv.zip file contains the summary report for hourly application server statistics for the 8th hour on February 13, 2007.

Each archived .zip file contains a comma-separated value (CSV) text file with a summary report of hourly network statistics for all application servers that the MWTM detected on that date and hour. You can download the .zip files and extract them.

To download a .zip file, click a filename, then save the file to a location of your choice. You can also import the file directly into Microsoft Excel.

For more information about the format of hourly application server statistics archived reports, see Application Server Statistics Hourly Format, page I-5.

Application Server Process Reports


Note If you enabled MWTM User-Based Access, these reports are available to users with authentication level 4 (Network Administrator) and higher.


You can view summary reports of hourly and daily xUA statistics. You can also export the reports.

The xUA statistics encompass Message Transfer Part 3 User Adaptation (M3UA) and Signalling Connection Control Part User Adaptation (SUA). xUA connects application servers to SS7 networks.

This section covers:

Hourly Application Server Process Reports

Daily Application Server Process Reports

Daily Application Server Process Peaks Reports

Daily Application Server Process MTP3 Peaks Reports

Daily Application Server Process Archived Reports

Hourly Application Server Process Archived Reports

Hourly Application Server Process Reports

You can view hourly summaries of statistics for all application server processes that the MWTM detects on the specified date and hour. The ASP Hourly Report page shows summary reports of hourly application server process statistics by date and hour.

The ASP Hourly Report table is sorted based on the information in the Packets From ASP column; however, you can sort the table based on the information in one of the other columns (see Navigating Table Columns, page 5-23).


Note If you do not enable data collection on the active report, a red status indicator and the words Data Collection Disabled appear next to the report title. Click the Data Collection Disabled link to see which command enables the report.

If a statistics calculation results in an undefined value, such as a number divided by zero (0), or an undefined number, based on the configuration, then MathError appears in the field.


Field or Column
Description

Date

Date of the report.

Node

Name of the node for the application server process.

ASP

Name of the application server process.

Packets From ASP

Total number of packets that the application server process send for the specified date and hour.

Packets To ASP

Total number of packets sent to the application server process for the specified date and hour.

Packets From MTP3

Total number of packets that the application server process received from the MTP3 layer for the specified date and hour.

Packets To MTP3

Total number of packets the application server process sent to the MTP3 layer for the specified date and hour.

Send Errors

Total number of errors that occurred when sending packets to the application server process for the specified date and hour.

Receive Errors

Total number of errors that occurred when receiving packets from the application server process for the specified date and hour.


Daily Application Server Process Reports

You can view a daily summary of statistics for all application server processes that the MWTM detects on a specified date. The ASP Daily Report page shows summary reports of daily application server process statistics, archived by date and hour.

The ASP Daily Report table is sorted based on the information in the Packets From ASP column; however, you can sort the table based on the information in one of the other columns (see Navigating Table Columns, page 5-23).


Note If you do not enable data collection on the active report, a red status indicator and the words Data Collection Disabled appear next to the report title. Click the Data Collection Disabled link to see which command enables the report.

If a statistics calculation results in an undefined value, such as a number divided by zero (0), or an undefined number, based on the configuration, then MathError appears in the field.


Field or Column
Description

Date

Date of the report.

Node

Name of the node for the application server process.

ASP

Name of the application server process.

Packets From ASP

Total number of packets that the application server process sent for the specified date.

Peak From ASP

Highest hourly Pkts From ASP for the application server for the specified date.

Peak From Hour

Hour in which the Peak From ASP for the application server process occurred for the specified date.

Click the hour to see the ASP Hourly Report for the selected application server process and hour.

Packets To ASP

Total number of packets that the application server sent to the application server processes for the specified date.

Peak To ASP

Highest hourly Pkts To ASP for the application server for the specified date.

Peak To Hour

Hour in which the Peak To ASP for the application server process occurred for the specified date.

Click the hour to see the ASP Hourly Report for the selected application server process and hour.

Send Errors

Total number of errors that occurred when sending packets to the application server processes for the specified date.

Peak Send Errors

Highest hourly Send Errors for the application server for the specified date.

Peak Send Hour

Hour in which the Peak Send Errors for the application server process occurred for the specified date.

Click the hour to see the ASP Hourly Report for the selected application server process and hour.

Receive Errors

Total number of errors that occurred when receiving packets from the application server processes for the specified date.

Peak Receive Errors

Highest hourly receive errors for the application server for the specified date.

Peak Receive Hour

Hour in which the peak receive errors for the application server process occurred for the specified date.

Click the hour to see the ASP Hourly Report for the selected application server process and hour.


Daily Application Server Process MTP3 Reports

The ASP MTP3 Daily Report page shows a daily summary of MTP3 statistics for all application server processes that the MWTM detects on a specified date. The ASP MTP3 Daily Report page shows a summary report of daily application server process MTP3 statistics by date and hour.

The ASP MTP3 Daily Report table is sorted based on the information in the Packets From MTP3 column; however, you can sort the table based on the information in one of the other columns (see Navigating Table Columns, page 5-23).


Note If you do not enable data collection on the active report, a red status indicator and the words Data Collection Disabled appears next to the report title. Click the Data Collection Disabled link to see which command enables the report.

If a statistics calculation results in an undefined value, such as a number divided by zero (0), or an undefined number, based on the configuration, then MathError appears in the field.


Field or Column
Description

Date

Date of the report.

Node

Name of the node for the application server process.

ASP

Name of the application server process.

Packets From MTP3

Total number of packets that the application server process receives from the MTP3 layer for the specified date.

Peak From MTP3

Highest hourly Packets From MTP3 for the application server process for the specified date.

Peak From Hour

Hour in which the Peak From MTP3 for the application server process occurred for the specified date.

Click the hour to see the ASP Hourly Report for the selected application server process and hour.

Packets To MTP3

Total number of packets sent to the MTP3 layer by the application server process for the specified date.

Peak To MTP3

Highest hourly Packets To MTP3 for the application server process for the specified date.

Peak To Hour

Hour in which the Peak To MTP3 for the application server process occurred for the specified date.

Click the hour to see the ASP Hourly Report for the selected application server process and hour.

Send Errors

Total number of errors that occurred when sending packets to the MTP3 layer for the specified date.

Peak Send Errors

Highest hourly Send Errors for the application server process for the specified date.

Peak Send Hour

Hour in which the Peak Send Errors for the application server process occurred for the specified date.

Click the hour to see the ASP Hourly Report for the selected application server process and hour.

Receive Errors

Total number of errors that occurred when receiving packets from the MTP3 layer for the specified date.

Peak Receive Errors

Highest hourly Receive Errors for the application server process for the specified date.

Peak Receive Hour

Hour in which the Peak Receive Errors for the application server process occurred for the specified date.

Click the hour to see the ASP Hourly Report for the selected application server process and hour.


Daily Application Server Process Peaks Reports

You can view a report of the statistics peaks for the application server process. The peaks report shows peak values for each day of the last 30 days, and the hour in which each peak occurred. The ASP Peaks Daily Report page shows a summary report of the daily application server process peak statistics by date and hour.

The ASP Peaks Daily Report table is sorted based on the information in the Peak From ASP column; however, you can sort the table based on the information in one of the other columns (see Navigating Table Columns, page 5-23).


Note If you do not enable data collection on the active report, a red status indicator and the words Data Collection Disabled appear next to the report title. Click the Data Collection Disabled link to see which command enables the report.

If a statistics calculation results in an undefined value, such as a number divided by zero (0), or an undefined number, based on the configuration, then MathError appears in the field.


Field or Column
Description

Date

Date of the report.

Node

Name of the node for the application server process.

ASP

Name of the application server process that recorded the peak value.

Peak From ASP

Highest hourly Packets From ASP for the application server for the selected day.

Peak From Hour

Hour in which the Peak From ASP for the application server process occurred for the selected day.

Click the hour to see the ASP Hourly Report for the selected application server process and hour.

Peak To ASP

Highest hourly Packets To ASP for the application server for the selected day.

Peak To Hour

Hour in which the Peak To ASP for the application server process occurred for the selected day.

Click the hour to see the ASP Hourly Report for the selected application server process and hour.

Peak Send Errors

Highest hourly Send Errors for the application server for the last 30 days.

Peak Send Hour

Hour in which the Peak Send Errors for the application server process occurred for the selected day.

Click the hour to see the ASP Hourly Report for the selected application server process and hour.

Peak Receive Errors

Highest hourly Receive Errors for the application server for the last 30 days.

Peak Receive Hour

Hour in which the Peak Receive Errors for the application server process occurred for the selected day.

Click the hour to see the ASP Hourly Report for the selected application server process and hour.


Daily Application Server Process MTP3 Peaks Reports

You can view a peaks report of the application server process MTP3 statistics. The peaks report shows peak values for each day and the hour in which each peak value occurred. The ASP MTP3 Peaks Daily Report page shows summary reports of the daily application server process MTP3 peak statistics by date and hour.

The ASP MTP3 Peaks Daily Report table is sorted based on the information in the Peak From MTP3 column; however, you can sort the table based on the information in one of the other columns (see Navigating Table Columns, page 5-23).


Note If you do not enable data collection on the active report, a red status indicator and the words Data Collection Disabled appear next to the report title. Click the Data Collection Disabled link to see which command enables the report.

If a statistics calculation results in an undefined value, such as a number divided by zero (0), or an undefined number, based on the configuration, then MathError appears in the field.


Field or Column
Description

Date

Date on which the peak values occurred.

Node

Name of the node for the application server process.

ASP

Name of the application server process that recorded the peak value.

Peak From MTP3

Highest hourly Packets From MTP3 to the application server process for the selected day.

Peak From Hour

Hour in which the Peak From MTP3 to the application server process occurred for the selected day.

Click the hour to see the ASP Hourly Report for the selected application server process and hour.

Peak To MTP3

Highest hourly Packets to MTP3 from the application server process for the selected day.

Peak To Hour

Hour in which the Peak to MTP3 from the application server process occurred for the selected day.

Click the hour to see the ASP Hourly Report for the selected application server process and hour.

Peak Send Errors

Highest hourly Send Errors for the application server process for the selected day.

Peak Send Hour

Hour in which the Peak Send Errors for the application server process occurred for the selected day.

Click the hour to see the ASP Hourly Report for the selected application server process and hour.

Peak Receive Errors

Highest hourly Receive Errors for the application server process for the selected day.

Peak Receive Hour

Hour in which the Peak Receive Errors for the application server process occurred for the selected day.

Click the hour to see the ASP Hourly Report for the selected application server process and hour.


Daily Application Server Process Archived Reports

The ASP Daily Archived Reports page shows summary reports of all archived MWTM daily network statistics for all application server processes that the MWTM detects for the server to which connect, stored as downloadable .zip files.

The .zip files are archived by type and date; for example, the sgmASPStats.DailySum.2007-02-13.csv.zip file contains the summary report of daily application server process statistics for February 13, 2007.

Each archived .zip file contains a comma-separated value (CSV) text file with a summary report of daily network statistics for all application server processes that the MWTM detected on that date and hour. You can download the .zip files and extract them.

To download a .zip file, right-click a filename, then save the file to a location of your choice. You can also import the file into Microsoft Excel.

For more information about the format of daily application server process statistics archived reports, see Application Server Process Statistics Daily and Peaks Daily Format, page I-2.

Hourly Application Server Process Archived Reports

The ASP Hourly Archived Reports page shows the summary reports of all archived MWTM hourly network statistics for all application server processes that the MWTM detects for the server to which you connect, stored as downloadable .zip files.

The .zip files are archived by type, date, and hour; for example, the sgmASPStats.2007-02-13.csv.zip file contains the summary report of daily application server process statistics for February 13, 2007.

Each archived .zip file contains a comma-separated value (CSV) text file with the summary report for hourly network statistics for all application server processes that the MWTM detected on that date and hour. You can download the .zip files and extract them.

To download a .zip file, click a filename, then save the file to a location of your choice. You can also import the file directly into Microsoft Excel.

For more information about the format of hourly application server process statistics archived reports, see Application Server Process Statistics Hourly Format, page I-3.

Link Reports


Note If you have MWTM User-Based Access enabled, these reports are available to users with authentication level 4 (Network Administrator) and higher.


You can view summary reports of hourly and daily statistics for links, and export the reports.

This section covers:

Hourly Link Reports

Daily Link Reports

Daily Link Peaks Reports

Link Multi-Day Utilization Report

Hourly Link Statistics Archived Reports

Daily Link Statistics Archived Reports

Linkset Reports

Daily Network Statistics Archived Reports

Rolling Network Statistics Archived Reports

Hourly Link Reports

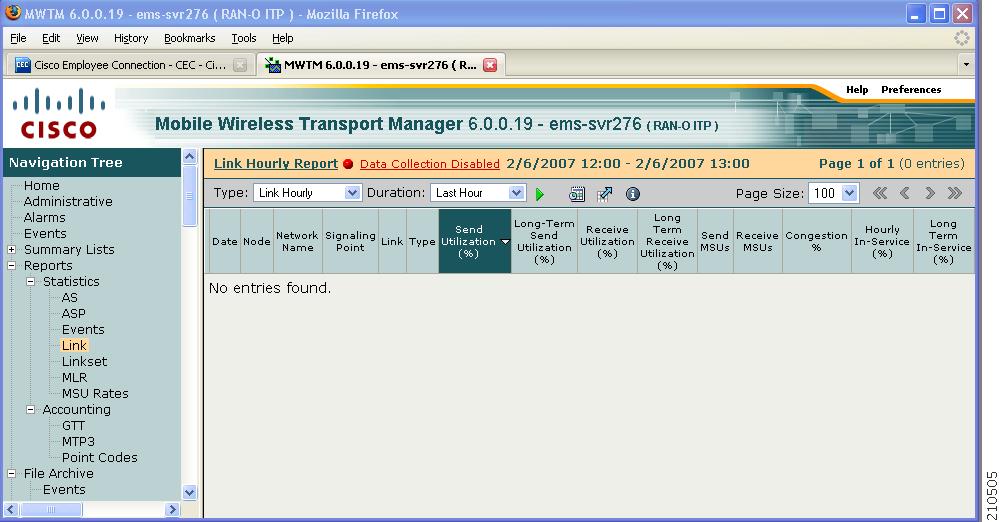
You can view hourly summaries of statistics for all links or a specific link that the MWTM detected on the specified date and hour. The Link Hourly Report page shows summary reports of hourly link statistics by date and hour.

The Link Hourly Report table is sorted based on the information in the Send Utilization or Send Erlangs column; however, you can sort the table based on the information in one of the other columns (see Navigating Table Columns, page 5-23).


Note If you do not enable data collection on the active report, a red status indicator and the words Data Collection Disabled appear next to the report title. Click the Data Collection Disabled link to see which command enables the report.

If a statistics calculation results in an undefined value, such as a number divided by zero (0), or an undefined number, based on the configuration, then MathError appears in the field.


Field or Column
Description

Date

Date of the report.

Node

Name of the node for the link.

Network Name

Name of the network for the link.

Signaling Point

Name of the signaling point for the link.

Link

Name of the link.

Type

Type of link. Possible link types are:

HSL—Uses the SS7-over-ATM (Asynchronous Transfer Mode) high-speed protocol.

SCTP—Uses the Stream Control Transmission Protocol (SCTP) IP transport protocol.

Serial—Uses the serial SS7 signaling protocol.

Virtual—A virtual link that connects signaling point instances that run on the same node. The MWTM does not poll virtual links; nor does it display real-time data or accounting statistics for virtual links.

Send Utilization
or
Send Erlangs

Average Send Utilization for the link, expressed as a utilization percentage or number of Erlangs (E) (as set with the mwtm webutil command) for the specified date and hour.

If you do not set the planned send capacity for the SCTP link, then NoCap appears in the field.

Receive Utilization
or
Receive Erlangs

Average Receive Utilization for the link, expressed as a utilization percentage or number of Erlangs (E) (as set with the mwtm webutil command) for the specified date and hour.

If you do not set the planned receive capacity for the SCTP link, then NoCap appears in the field

Long Term Send Utilization
or
Long Term Send Erlangs

Long-term average Send Utilization for the link, expressed as a utilization percentage or number of Erlangs (E) (as set with the mwtm webutil command), since MWTM polling began for the link, or since the MWTM last reset the averages as a result of bad data.

If you do not set the planned send capacity for the SCTP link, then NoCap appears in the field.

Long Term Receive Utilization
or
Long Term Receive Erlangs

Long-term average Receive Utilization for the link, expressed as a utilization percentage or number of Erlangs (E) (as set with the mwtm webutil command), since MWTM polling began for the link, or since the MWTM last reset the averages as a result of bad data.

If you do not set the planned receive capacity for the SCTP link, then NoCap appears in the field.

Send MSUs

Total number of MTP3 message signal units (MSUs) sent on the specified date and hour.

Receive MSUs

Total number of MTP3 MSUs received on the specified date and hour.

Congestion %

Percentage of time the link was congested on the specified date and hour.

Hourly In-Service

Percentage of time the link was in service on the specified date and hour.

Long Term In-Service

Average percentage of time the link was in service since MWTM polling began for the link, or since the MWTM last reset the averages as a result of bad data.


Daily Link Reports

You can view daily summaries of statistics for all links or for a specific link that the MWTM detected on the specified date and hour. The Link Daily Report page shows summary reports of daily link statistics by date and hour.

The Link Daily Report table is sorted based on the information in the Avg Send Utilization or Avg Send Erlangs column. However, you can sort the table based on the information in one of the other columns (see Navigating Table Columns, page 5-23).


Note If you do not enable data collection on the active report, a red status indicator and the words Data Collection Disabled appears next to the report title. Click the Data Collection Disabled link to see which command enables the report.

If a statistics calculation results in an undefined value, such as a number divided by zero (0), or an undefined number, based on the configuration, then MathError appears in the field.


Field or Column
Description

Date

Date of the report.

Node

Name of the node for the link.

Network Name

Name of the network for the link.

Signaling Point

Name of the signaling point for the link.

Link

Name of the link.

Type

Type of link. Possible link types are:

HSL—The link uses the SS7-over-ATM (Asynchronous Transfer Mode) high-speed protocol.

SCTP—The link uses the Stream Control Transmission Protocol (SCTP) IP transport protocol.

Serial—The link uses the serial SS7 signaling protocol.

Virtual—The link is a virtual link, which connects signaling point instances running on the same node. The MWTM does not poll virtual links, nor does it display real-time data or accounting statistics for virtual links.

Avg Send Utilization
or
Avg Send Erlangs

Average Send Utilization for the link, expressed as a utilization percentage or number of Erlangs (E) (as set with the mwtm webutil command) for the specified date.

If you do not set the planned send capacity for the SCTP link, then NoCap appears in the field.

Peak Send Utilization
or
Peak Send Erlangs

Highest hourly Average Send Utilization for the link, expressed as a utilization percentage or number of Erlangs (E) (as set with the mwtm webutil command) for the specified date.

Peak Send Hour

Hour in which the Peak Send Utilization for the link occurred for the specified date.

Click the hour to see the Link Hourly Report for the selected link and hour.

Long Term Send Utilization
or
Long Term Send Erlangs

Long-term average Send Utilization for the link, expressed as a utilization percentage or number of Erlangs (E) (as set with the mwtm webutil command), since MWTM polling began for the link, or since the MWTM last reset the averages as a result of bad data.

If you do not set the planned send capacity for the SCTP link, then NoCap appears in the field.

Avg Receive Utilization
or
Avg Receive Erlangs

Average Receive Utilization for the link, expressed as a utilization percentage or number of Erlangs (E) (as set with the mwtm webutil command) for the specified date.

If you do not set the planned receive capacity for the SCTP link, then NoCap appears in the field.

Peak Receive Utilization
or
Peak Receive Erlangs

Highest hourly Average Receive Utilization for the link, expressed as a utilization percentage or number of Erlangs (E) (as set with the mwtm webutil command) for the specified date.

Peak Receive Hour

Hour in which the Peak Receive Utilization for the link occurred for the specified date.

Click the hour to see the Link Hourly Report for the selected link and hour.

Long Term Receive Utilization
or
Long Term Receive Erlangs

Long-term average Receive Utilization for the link, expressed as a utilization percentage or number of Erlangs (E) (as set with the mwtm webutil command), since MWTM polling began for the link, or since the MWTM last reset the averages as a result of bad data.

If you do not set the planned receive capacity for the SCTP link, then NoCap appears in the field.

Send MSUs

Total number of MTP3 MSUs sent on the specified date.

Receive MSUs

Total number of MTP3 MSUs received on the specified date.

Avg Congestion %

Average percentage of time the link was congested on the specified date.

Daily In-Service

Average percentage of time the link was in service on the specified date.

Long Term In-Service

Average percentage of time the link was in service since MWTM polling began for the link, or since the MWTM last reset the averages as a result of bad data.

Daily Low In-Service

Lowest hourly in-service percentage for the link for the specified date.

Low Srv Hour

Hour in which the lowest in-service percentage occurred for the specified date.


Daily Link Peaks Reports

You can view a daily link statistics peaks report using the Link Peaks Daily Report page. The peaks report shows peak values for each day and the hour in which each peak value occurred.

The Link Peaks Daily table is sorted based on the information in the Peak Send Utilization or Peak Send Erlangs column. However, you can sort the table based on the information in one of the other columns (see Navigating Table Columns, page 5-23).


Note If you do not enable data collection on the active report, a red status indicator and the words Data Collection Disabled appear next to the report title. Click the Data Collection Disabled link to see which command enables the report.

If a statistics calculation results in an undefined value, such as a number divided by zero (0), or an undefined number, based on the configuration, then MathError appears in the field.


Field or Column
Description

Date

Date of the report.

Node

Name of the node for the link.

Network Name

Name of the network for the link.

Signaling Point

Name of the signaling point for the link.

Link

Name of the link that recorded the peak value.

Type

Type of link. Possible link types are:

HSL—The link uses the SS7-over-ATM (Asynchronous Transfer Mode) high-speed protocol.

SCTP—The link uses the Stream Control Transmission Protocol (SCTP) IP transport protocol.

Serial—The link uses the serial SS7 signaling protocol.

Virtual—The link is a virtual link, which connects signaling point instances running on the same node. The MWTM does not poll virtual links, nor does it display real-time data or accounting statistics for virtual links.

Peak Send Utilization
or
Peak Send Erlangs

Peak Send Utilization for the link for the selected day, expressed as a utilization percentage or number of Erlangs (E) (as set with the mwtm webutil command).

Peak Send Hour

Hour in which the Peak Send Utilization occurred for the selected day.

Click the hour to see the Link Hourly Report for the selected link and hour.

Peak Receive Utilization
or
Peak Receive Erlangs

Peak Receive Utilization for the link for the selected day, expressed as a utilization percentage or number of Erlangs (E) (as set with the mwtm webutil command).

Peak Receive Hour

Hour in which the Peak Receive Utilization occurred for the selected day.

Click the hour to see the Link Hourly Report for the selected link and hour.

Send MSUs

Total number of MTP3 MSUs sent on the specified date.

Receive MSUs

Total number of MTP3 MSUs received on the specified date.


Link Multi-Day Utilization Report

The Link Multi-Day Report page shows send and receive utilization percentages for all links for the last three or five days.

The Link Multi-Day table is sorted based on the information in the Avg Send Utilization column. However, you can sort the table based on the information in one of the other columns (see Navigating Table Columns, page 5-23).


Note If you do not enable data collection on the active report, a red status indicator and the words Data Collection Disabled appear next to the report title. Click the Data Collection Disabled link to see which command enables the report.

If a statistics calculation results in an undefined value, such as a number divided by zero (0), or an undefined number, based on the configuration, then MathError appears in the field.


Field or Column
Description

Node

Name of the node for the link.

Network Name

Name of the network for the link.

Signaling Point

Name of the signaling point for the link.

Link

Name of the link.

Avg. Send Utilization

Send Utilization for the link, expressed as a utilization percentage or number of Erlangs (E) (as set with the mwtm webutil command) for each of the last five days.

If you do not set the planned send capacity for the SCTP link, then NoCap appears in the field.

Avg. Receive Utilization

Receive Utilization for the link, expressed as a utilization percentage or number of Erlangs (E) (as set with the mwtm webutil command) for each of the last five days.

If you do not set the planned receive capacity for the SCTP link, then NoCap appears in the field.


Hourly Link Statistics Archived Reports

The Link Hourly Archived Reports page shows summary reports for all archived MWTM hourly network statistics for all links that the MWTM detected for the server to which you connect, stored as downloadable .zip files.

The .zip files are archived by type, date, and hour; for example, the sgmLinkStats.2007-02-13-09.csv.zip file contains the summary reports for daily link statistics for February 13, 2007 at 9:00am.

Each archived .zip file contains a comma-separated value (CSV) text file with a summary report of an hourly network statistics for all links that the MWTM detected on that date and hour. You can download the .zip files and extract them.

To download a .zip file, click a filename, then save the file to a location of your choice. You can also import the file directly into Microsoft Excel.

For more information about the format of hourly link statistics archived reports, see Link Statistics Hourly Format, page I-7.

Daily Link Statistics Archived Reports

The Link Daily Archived Reports page shows summary reports for all archived MWTM daily network statistics for all links that the MWTM detected for the server to which you connect, stored as downloadable .zip files.

The .zip files are archived by type and date; for example, the sgmLinkStats.DailySum.2007-02-13.csv.zip file contains the summary report of daily link statistics for February 13, 2007.

Each archived .zip file contains a comma-separated value (CSV) text file with a summary report of daily network statistics for all links that the MWTM detected on that date and hour. You can download the .zip files and extract them.

To download a .zip file, click a filename, then save the file to a location of your choice. You can also import the file directly into Microsoft Excel.

For more information about the format of daily link statistics archived reports, see Link Statistics Daily and Peaks Daily Format, page I-6.

Linkset Reports


Note If you have MWTM User-Based Access enabled, these reports are available to users with authentication level 4 (Network Administrator) and higher.


You can view summary reports of hourly and daily statistics for linksets, and export the reports.

This section covers:

Hourly Linkset Reports

Daily Linkset Reports

Daily Linkset Peaks Reports

Hourly Linkset Statistics Archived Reports

Daily Linkset Statistics Archived Reports

Hourly Linkset Reports

You can view hourly summaries of statistics for all linksets or for a specific linkset that the MWTM detected on the specified date and hour. The Linkset Hourly Report page shows summary reports for all archived MWTM hourly linkset statistics by date and hour.

The Linkset Hourly Report table is sorted based on the information in the Hourly In-Service column, then by the information in the Send Utilization or Send Erlangs column. However, you can sort the table based on the information in one of the other columns (see Navigating Table Columns, page 5-23).


Note If you do not enable data collection on the active report, a red status indicator and the words Data Collection Disabled appear next to the report title. Click the Data Collection Disabled link to see which command enables the report.

If a statistics calculation results in an undefined value, such as a number divided by zero (0), or an undefined number, based on the configuration, then MathError appears in the field.


Column
Description

Date

Date and time of the report.

Node

Name of the node for the linkset.

Network Name

Name of the network for the linkset.

Signaling Point

Name of the signaling point for the linkset.

Linkset

Name of the linkset.

Hourly In-Service

Percentage of time the linkset was in service on the specified date and hour.

Long Term In-Service

Average percentage of time the linkset was in service since the MWTM polling began for the linkset, or since the MWTM last reset the averages as a result of bad data.

Send Utilization
or
Send Erlangs

Average Send Utilization for the linkset, expressed as a utilization percentage or number of Erlangs (E) (as set with the mwtm webutil command) for the specified date and hour.

If you do not set the planned send capacity for one or more of the SCTP links associated with the linkset, then NoCap appears in the field.

Long Term Send Utilization
or
Long Term Send Erlangs

Long-term average Send Utilization for the linkset, expressed as a utilization percentage or number of Erlangs (E) (as set with the mwtm webutil command), since MWTM polling began for the linkset, or since the MWTM last reset the averages as a result of bad data.

If you do not set the planned send capacity for one or more of the SCTP links associated with the linkset, then NoCap appears in the field.

Receive Utilization
or
Receive Erlangs

Average Receive Utilization for the linkset, expressed as a utilization percentage or number of Erlangs (E) (as set with the mwtm webutil command) for the specified date and hour.

If you do not set the planned receive capacity for one or more of the SCTP links associated with the linkset, then NoCap appears in the field.

Long Term Receive Utilization
or
Long Term Receive Erlangs

Long-term average Receive Utilization for the linkset, expressed as a utilization percentage or number of Erlangs (E) (as set with the mwtm webutil command), since MWTM polling began for the linkset, or since the MWTM last reset the averages as a result of bad data.

If you do not set the planned receive capacity for one or more of the SCTP links associated with the linkset, then NoCap appears in the field.


Daily Linkset Reports

You can view daily summaries of statistics for all linksets or for a specific linkset that the MWTM detected on the specified date and hour. The Linkset Daily Report page shows summary reports of all archived MWTM daily linkset statistics by date and hour.

The Linkset Daily Report table is sorted based on the information in the Daily In-Service column, then by the information in the Avg Send Utilization or Avg Send Erlangs column. You can sort the table based on the information in one of the other columns (see Navigating Table Columns, page 5-23).


Note If you do not enable data collection on the active report, a red status indicator and the words Data Collection Disabled appear next to the report title. Click the Data Collection Disabled link to see which command enables the report.

If a statistics calculation results in an undefined value, such as a number divided by zero (0), or an undefined number, based on the configuration, then MathError appears in the field.


Field or Column
Description

Date

Date of the report.

Node

Name of the node for the linkset.

Network Name

Name of the network for the linkset.

Signaling Point

Name of the signaling point for the linkset.

Linkset

Name of the linkset.

Daily In-Service

Average percentage of time the linkset was in service on the specified date.

Long Term In-Service

Average percentage of time the linkset was in service since MWTM polling began for the linkset, or since the MWTM last reset the averages as a result of bad data.

Daily Low In-Service

Lowest hourly in-service percentage for the linkset for the specified date.

Low Srv Hour

Hour in which the lowest in-service percentage occurred for the specified date.

Avg Send Utilization
or
Avg Send Erlangs

Average Send Utilization for the linkset, expressed as a utilization percentage or number of Erlangs (E) (as set with the mwtm webutil command) for the specified date.

If you do not set the planned send capacity for one or more of the SCTP links associated with the linkset, then NoCap appears in the field.

Peak Send Utilization
or
Peak Send Erlangs

Highest hourly Average Send Utilization for the linkset, expressed as a utilization percentage or number of Erlangs (E) (as set with the mwtm webutil command) for the specified date.

Peak Send Hour

Hour in which the Peak Send Utilization for the linkset occurred for the specified date.

Click the hour to see the Link Hourly Report for all links associated with the selected linkset for the selected hour.

Long Term Send Utilization
or
Long Term Send Erlangs

Long-term average Send Utilization for the linkset, expressed as a utilization percentage or number of Erlangs (E) (as set with the mwtm webutil command), since MWTM polling began for the linkset, or since the MWTM last reset the averages as a result of bad data.

If you do not set the planned send capacity for one or more of the SCTP links associated with the linkset, then NoCap appears in the field.

Avg Receive Utilization
or
Avg Receive Erlangs

Average Receive Utilization for the linkset, expressed as a utilization percentage or number of Erlangs (E) (as set with the mwtm webutil command) for the specified date.

If you do not set the planned receive capacity for one or more of the SCTP links associated with the linkset, then NoCap appears in the field.

Peak Receive Utilization
or
Peak Receive Erlangs

Highest hourly Average Receive Utilization for the linkset, expressed as a utilization percentage or number of Erlangs (E) (as set with the mwtm webutil command) for the specified date.

Peak Receive Hour

Hour in which the Peak Receive Utilization for the linkset occurred for the specified date.

Click the hour to see the Link Hourly Report for all links associated with the selected linkset for the selected hour.

Long Term Receive Utilization
or
Long Term Receive Erlangs

Long-term average Receive Utilization for the linkset, expressed as a utilization percentage or number of Erlangs (E) (as set with the mwtm webutil command), since MWTM polling began for the linkset, or since the MWTM last reset the averages as a result of bad data.

If you do not set the planned receive capacity for one or more of the SCTP links associated with the linkset, then NoCap appears in the field.


Daily Linkset Peaks Reports

You can view a daily linkset statistics peaks report using the Linkset Peaks Daily Report page. The peaks report shows peak values for each day and the hour in which each peak value occurred.

The Linkset Peaks Daily Report table is sorted based on the information in the Peak Send Utilization or Peak Send Erlangs column. However, you can sort the table based on the information in one of the other columns (see Navigating Table Columns, page 5-23).


Note If you do not enable data collection on the active report, a red status indicator and the words Data Collection Disabled appear next to the report title. Click the Data Collection Disabled link to see which command enables the report.

If a statistics calculation results in an undefined value, such as a number divided by zero (0), or an undefined number, based on the configuration, then MathError appears in the field.


Field or Column
Description

Date

Date of the report.

Node

Name of the node for the linkset.

Network Name

Name of the network for the linkset.

Signaling Point

Name of the signaling point for the linkset.

Linkset

Name of the linkset that recorded the peak value.

Peak Send Utilization
or
Peak Send Erlangs

Peak Send Utilization for the linkset for the selected day, expressed as a utilization percentage or number of Erlangs (E) (as set with the mwtm webutil command).

Peak Send Hour

Hour in which the Peak Send Utilization occurred for the selected day.

To see the Link Statistics - Hourly Report for all links associated with the selected linkset for the selected hour, click the hour.

Long Term Send Utilization
or
Long Term Send Erlangs

Long-term average Send Utilization for the linkset, expressed as a utilization percentage or number of Erlangs (E) (as set with the mwtm webutil command), since MWTM polling began for the linkset, or since the MWTM last reset the averages as a result of bad data.

Peak Receive Utilization
or
Peak Receive Erlangs

Peak Receive Utilization for the linkset for the selected day, expressed as a utilization percentage or number of Erlangs (E) (as set with the mwtm webutil command).

Peak Receive Hour

Hour in which the Peak Receive Utilization occurred for the selected day.

Click the hour to see the Link Hourly Report for all links associated with the selected linkset for the selected hour.

Long Term Receive Utilization
or
Long Term Receive Erlangs

Long-term average Receive Utilization for the linkset, expressed as a utilization percentage or number of Erlangs (E) (as set with the mwtm webutil command), since MWTM polling began for the linkset, or since the MWTM last reset the averages as a result of bad data.


Hourly Linkset Statistics Archived Reports

The Linkset Hourly Archived Reports page shows summary reports of all archived MWTM hourly network statistics for all linksets that the MWTM detects for the server to which you connect, stored as downloadable .zip files.

The .zip files are archived by type, date, and hour; for example, the sgmLinksetStats.2007-02-13.csv.zip file contains the summary report for the daily linkset statistics for February 13, 2007.

Each archived .zip file contains a comma-separated value (CSV) text file with a summary report of hourly network statistics for all linksets that the MWTM detected on that date and hour. You can download the .zip files and extract them.

To download a .zip file, click a filename, then save the file to a location of your choice. You can also import the file directly into Microsoft Excel.

For more information about the format of hourly linkset statistics archived reports, see Linkset Statistics Hourly Format, page I-9.

Daily Linkset Statistics Archived Reports

The Linkset Daily Archived Reports page shows the summary report of all archived MWTM daily network statistics for all linksets that the MWTM detected for the server to which you connect, stored as downloadable .zip files.

The .zip files are archived by type and date; for example, the sgmLinksetStats.DailySum.2007-02-13.csv.zip file contains the summary reports of daily linkset statistics for February 13, 2007.

Each archived .zip file contains a comma-separated value (CSV) text file with a summary report of daily network statistics for all linksets that the MWTM detected on that date and hour. You can download the .zip files and extract them.

To download a .zip file, click a filename, then save the file to a location of your choice. You can also import the file directly into Microsoft Excel.

For more information about the format of daily linkset statistics archived reports, see Linkset Statistics Daily and Peaks Daily Format, page I-8.

MLR Reports


Note If you have MWTM User-Based Access enabled, these reports are available to users with authentication level 4 (Network Administrator) and higher.


Multi-Layer SMS Routing, or MLR, is a routing scheme that enables intelligent routing of Short Message Service (SMS) mobile originated (MO) messages based on the application or service from which they originated or to which they are destined. The MLR feature can make SMS message routing decisions based on information found in the TCAP, MAP, and MAP-user layers; MAP operation codes MAP-MT-FORWARD-SM and SEND-ROUTING-INFO-FOR-SM; and ANSI TCAP and IS-41 MAP operations.

You can view a summary report of daily statistics for MLR. You can also export the reports.

This section covers:

Daily MLR Reports

Daily MLR Statistics Archived Reports

Daily MLR Reports

You can view a summary report of MLR processed, aborts, continues, result invokes, rule matches, subtriggers, and triggers statistics for the MWTM on a specified date. The MLR type Daily Report page shows reports of all archived MWTM daily MLR processed, aborts, continues, result invokes, rule matches, subtriggers, and triggers by date.

These archived daily MLR reports are available:

Daily MLR Aborts Reports

Daily MLR Continues Reports

Daily MLR Processed Reports

Daily MLR Result Invokes Reports

Daily MLR RuleMatches Reports

Daily MLR SubTriggers Reports

Daily MLR Triggers Reports

Daily MLR Aborts Reports

The MLR Aborts Daily Report table is sorted based on the information in the Total Aborted column. However, you can sort the table based on the information in one of the columns (see Navigating Table Columns, page 5-23).


Note If you do not enable data collection on the active report, a red status indicator and the words Data Collection Disabled appear next to the report title. Click the Data Collection Disabled link to see which command enables the report.

If a statistics calculation results in an undefined value, such as a number divided by zero (0), or an undefined number, based on the configuration, then MathError appears in the field.


Field or Column
Description

Date

Date of the report.

Node

Name of the node for the signaling point.

Network Name

Name of the network for the signaling point.

Signaling Point

Name of the signaling point.

Total Aborted

Total number of MSUs aborted by MLR on the specified date.

No Resources

Number of MSUs aborted by MLR because of a shortage of resources on the specified date.

Results Blocked

Number of MSUs aborted by MLR with a result of block on the specified date.

GTI Mismatches

Number of MSUs aborted by MLR because of mis-matched GTIs on the specified date.

Addr Conv Fails

Number of MSUs aborted by MLR because of a failed GTA address conversion on the specified date.

Dest Unavails

Number of MSUs aborted by MLR because the destination was unavailable on the specified date.

No Server Aborteds

Number of MSUs aborted by MLR because no server was available on the specified date.


Daily MLR Continues Reports

The MLR Continues Daily Report table is sorted based on the information in the Total Continued column. However, you can sort the table based on the information in one of the columns (see Navigating Table Columns, page 5-23).


Note If you do not enable data collection on the active report, a red status indicator and the words Data Collection Disabled appear next to the report title. Click the Data Collection Disabled link to see which command enables the report.

If a statistics calculation results in an undefined value, such as a number divided by zero (0), or an undefined number, based on the configuration, then MathError appears in the field.


Field or Column
Description

Date

Date of the report.

Node

Name of the node for the signaling point.

Network Name

Name of the network for the signaling point.

Signaling Point

Name of the signaling point.

Total Continued

Total number of MSUs returned to SCCP by MLR with a result of continue on the specified date.

Unsupp Msg Type

Number of MSUs returned to SCCP by MLR because of unsupported message types on the specified date.

Unsupp Seg SCCP

Number of MSUs returned to SCCP by MLR because of unsupported SCCP segments on the specified date.

Unsupported Msgs

Number of MSUs returned to SCCP by MLR because of parse failures resulting from unsupported messages on the specified date.

Parse Errors

Number of MSUs returned to SCCP by MLR because of parse errors on the specified date.

No Results

Number of MSUs returned to SCCP by MLR with no results on the specified date.

Result Continueds

Number of MSUs returned to SCCP by MLR with a result of continue on the specified date.

No Server Continueds

Number of MSUs returned to SCCP by MLR because no server was available on the specified date.

Result GTTs

Number of MSUs returned to SCCP by MLR with a result of GTT on the specified date.

Failed Trigs

Number of MSUs returned to SCCP by MLR because of no trigger match on the specified date.


Daily MLR Processed Reports

The MLR Processed Daily Report table is sorted based on the information in the Routed column. However, you can sort the table based on the information in one of the columns (see Navigating Table Columns, page 5-23).


Note If you do not enable data collection on the active report, a red status indicator and the words Data Collection Disabled appear next to the report title. Click the Data Collection Disabled link to see which command enables the report.

If a statistics calculation results in an undefined value, such as a number divided by zero (0), or an undefined number, based on the configuration, then MathError appears in the field.


Field or Column
Description

Date

Date of the report.

Node

Name of the node for the signaling point.

Network Name

Name of the network for the signaling point.

Signaling Point

Name of the signaling point.

Routed

Total number of packets routed by MLR on the specified date.

Total Continued

Total number of MSUs passed back to SCCP processing by MLR on the specified date.

Total Aborted

Total number of MSUs not processed by MLR because of invalid data or a blocked MSU.

MAP SMS-MOs

Number of MSUs of type GSM-MAP SMS-MO processed by MLR on the specified date.

MAP SMS-MTs

Number of MSUs of type GSM-MAP SMS-MT processed by MLR on the specified date.

MAP SRI-SMs

Number of MSUs of type GSM-MAP SRI-SM processed by MLR on the specified date.

MAP AlertScs

Number of MSUs of type GSM-MAP AlertSc processed by MLR on the specified date.

ANSI-41 SMD-PPs

Number of MSUs of type ANSI-41 SMD-PP processed by MLR on the specified date.

ANSI-41 SMS-Reqs

Number of MSUs of type ANSI-41 SMSRequest processed by MLR on the specified date.

ANSI-41 SMS-Notifys

Number of MSUs of type ANSI-41 SMSNotify processed by MLR on the specified date.

Links

Contains links to related MLR reports (Aborts, Continues, Triggers, SubTriggers, RuleMatches, and ResultInvokes). The target report is filtered by the signaling point.


Daily MLR Result Invokes Reports

The MLR Result Invokes Daily Report table is sorted based on the information in the Invokes column. However, you can sort the table based on the information in one of the columns (see Navigating Table Columns, page 5-23).


Note If you do not enable data collection on the active report, a red status indicator and the words Data Collection Disabled appear next to the report title. Click the Data Collection Disabled link to see which command enables the report.

If a statistics calculation results in an undefined value, such as a number divided by zero (0), or an undefined number, based on the configuration, then MathError appears in the field.


Field or Column
Description

Date

Date of the report.

Node

Name of the node for the signaling point.

Network Name

Name of the network for the signaling point.

Signaling Point

Name of the signaling point.

ResultSet

Name of the result set of which this result is a member.

Result Number

Number of this result within the result set.

Invokes

Total number of times this result was invoked.


Daily MLR RuleMatches Reports

The MLR RuleMatches Daily Report table is sorted based on the information in the Matches column. However, you can sort the table based on the information in one of the columns (see Navigating Table Columns, page 5-23).


Note If you do not enable data collection on the active report, a red status indicator and the words Data Collection Disabled appear next to the report title. Click the Data Collection Disabled link to see which command enables the report.

If a statistics calculation results in an undefined value, such as a number divided by zero (0), or an undefined number, based on the configuration, then MathError appears in the field.


Field or Column
Description

Date

Date of the report.

Node

Name of the node for the signaling point.

Network Name

Name of the network for the signaling point.

Signaling Point

Name of the signaling point.

RuleSet

Name of the rule set of which this rule is a member.

Rule Number

Number of this rule within the rule set.

Matches

Total number of times this rule was matched.


Daily MLR SubTriggers Reports

The MLR SubTriggers Daily Report table is sorted based on the information in the Matches column. However, you can sort the table based on the information in one of the columns (see Navigating Table Columns, page 5-23).


Note If you do not enable data collection on the active report, a red status indicator and the words Data Collection Disabled appear next to the report title. Click the Data Collection Disabled link to see which command enables the report.

If a statistics calculation results in an undefined value, such as a number divided by zero (0), or an undefined number, based on the configuration, then MathError appears in the field.


Field or Column
Description

Date

Date of the report.

Node

Name of the node for the signaling point.

Network Name

Name of the network for the signaling point.

Signaling Point

Name of the signaling point.

Trigger Index

Index number associated with the trigger.

Sub Trigger Index

Index number associated with the subtrigger.

Action

Action taken by the subtrigger. Clicking on the ruleset name highlights the the signaling point in the navigation tree and opens the MLR Trigger Config tab for the selected ruleset.

Parameters

Parameters that control the behavior of the subtrigger.

Matches

Number of subtrigger matches with result Action Performed.


Daily MLR Triggers Reports

The MLR Triggers Daily Report table is sorted based on the information in the Matches column. However, you can sort the table based on the information in one of the columns (see Navigating Table Columns, page 5-23).


Note If you do not enable data collection on the active report, a red status indicator and the words Data Collection Disabled appear next to the report title. Click the Data Collection Disabled link to see which command enables the report.

If a statistics calculation results in an undefined value, such as a number divided by zero (0), or an undefined number, based on the configuration, then MathError appears in the field.


Field or Column
Description

Date

Date of the report.

Node

Name of the node for the signaling point.

Network Name

Name of the network for the signaling point.

Signaling Point

Name of the signaling point.

Trigger Index

Index number associated with the trigger.

Action

Action taken by the trigger. Clicking on the ruleset name highlights the the signaling point in the navigation tree and opens the MLR Trigger Config tab for the selected ruleset.

Parameters

Parameters that control the behavior of the trigger.

Preliminary Matches

Preliminary count of trigger matches.

Matches

Number of trigger matches with result Action Performed.

Links

Contains links to related MLR SubTrigger reports. The target report is filtered by the signaling point.


Daily MLR Statistics Archived Reports

The MLR Daily Archived Reports page shows all archived MWTM daily MLR processed, aborts, continues, result invokes, rule matches, subtriggers, and triggers statistics reports for the server to which you connect, stored as downloadable .zip files.

The .zip files are archived by type and date; for example, the:

mwtmMLRStats.DailyAbortCons.2007-02-13.csv.zip file contains the daily MLR aborts and report for February 13, 2007.

mwtmMLRStats.DailyProcessed.2007-02-13.csv.zip file contains the daily MLR processed report for February 13, 2007.

mwtmMLRStats.DailyResultInvokes.2007-02-13.csv.zip file contains the daily MLR result invokes report for February 13, 2007.

mwtmMLRStats.DailyRuleMatches.2007-02-13.csv.zip file contains the daily MLR rule matches report for February 13, 2007.

mwtmMLRStats.DailySubTriggers.2007-02-13.csv.zip file contains the daily MLR subtriggers report for February 13, 2007.

mwtmMLRStats.DailyTriggers.2007-02-13.csv.zip file contains the daily MLR triggers report for February 13, 2007.

Each archived .zip file contains a comma-separated value (CSV) text file with a daily MLR statistics report for that date. You can download the .zip files and extract them.

To download a .zip file, click a filename, then save the file to a location of your choice. You can also import the file directly into Microsoft Excel.

For more information about the format of MLR statistics archived reports, see:

MLR Aborts and Continues Daily Format, page I-10

MLR Processed Statistics Daily Format, page I-10

MLR Result Invokes Statistics Daily Format, page I-11

MLR Rule Matches Statistics Daily Format, page I-11

MLR SubTriggers Daily Format, page I-12

MLR Triggers Daily Format, page I-12

MSU Rates Reports


Note If you have MWTM User-Based Access enabled, these reports are available to users with authentication level 4 (Network Administrator) and higher.


You can view 15 minute, hourly and daily MSU rates reports. You can also export the reports.

This section covers:

MSU Load Reports

MSU Peaks Reports

MSU Load Reports

You can view a 15 minute, hourly, or daily report of MSU load rates for all nodes that the MWTM detected in that time. The MSU Load Report provides the distribution of send and receive MSU packets, pertaining to overload thresholds for every CPU.

The MSU Load Report tables are sorted based on the information in the Date column. However, you can sort the tables based on the information in one of the columns (see Navigating Table Columns, page 5-23).

Field or Column
Description

Date

Date of the report.

Node

Name of the node.

Processor Slot/Bay

The number of the slot and bay containing the processor. This number is set to zero when the platform does not support processors in multiple slots or bays.

Overloaded Threshold

Over this rate of traffic, MSU traffic handling may be impacted.

Duration % Send

Duration of time the send MSU rate is within the specified percentage.

Duration % Receive

Duration in time the receive MSU rate is within the specified percentage.


MSU Peaks Reports

You can view a 15 minute, hourly, or daily report of MSU peak rates for all nodes that the MWTM detected in that time. The MSU Peaks Report page provides information that helps you analyze the maximum send and receive rates for each processor in MSU units per second.

The MSU Peaks Report tables are sorted based on the information in the Send column. However, you can sort the tables based on the information in one of the columns (see Navigating Table Columns, page 5-23).

Field or Column
Description

Date

Date of the report.

Node

Name of the node.

Processor Slot/Bay

Number of the slot and bay containing the processor. This number is set to zero when the platform does not support processors in multiple slots or bays.

Max Rate Send

This value records the highest rate of MSUs per second sent by the processor since the measurement was cleared.

Max Rate Receive

This value records the highest rate of MSU per second received by the processor since the measurement was cleared.

Threshold Acceptable

Specifies a level of traffic below which traffic is considered to be acceptable. Once the traffic rate exceeds the Warning threshold, it is not Acceptable until traffic falls below this threshold.

Threshold Warning

Specifies a level of traffic that should be avoided, but is below a level that impacts MSU routing. Once the traffic rate exceeds the Overloaded threshold, it is not considered non-impacting until the traffic falls below this threshold.

Threshold Overloaded

Specifies a level of traffic indicating a rate that may impact MSU routing.

Duration in Acceptable Threshold Send

Rate of traffic (in seconds) sent by this processor considered as acceptable.

Duration in Acceptable Threshold Receive

Rate of traffic (in seconds) received by this processor considered as acceptable.

Duration in Warning Threshold Send

Rate of traffic (in seconds) sent by this processor considered above the acceptable level and below a level that impacts MSU routing.

Duration in Warning Threshold Receive

Rate of traffic (in seconds) received by this processor considered above the acceptable level and below a level that impacts MSU routing.

Duration in Overloaded Threshold Send

Rate of traffic (in seconds) sent by this processor at a level that may impact MSU routing.

Duration in Overloaded Threshold Receive

Rate of traffic (in seconds) received by this processor at a level that may impact MSU routing.


GTT Accounting Reports


Note If you have MWTM User-Based Access enabled, these reports are available to users with authentication level 4 (Network Administrator) and higher.


You can view summary reports of hourly and daily GTT accounting statistics. You can also export the reports.

This section covers:

GTT Accounting Statistics Daily Summary Reports

Daily GTT Accounting Statistics Archived Reports

GTT Accounting Statistics Daily Summary Reports

You can view a daily summary of GTT accounting statistics for all nodes that the MWTM detected on a specified date. The GTT Accounting Daily Report page shows all MWTM daily GTT accounting statistics detail reports by date. Each file contains a daily summary of GTT accounting statistics for all nodes that the MWTM detected on a specified date.

The GTT Accounting Daily Report table is sorted based on the information in the Packets column. However, you can sort the table based on the information in one of the other columns (see Navigating Table Columns, page 5-23).


Note If you do not enable data collection on the active report, a red status indicator and the words Data Collection Disabled appear next to the report title. Click the Data Collection Disabled link to see which command enables the report.

If a statistics calculation results in an undefined value, such as a number divided by zero (0), or an undefined number, based on the configuration, then MathError appears in the field.


Field or Column
Description

Date

Date of the report.

Node

Name of the node associated with the From Network Name for which data is visible.

From Network Name

Name of the network from which GTT traffic originated, and for which data is visible.

Signaling Point

Name of the signaling point associated with the From Network Name instance for which data is visible.

Linkset

Name of the linkset associated with the From Network Name instance for which data is visible.

Selector

Name of the selector.

GTA

Global Title Address (GTA) associated with the selector.

To Network Name

For version 4.1 GTT files (corresponding to ITP software release 12.2(20)SW or greater) and 4.2 GTT files (corresponding to ITP software release 12.2(21)SW1 or greater), name of the network in which the translated point code resides.

For version 3.1 GTT files (corresponding to ITP software releases 12.2(4)MB9 and 12.2(4)MB9a) and 4.0 GTT files (corresponding to ITP software release 12.2(4)MB10 or greater), the value of this field is identical to that of the From Network Name field.

Point Code

Destination point code for the GTA.

Packets

Total number of packets translated by GTT on the specified date.

Octets

Total number of octets translated by GTT on the specified date.


Daily GTT Accounting Statistics Archived Reports

The GTT Daily Archived Accounting Reports page shows all archived MWTM daily GTT accounting statistics reports for the server to which you connect, stored as downloadable .zip files.

The .zip files are archived by type and date; for example, the sgmGTTStats.DailyDetail.2007-02-13.csv.zip file contains the daily GTT accounting statistics report for February 13, 2007.

Each archived .zip file contains a comma-separated value (CSV) text file with a daily GTT accounting statistics report for that date. You can download the .zip files and extract them.

To download a .zip file, click a filename, then save the file to a location of your choice. You can also import the file directly into Microsoft Excel.

For more information about the format of GTT accounting statistics archived reports, see GTT Accounting Statistics Daily Format, page I-5.

MTP3 Accounting Reports


Note If you enable MWTM User-Based Access, these reports are available to users with authentication level 4 (Network Administrator) and higher.


You can view a daily summary of MTP3 accounting statistics for the MWTM on a specified date. You can also export the reports.

This section covers:

MTP3 Accounting Statistics Daily Detail Reports

Daily MTP3 Accounting Statistics Archived Reports


Note Every five minutes (by default), the ITP moves data records from a quick-access table to a database that stores long term accounting records. This database contains accumulated accounting data since the last clearing or from the time accounting was originally enabled. The MWTM shows only the data from this database, not from the quick-access table.


MTP3 Accounting Statistics Daily Detail Reports

You can view a daily summary of MTP3 accounting statistics for the MWTM on a specified date. The MTP3 Accounting Daily Report page shows detail reports of all MWTM daily MTP3 accounting statistics by date. Each file contains a daily summary of MTP3 accounting statistics for the MWTM on a specified date.

The MTP3 Accounting Daily Report table is sorted based on the information in the Send MSUs column. However, you can sort the table based on the information in one of the other columns (see Navigating Table Columns, page 5-23).


Note If you do not enable data collection on the active report, a red status indicator and the words Data Collection Disabled appear next to the report title. Click the Data Collection Disabled link to see which command enables the report.

If a statistics calculation results in an undefined value, such as a number divided by zero (0), or an undefined number, based on the configuration, then MathError appears in the field.


Field or Column
Description

Date

Date of the report.

Node

Name of the node for the linkset.

Network Name

Name of the network for the linkset.

Signaling Point

Name of the signaling point for the linkset.

Linkset

Name of the linkset.

Gateway Screening

Indicates whether the traffic passed or failed the Gateway Screening test at the ITP.

To see only statistics that passed or failed for a specific linkset, select a linkset and click Pass, Fail, or Unroutable.

OPC

Originating point code of the traffic, which is a unique identifier for each set of statistics.

To see only statistics that match a specific OPC for a given linkset, find the linkset and click the point code.

DPC

Destination point code of the traffic.

To see only statistics that match a specific DPC for a given linkset, find the linkset and click the point code.

SI

Service indicator, which indicates the type of SS7 traffic. Valid values include:

0—Signaling Network Management Message (SNM)

1—Maintenance Regular Message (MTN)

2—Maintenance Special Message (MTNS)

3—Signaling Connection Control Part (SCCP)

4—Telephone User Part (TUP)

5—ISDN User Part (ISUP)

6—Data User Part (call and circuit-related messages)

7—Data User Part (facility registration/cancellation messages)

To see only more information for a specific type of SI, click the SI type.

Send MSUs

Total number of MTP3 MSUs sent on the specified date.

Receive MSUs

Total number of MTP3 MSUs received on the specified date.

Send Bytes

Total number of bytes sent on the specified date.

Receive Bytes

Total number of bytes received on the specified date.


Daily MTP3 Accounting Statistics Archived Reports

The MTP3 Daily Archived Accounting Reports page shows all archived MWTM daily MTP3 accounting statistics reports for the server to which you connect, stored as downloadable .zip files.

The .zip files are archived by date; for example, the sgmAccStats.DailyDetail.2007-02-13.csv.zip file contains the daily MTP3 accounting statistics report for February 13, 2007.


Note To limit the maximum number of rows in export CSV files (for example, Excel can only handle about 65535 rows) see mwtm statreps maxcsvrows, page B-111.


Each archived .zip file contains a comma-separated value (CSV) text file with a daily MTP3 accounting statistics report for that date. You can download the .zip files and extract them.

To download a .zip file, click a filename, then save the file to a location of your choice. You can also import the file directly into Microsoft Excel.

For more information about the format of accounting statistics archived reports, see MTP3 Accounting Statistics Daily Format, page I-14.

ITP Point Code Reports


Note If you have MWTM User-Based Access enabled, these reports are available to users with authentication level 4 (Network Administrator) and higher.


You can view current and daily point code inventory reports using the MWTM. You can also export the reports.

This section covers:

Current Point Code Inventory

Daily Point Code Archived Reports

Current Point Code Inventory

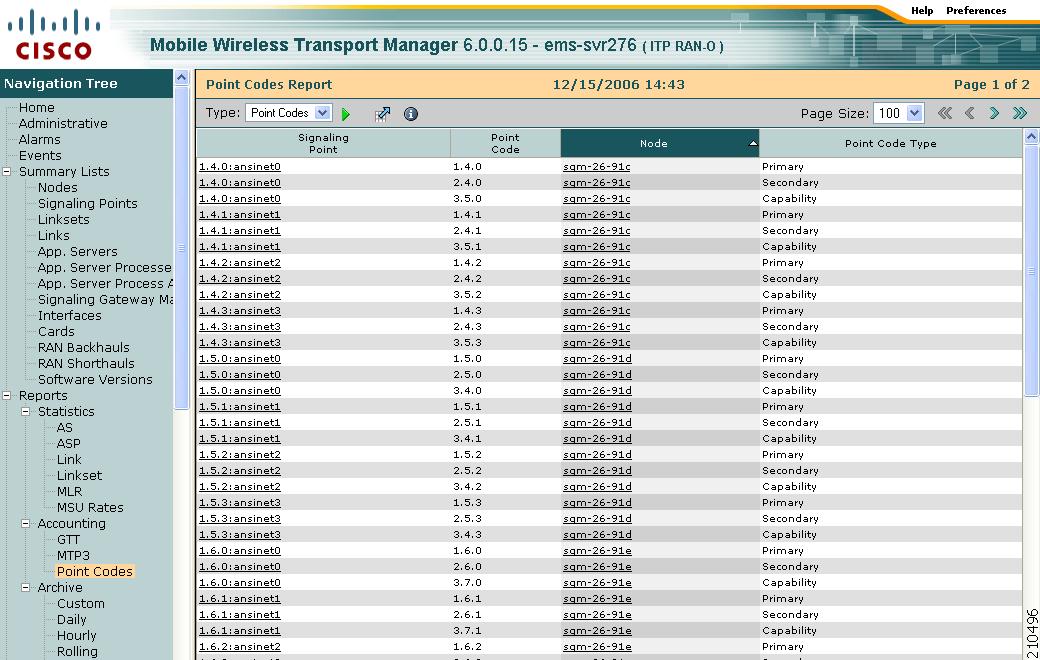
The Point Codes Report page shows all point codes that are currently being used by all nodes that the MWTM detected.

The MWTM shows the Point Codes Report page.

Figure 12-2 Point Codes Report Page

The Point Codes Report table is sorted based on the information in the Node column. However, you can sort the table based on the information in any of the columns (see Navigating Table Columns, page 5-23).

Field or Column
Description

Signaling Point

Signaling point that is currently being used by a node.

To sort the point codes by signaling point in descending order, click the Signaling Points heading.

Click again to sort the point codes in ascending order.

Point Code

Point code that is currently being used by a node.

To sort the point codes by point code in ascending order, click the Point Codes heading. This is the default display.

Click again to sort the point codes in descending order.

Node

Name or IP address of the node.

To see more information for the node, click the node name.

To sort the point codes by node in descending order, click the Node heading.

Click again to sort the point codes in ascending order.

Point Code Type

Type of point code:

Primary—Main point code used by a node.

Secondary—Alternate or backup point code used by a node.

Capability—Shared by more than one node, each of which is also assigned a real point code. Also called an alias point code.

To sort the point codes by type in ascending order, click the Point Code Type heading.

Click again to sort the point codes in descending order.


Daily Point Code Archived Reports

The Point Codes Daily Archived Reports page shows all archived MWTM daily point code inventory reports for the server to which you connect, stored as downloadable .zip files.

On the Point Codes Daily Archived Reports page, the .zip files are archived by date; for example, the sgmPointCodes.DailyInv.2007-02-13.csv.zip file contains the daily point code inventory report for February 13, 2007.

Each archived .zip file contains a comma-separated value (CSV) text file with a list of all point codes that were being used by all nodes that the MWTM detected on that date. You can download the The .zip files and extract them.

To download a .zip file, click a filename, then save the file to a location of your choice. You can also import the file directly into Microsoft Excel.

For more information about the format of point code inventory archived reports, see Point Code Inventory Format, page I-15.

MTP3 Event Reports


Note If you have MWTM User-Based Access enabled, these reports are available to users with authentication level 4 (Network Administrator) and higher.


This section contains:

Hourly MTP3 Event Reports

Custom MTP3 Event Reports

Hourly MTP3 Event Reports

To create hourly MTP3 event reports for the MWTM:


Step 1 Log in as the root user, as described in Starting the MWTM Client, page 4-2, or as a superuser, as described in Specifying a Super User (Server Only), page 2-18.

Step 2 Enter these commands:

# cd /opt/CSCOsgm/bin
# ./mwtm evreps enable
# ./mwtm evreps mtp

For more details on the mwtm evreps commands, see Appendix B, "Command Reference."


The MTP3 Events Hourly Archived Reports page shows all hourly MWTM MTP3 event reports for the server to which you connect.

The .zip files are archived by type, date, and hour; for example, the sgmMTP3Events.2006-06-29-08.csv.zip file contains a summary report of the hourly MTP3 event for the eighth hour on June 29, 2006.

Each archived .zip file contains a comma-separated value (CSV) text file with a summary report of an hourly MTP3 event for all objects that the MWTM detected on that date and hour. You can download the .zip files and extract them.

To download a .zip file, click a filename, then save the file to a location of your choice. You can also import the file directly into Microsoft Excel.

Custom MTP3 Event Reports

To create custom MTP3 event reports for the MWTM:


Step 1 Log in as the root user, as described in Starting the MWTM Client, page 4-2, or as a superuser, as described in Specifying a Super User (Server Only), page 2-18.

Step 2 Enter these commands:

# cd /opt/CSCOsgm/bin
# ./mwtm mtpevents

For more details on the mwtm mtpevents command, see Appendix B, "Command Reference."


The Custom MTP3 Events Archived Reports page shows all custom MWTM MTP3 event reports for the server to which you connect.

Field or Column
Description

Export File

Name of the custom network events export .zip file, archived by type, date, and hour; for example, the sgmMTP3Events.custom.20867.2006-02-13-16-15.csv.zip file contains the summary report of custom network events with ID tag 20867 for the 15th minute of the 16th hour on February 13, 2006.

Each archived .zip file contains a comma-separated value (CSV) text file with a daily statistics report for that date. You can download the .zip files and extract them.

To download a .zip file, click a filename, then save the file to a location of your choice. You can also import the file directly into Microsoft Excel.

For more information about the format of custom statistics archived reports, see Custom Network Reports File Formats, page I-17.

Report Start Date (EST)

Date and time the custom report began.

Report Finish Date (EST)

Date and time the custom report ended.

Last Modified Date (EST)

Date and time the custom report was last modified.

View

Shows the custom detail report for the object.


Enabling Custom Archived Statistics Reports


Note If you have MWTM User-Based Access enabled, these reports are available to users with authentication level 4 (Network Administrator) and higher.


In the MWTM, you can create summary reports of custom archived statistics and accounting and send them to an export file.

To create a custom archived report for the MWTM:


Step 1 Log in as the root user, as described in Starting the MWTM Client, page 4-2, or as a superuser, as described in Specifying a Super User (Server Only), page 2-18.

Step 2 Enter:

# cd /opt/CSCOsgm/bin 

Step 3 Based on the type of custom report you want to generate, enter one of these commands and arguments to enable that report:

Custom Report
Command

Application server and application server processes custom statistics

# ./mwtm xuastats [node-list [id-tag]] [sort-option] [quiet]

GTT accounting statistics

# ./mwtm gttstats [node-list [id-tag]] [sort-option] [quiet]

Link and linkset summary

# ./mwtm linkstats [node-list [id-tag]] [sort-option] [quiet]

MLR statistics

# ./mwtm mlrstats [node-list [id-tag]] [sort-option] [quiet]

MTP3 accounting statistics

# ./mwtm accstats [node-list [id-tag]] [sort-option] [quiet]

MTP3 event summary

# ./mwtm mtpevents [node-list [id-tag]] [quiet]

Q.752 statistics

./mwtm q752stats [node-list [id-tag]] [quiet]


Note For more information about these commands, see Appendix B, "Command Reference."


(Optional) To include or exclude specific nodes, signaling points or linksets in the report, use the node-list argument. See these sections for more information:

Including Specified Nodes or Signaling Points in Custom Archived Reports

Including Specified Linksets in Custom Archived Reports

Excluding Specified Nodes or Signaling Points from Custom Archived Reports

Excluding Specified Linksets from Custom Archived Reports

(Optional) If you specify a node-list, you can also specify an id-tag to identify the report. The id-tag can be any meaningful character string, but it cannot contain any spaces. The default value for id-tag is the process ID of the mwtm accstats, mwtm gttstats, mwtm linkstats, mwtm mlrstats, mwtm mtpevents, mwtm q752stats, or mwtm xuastats command.

(Optional) To specify a sort order for a report, specify a sort-option. For further information on sort options, see the descriptions of the mwtm accstats, mwtm gttstats, mwtm linkstats, mwtm mlrstats, or mwtm xuastats commands in Appendix B, "Command Reference."

(Optional) To disable automatic output to the terminal when running this command in a script, specify the quiet keyword. The MWTM generates the report in export format, which you can view using the MWTM web interface.

For example, to generate a custom accounting statistics report for links and linksets, that includes only information for node mwtm-2600a.cisco.com, sorted in ascending order based on the node name, and identified by ID tag test1, enter:

# ./mwtm accstats mwtm-2600a.cisco.com test1 -sno

Step 4 (First-time users only) If this is the first time that you use the mwtm accstats, mwtm gttstats, mwtm mlrstats, mwtm mtpevents, mwtm q752stats, or mwtm xuastats command to enable a report, you must enter the command one more time. The:

First entry gets the first set of raw data.

Second entry begins calculating useful accounting statistics and, if the data being collected appears valid, begins generating the report.

Thereafter, you need only enter this command once to enable the report.

Step 5 (First-time users only) If this is the first time that you use the mwtm linkstats command to enable a report, you must enter the command two more times. The:

First entry gets the first set of raw data.

Second entry begins calculating useful link and linkset statistics.

Third entry continues to calculate statistics, calculates long-term averages, and, if the data being collected appears to be valid, begins generating the report.

Thereafter, you need only enter this command once to enable the report.

Step 6 The MWTM generates the custom statistics report and stores it in the /custom directory, identified by its ID tag.

For example, if you entered the command:

# ./mwtm accstats mwtm-2600a.cisco.com test1 -sno

The MWTM generates these reports:

mwtmAccStats.custom.test1.2004-02-13:15.csv.zip

If you installed the MWTM in the default directory, /opt, then the /custom directory resides at /opt/CSCOsgm/reports/custom.

If you installed the MWTM in a different directory, or if you moved the report files directory using the mwtm repdir command, then the /custom directory resides in that directory.

Step 7 You can view custom reports on the MWTM Web interface under Reports > Archive > Custom.


Including and Excluding Specified Objects in Custom Archived Reports

When you enable a custom archived report, you can limit the report to one or more specific objects, or you can exclude one or more specific objects:

Including Specified Nodes or Signaling Points in Custom Archived Reports

Including Specified Linksets in Custom Archived Reports

Excluding Specified Nodes or Signaling Points from Custom Archived Reports

Excluding Specified Linksets from Custom Archived Reports

Including Specified Nodes or Signaling Points in Custom Archived Reports

When you enable a custom archived report, you can limit the report to one or more specific objects:

To enable a report that includes all nodes that the MWTM detected, specify all in place of the node-list argument in the mwtm accstats, mwtm gttstats, mwtm linkstats, mwtm mlrstats, mwtm mtpevents, mwtm q752stats, or mwtm xuastats command; for example, this command enables an accounting statistics report for all nodes:

./mwtm accstats all

To enable a report for a single node, specify the node name in place of the node-list argument in the mwtm accstats, mwtm gttstats, mwtm linkstats, mwtm mlrstats, mwtm mtpevents, mwtm q752stats, or mwtm xuastats command. The node name must match exactly the node name as discovered by the MWTM, including the domain name; for example, this command enables an accounting statistics report for node mwtm-2600a.cisco.com:

./mwtm accstats mwtm-2600a.cisco.com

To enable a report that includes only the nodes and signaling points listed in the user-defined nodes.include file, create the file, then specify default in place of the node-list argument in the mwtm accstats, mwtm gttstats, mwtm linkstats, mwtm mlrstats, mwtm mtpevents, mwtm q752stats, or mwtm xuastats command. This is also the default setting for this command, if you do not specify a node-list keyword.

For example, this command enables an accounting statistics report that includes only the nodes and signaling points specified in the nodes.include file:

./mwtm accstats default

To enable a report that includes only a group of nodes or signaling points other than the nodes and signaling points listed in the nodes.include file, create a file that contains the list of nodes and signaling points to be included and specify the full path and name of the file in place of the node-list argument in the mwtm accstats, mwtm gttstats, mwtm linkstats, mwtm mlrstats, mwtm mtpevents, mwtm q752stats, or mwtm xuastats command.

For example, this command enables an accounting statistics report that includes only the nodes and signaling points specified in /tmp/mynodes file:

./mwtm accstats /tmp/mynodes


Note For more information on creating the nodes.include file, see Including or Excluding Specified Objects in ITP Reports.


Including Specified Linksets in Custom Archived Reports

When you enable a custom archived report, you can limit the report to one or more specific linksets.

To enable a report that includes only the linksets listed in the user-defined linksets.include file, create the file, then specify default in place of the node-list argument in the mwtm accstats, mwtm gttstats, mwtm linkstats, mwtm mlrstats, mwtm mtpevents, mwtm q752stats, or mwtm xuastats command.

For example, this command enables an accounting statistics report that includes only the linksets specified in the linksets.include file:

./mwtm accstats default


Note For more information on creating the linksets.include file, see Including or Excluding Specified Objects in ITP Reports.


Excluding Specified Nodes or Signaling Points from Custom Archived Reports

When you enable a custom archived report, you can exclude one or more specific nodes or signaling points from the report.

To enable a report that excludes the nodes and signaling points listed in the user-defined nodes.exclude file, create the file, then specify default in place of the node-list argument in the mwtm accstats, mwtm gttstats, mwtm linkstats, mwtm mlrstats, mwtm mtpevents, mwtm q752stats, or mwtm xuastats command.

For example, this command enables an accounting statistics report that excludes the nodes and signaling points specified in the nodes.exclude file:

./mwtm accstats default


Note For more information on creating the nodes.exclude file, see Including or Excluding Specified Objects in ITP Reports.


Excluding Specified Linksets from Custom Archived Reports

When you enable a custom archived report, you can exclude one or more specific linksets from the report.

To enable a report that excludes the linksets listed in the user-defined linksets.exclude file, create the file, then specify default in place of the node-list argument in the mwtm accstats, mwtm gttstats, mwtm linkstats, mwtm mlrstats, mwtm mtpevents, mwtm q752stats, or mwtm xuastats command.

For example, this command enables an accounting statistics report that excludes the linksets specified in the linksets.exclude file:

./mwtm accstats default


Note For more information on creating the linksets.exclude file, see Including or Excluding Specified Objects in ITP Reports.


Understanding Custom Archived Reports

The Custom Archived Report pages show all archived MWTM custom network and accounting statistics reports for the server to which you connect. These reports can be viewed on the Web, or downloaded as .zip files. These .zip files are also stored in the default directory (/opt/CSCOsgm by default) within the /reports/custom directory.


Note Custom (and hourly) Q.752 reports are only available as .zip files.


Custom archived reports are those that you enable by using the mwtm accstats, mwtm gttstats, mwtm linkstats, mwtm mlrstats, mwtm mtpevents, mwtm q752stats, and mwtm xuastats commands.

The Custom Report tables are sorted based on the information in the Export File column. However, you can sort a table based on the information in one of the other columns (see Navigating Table Columns, page 5-23).

The Custom Report tables contain:

Column
Description

Export File

Name of the custom statistics export .zip file, archived by type, date, and hour; for example, the sgmLinksetStats.custom.20867.2007-02-13-16:15.csv.zip file contains the summary report of custom linkset statistics with the ID tag 20867 for the 15th minute of the 16th hour on February 13, 2007.

Each archived .zip file contains a comma-separated value (CSV) text file with a daily statistics report for that date. You can download the .zip files and extract them.

To download a .zip file, click a filename, then save the file to a location of your choice. You can also import the file directly into Microsoft Excel.

For more information about the format of custom statistics archived reports, see GTT Accounting Statistics Daily Format, page I-5.

Report Start Date (EST)

Date and time the custom report began.

Report Finish Date (EST)

Date and time the custom report ended.

Last Modified Date (EST)

Date and time the custom report was last modified.

View

Shows the custom detail report for the object. Not available for Q.752 reports.


To show details in HTML for custom archived reports, within the View column of the Custom Archived Report page, click one of the following links:


All custom detail reports contain these headings and general menu options:

Heading/ Menu Option
Description

Date and Hour
(in heading)

Date and hour of the report.

Offset
(in heading)

Shows the number of rows in the table, prior to the first visible row; for example, if the first visible row is 501, the Offset is 500.

Number and Sort Order
(in heading)

Shows the number of records (rows) in the table, the column by which the table is sorted, and whether the sort is in ascending or descending order.

10/Page

Shows 10 rows in the table.

20/Page

Shows 20 rows in the table.

50/Page

Shows 50 rows in the table.

100/Page

Shows 100 rows in the table.

300/Page

Shows 300 rows in the table.

500/Page

Shows 500 rows in the table.

Max

Shows up to 15,000 rows in the table.

Note Depending on the number of rows, this could take up to 15 minutes.

DefPrefs

Resets the /Page preferences for this web page to the default settings for the MWTM server.

First
(at bottom of table)

Shows the first page of entries for the table.

For example, if the table is sorted by Total Aborted in descending order, clicking this field shows the entries with the highest number of MSUs aborted by MLR.

You cannot click this field if the first page of entries is already visible.

Previous (Rows)
(at bottom of table)

Shows the previous page of entries for the table.

You cannot click this field if the first page of entries is already visible.

Next (Rows)
(at bottom of table)

Shows the next page of entries for the table.

You cannot click this field if the last page of entries is already visible.

Last
(at bottom of table)

Shows the last page of entries for the table.

For example, if the table is sorted by Total Aborted in descending order, clicking this field shows the entries with the lowest number of MSUs aborted by MLR.

You cannot click this field if the last page of entries is already visible.

Total
(at bottom of table)

Shows the total number of entries in the table.


Custom MTP3 Events Detail Reports

The Custom MTP3 Events Detail Reports page shows details for all archived MWTM custom MTP3 event reports for all nodes that the MWTM detected when you enabled the report. You enable Custom event reports by using the mwtm mtpevents command.

Field or Column
Description

ID

Identifier for the custom report, specified when you entered the mwtm mtpevents command. If you did not specify an ID, this field shows the process ID of the command that enabled the report.

Node

Name of the node.

Index

Number in the list shown in the CLI.

MTP3 Event Text

MTP3 event message as seen on the CLI.


Custom GTT Accounting Detail Reports

The Custom GTT Accounting Detail Reports page shows details for all archived MWTM custom GTT accounting reports for all nodes that the MWTM detects when you enabled the report. You enable Custom GTT accounting reports by using the mwtm gttstats command.


Note If you do not enable data collection on the active report, a red status indicator and the words Data Collection Disabled appear next to the report title. Click the Data Collection Disabled link to see which command enables the report.

If a statistics calculation results in an undefined value, such as a number divided by zero (0), or an undefined number, based on the configuration, then MathError appears in the field.


Field or Column
Description

ID

Internal ID, assigned by the MWTM, of the selected daily GTT accounting statistics detail report.

To see the entire detailed report, click the ID. The MWTM shows the GTT Accounting Data Record page for that date in text format. The GTT Accounting Data Record can be useful when the TAC is debugging problems.

Node

Name of the node associated with the Network Name for which data is visible.

Network Name

Network name for which data is visible.

Sig Point

Name of the signaling point associated with the Network Name for which data is visible.

Linkset Name

Name of the linkset associated with the Network Name for which data is visible.

Selector

Name of the selector.

GTA

Global Title Address (GTA) associated with the selector.

To Network Name

For version 4.1 GTT files (corresponding to ITP software release 12.2(20)SW or greater) and 4.2 GTT files (corresponding to ITP software release 12.2(21)SW1 or greater), name of the instance in which the translated point code resides.

For version 3.1 GTT files (corresponding to ITP software releases 12.2(4)MB9 and 12.2(4)MB9a) and 4.0 GTT files (corresponding to ITP software release 12.2(4)MB10 or greater), the value of this field is identical to that of the Network Name field.

PC

Destination point code for the GTA.

Pkts

Total number of packets translated by GTT on the specified date.

Octets

Total number of octets translated by GTT on the specified date.


Custom MLR Statistics Detail Reports

Using the MWTM, you can view the following custom MLR statistics detail reports:

Custom MLR Abort and Continues Detail Reports

Custom MLR Processed Detail Reports

Custom MLR Result Invokes Detail Reports

Custom MLR Rule Matches Detail Reports

Custom MLR Subtriggers Detail Reports

Custom MLR Triggers Detail Reports

Custom MLR Abort and Continues Detail Reports

The Custom MLR Abort and Continues Detail Reports page shows details for all archived MWTM custom MLR abort and continues reports for all nodes that the MWTM detects when you enabled the report. You enable Custom MLR abort and continues reports by using the mwtm mlrstats command.


Note If you do not enable data collection on the active report, a red status indicator and the words Data Collection Disabled appear next to the report title. Click the Data Collection Disabled link to see which command enables the report.

If a statistics calculation results in an undefined value, such as a number divided by zero (0), or an undefined number, based on the configuration, then MathError appears in the field.


The Custom MLR Abort Detail Reports table contains:

Field or Column
Description

ID

Internal ID, assigned by the MWTM, of the selected daily MLR aborts statistics detail report.

To see the entire detailed report, click the ID. The MWTM shows the MLR Aborts/Continues Data Record page for that date in text format. The MLR Aborts/Continues Data Record can be useful when the TAC is debugging problems.

Node

Name of the node associated with the Network Name for which data is visible.

Network Name

Network name for which data is visible.

Sig Point

Name of the signaling point associated with the Network Name for which data is visible.

Total Aborted

Total number of MSUs aborted by MLR, and the MSU abort rate in packets per second.

No Resources

Number of MSUs aborted by MLR because of a shortage of resources, and the No Resources MSU abort rate in packets per second.

Results Blocked

Number of MSUs aborted by MLR with a result of block, and the Results Blocked MSU abort rate in packets per second.

GTI Mismatches

Number of MSUs aborted by MLR because of mis-matched GTIs, and the GTI Mismatches MSU abort rate in packets per second.

Addr Conv Fails

Number of MSUs aborted by MLR because of a failed GTA address conversion, and the Address Conversion Failures MSU abort rate in packets per second.

Dest Unavails

Number of MSUs aborted by MLR because the destination was unavailable, and the Destination Unavailables MSU abort rate in packets per second.

No Server Aborteds

Number of MSUs aborted by MLR because no server was available, and the No Server Aborteds MSU abort rate in packets per second.


The Custom MLR Continues Detail Reports table contains:

Field or Column
Description

ID

Internal ID, assigned by the MWTM, of the selected daily MLR continues statistics detail report.

To see the entire detailed report, click the ID. The MWTM shows the MLR Aborts/Continues Data Record page for that date in text format. The MLR Aborts/Continues Data Record can be useful when the TAC is debugging problems.

Node

Name of the node associated with the Network Name for which data is visible.

Network Name

Network name for which data is visible.

Sig Point

Name of the signaling point associated with the Network Name for which data is visible.

Total Continued

Total number of MSUs returned to SCCP by MLR with a result of continue, and the MSU return rate in packets per second.

Unsupp Msg Type

Number of MSUs returned to SCCP by MLR because of unsupported message types, and the Unsupported SCCP Msg Types MSU return rate in packets per second.

Unsupp Seg SCCP

Number of MSUs returned to SCCP by MLR because of unsupported segments, and the Unsupported Segmented SCCP Msgs MSU return rate in packets per second.

Unsupp Msgs

Number of MSUs returned to SCCP by MLR because of parse failures, and the Unsupported Messages MSU return rate in packets per second.

Parse Errors

Number of MSUs returned to SCCP by MLR because of parse errors, and the Parse Errors MSU return rate in packets per second.

No Results

Number of MSUs returned to SCCP by MLR with no results, and the No Results MSU return rate in packets per second.

Result Continueds

Number of MSUs returned to SCCP by MLR with a result of continue, and the Result Continueds MSU return rate in packets per second.

No Server Continueds

Number of MSUs returned to SCCP by MLR because no server was available, and the No Server Continueds MSU return rate in packets per second.

Result GTTs

Number of MSUs returned to SCCP by MLR with a result of GTT, and the Result GTTs MSU return rate in packets per second.

Failed Trigs

Number of MSUs returned to SCCP by MLR because of no trigger match, and the Failed Triggers MSU return rate in packets per second.


Custom MLR Processed Detail Reports

The Custom MLR Processed Detail Reports page shows details for all archived MWTM custom MLR processed reports for all nodes that the MWTM detects when you enabled the report. You enable Custom MLR processed reports by using the mwtm mlrstats command.


Note If you do not enable data collection on the active report, a red status indicator and the words Data Collection Disabled appear next to the report title. Click the Data Collection Disabled link to see which command enables the report.

If a statistics calculation results in an undefined value, such as a number divided by zero (0), or an undefined number, based on the configuration, then MathError appears in the field.


Field or Column
Description

ID

Internal ID, assigned by the MWTM, of the selected daily MLR processed statistics detail report.

To see the entire detailed report, click the ID. The MWTM shows the MLR Processed Data Record page for that date in text format. The MLR Processed Data Record can be useful when the TAC is debugging problems.

Node

Name of the node associated with the Network Name for which data is visible.

Network Name

Network name for which data is visible.

Sig Point

Name of the signaling point associated with the Network Name for which data is visible.

Routed

Total number of packets routed by MLR on the specified date.

Total Aborted

Total number of MSUs not processed by MLR because of invalid data or a blocked MSU.

Total Continued

Total number of MSUs passed back to SCCP processing by MLR on the specified date.

MAP SMS-MOs

Number of MSUs of type GSM-MAP SMS-MO processed by MLR on the specified date.

MAP SMS-MTs

Number of MSUs of type GSM-MAP SMS-MT processed by MLR on the specified date.

MAP SRI-SMs

Number of MSUs of type GSM-MAP SRI-SM processed by MLR on the specified date.

MAP AlertScs

Number of MSUs of type GSM-MAP AlertSc processed by MLR on the specified date.

ANSI-41 SMD-PPs

Number of MSUs of type ANSI-41 SMD-PP processed by MLR on the specified date.

ANSI-41 SMS Reqs

Number of MSUs of type ANSI-41 SMSRequest processed by MLR on the specified date.

ANSI-41 SMS Notifys

Number of MSUs of type ANSI-41 SMSNotify processed by MLR on the specified date.

Links: Aborts

Opens the MLR Statistics: Custom Aborts Report page for the node and signaling point in the selected row.

Links: Continues

Opens the MLR Statistics: Custom Continues Report page for the node and signaling point in the selected row.

Links: Triggers

Opens the MLR Statistics: Custom Triggers Report page for the node and signaling point in the selected row.

Links: SubTriggers

Opens the MLR Statistics: Custom SubTriggers Report page for the node and signaling point in the selected row.

Links: RuleMatches

Opens the MLR Statistics: Custom RuleMatches Report page for the node and signaling point in the selected row

Links: ResultInvokes

Opens the MLR Statistics: Custom ResultInvokes Report page for the node and signaling point in the selected row


Custom MLR Result Invokes Detail Reports

The Custom MLR Result Invokes Detail Reports page shows details for all archived MWTM custom MLR result invokes reports for all nodes that the MWTM detects when you enabled the report. You enable Custom MLR result invokes reports by using the mwtm mlrstats command.


Note If you do not enable data collection on the active report, a red status indicator and the words Data Collection Disabled appear next to the report title. Click the Data Collection Disabled link to see which command enables the report.

If a statistics calculation results in an undefined value, such as a number divided by zero (0), or an undefined number, based on the configuration, then MathError appears in the field.


Field or Column
Description

ID

Internal ID, assigned by the MWTM, of the selected daily MLR processed statistics detail report.

To see the entire detailed report, click the ID. The MWTM shows the MLR Result Invokes Stats Data Record page for that date in text format. The MLR Result Invokes Stats Data Record can be useful when the TAC is debugging problems.

Node

Name of the node associated with the Network Name for which data is visible.

Network Name

Network name for which data is visible.

Sig Point

Name of the signaling point associated with the Network Name for which data is visible.

ResultSet

Name of the result set of which this result is a member.

Result Num

Number of this result within the result set.

Invokes

Total number of times this result was invoked.


Custom MLR Rule Matches Detail Reports

The Custom MLR Rule Matches Detail Reports page shows details for all archived MWTM custom MLR rule matches reports for all nodes that the MWTM detects when you enabled the report. You enable Custom MLR rule matches reports by using the mwtm mlrstats command.


Note If you do not enable data collection on the active report, a red status indicator and the words Data Collection Disabled appear next to the report title. Click the Data Collection Disabled link to see which command enables the report.

If a statistics calculation results in an undefined value, such as a number divided by zero (0), or an undefined number, based on the configuration, then MathError appears in the field.


Field or Column
Description

ID

Internal ID, assigned by the MWTM, of the selected daily MLR processed statistics detail report.

To see the entire detailed report, click the ID. The MWTM shows the MLR Rule Matches Stats Data Record page for that date in text format. The MLR Rule Matches Stats Data Record can be useful when the TAC is debugging problems.

Node

Name of the node associated with the Network Name for which data is visible.

Network Name

Network name for which data is visible.

Sig Point

Name of the signaling point associated with the Network Name for which data is visible.

RuleSet

Name of the rule set of which this rule is a member.

Rule Num

Number of this rule within the rule set.

Matches

Total number of times this rule was matched.


Custom MLR Subtriggers Detail Reports

The Custom MLR Subtriggers Detail Reports page shows details for all archived MWTM custom MLR subtrigger reports for all nodes that the MWTM detects when you enabled the report. You enable Custom MLR subtrigger reports by using the mwtm mlrstats command.


Note If you do not enable data collection on the active report, a red status indicator and the words Data Collection Disabled appear next to the report title. Click the Data Collection Disabled link to see which command enables the report.

If a statistics calculation results in an undefined value, such as a number divided by zero (0), or an undefined number, based on the configuration, then MathError appears in the field.


Field or Column
Description

ID

Internal ID, assigned by the MWTM, of the selected daily MLR statistics detail report.

To see the entire detailed report, click the ID. The MWTM shows the MLR SubTrigger Stats Data Record page for that date in text format. The MLR SubTrigger Stats Data Record can be useful when the TAC is debugging problems.

Node

Name of the node associated with the Network Name for which data is visible.

Network Name

Network name for which data is visible.

Sig Point

Name of the signaling point associated with the Network Name for which data is visible.

Trig Index

Index number associated with the trigger.

SubTrig Index

Index number associated with the subtrigger.

Action

Action taken by the subtrigger.

Parameters

Parameters that control the behavior of the subtrigger.

Matches

Number of subtrigger matches with result Action Performed.


Custom MLR Triggers Detail Reports

The Custom MLR Triggers Detail Reports page shows details for all archived MWTM custom MLR trigger reports for all nodes that the MWTM detects when you enabled the report. You enable Custom MLR trigger reports by using the mwtm mlrstats command.


Note If you do not enable data collection on the active report, a red status indicator and the words Data Collection Disabled appear next to the report title. Click the Data Collection Disabled link to see which command enables the report.

If a statistics calculation results in an undefined value, such as a number divided by zero (0), or an undefined number, based on the configuration, then MathError appears in the field.


Field or Column
Description

ID

Internal ID, assigned by the MWTM, of the selected daily MLR statistics detail report.

To see the entire detailed report, click the ID. The MWTM shows the MLR Trigger Stats Data Record page for that date in text format. The MLR Trigger Stats Data Record can be useful when the TAC is debugging problems.

Node

Name of the node associated with the Network Name for which data is visible.

Network Name

Network name for which data is visible.

Sig Point

Name of the signaling point associated with the Network Name for which data is visible.

Trig Index

Index number associated with the trigger.

Action

Action taken by the trigger.

Parameters

Parameters that control the behavior of the trigger.

Prelim Matches

Preliminary count of trigger matches.

Matches

Number of trigger matches with result Action Performed.

Links: SubTriggers

Opens the MLR Statistics: Daily SubTriggers Report page for the signaling point in the selected row.


Custom MTP3 Accounting Detail Reports

The Custom MTP3 Accounting Detail Reports page shows a custom summary of MTP3 accounting statistics for links and linksets in the MWTM. Custom MTP3 accounting reports are enabled using the mwtm accstats command.


Note If you do not enable data collection on the active report, a red status indicator and the words Data Collection Disabled appear next to the report title. Click the Data Collection Disabled link to see which command enables the report.

If a statistics calculation results in an undefined value, such as a number divided by zero (0), or an undefined number, based on the configuration, then MathError appears in the field.


Field or Column
Description

ID

Internal ID, assigned by the MWTM, of the selected hourly accounting statistics report.

To see the entire detailed report, click the ID. The MWTM shows the Accounting Data Record # X for Date for that date and hour, in text format. The Accounting Data Record # X for Date can be useful when the TAC is debugging problems.

Node

Name of the node for the linkset.

Network Name

Name of the network for the linkset.

Sig Point

Name of the signaling point for the linkset.

Linkset

Name of the linkset.

Gateway Screening

Indicates whether the traffic passed or failed the Gateway Screening test at the ITP.

To see only statistics that passed or failed for a specific linkset, select a linkset and click Pass, Fail, or Unroutable.

OPC

Originating point code of the traffic, which is a unique identifier for each set of statistics.

To see only statistics that match a specific OPC for a given linkset, find the linkset and click the point code.

DPC

Destination point code of the traffic.

To see only statistics that match a specific DPC for a given linkset, find the linkset and click the point code.

SI

Service indicator, which indicates the type of SS7 traffic. Valid values include:

0—Signaling Network Management Message (SNM)

1—Maintenance Regular Message (MTN)

2—Maintenance Special Message (MTNS)

3—Signaling Connection Control Part (SCCP)

4—Telephone User Part (TUP)

5—ISDN User Part (ISUP)

6—Data User Part (call and circuit-related messages)

7—Data User Part (facility registration/cancellation messages)

To see only detailed information for a specific type of SI, click the SI type.

Send MSUs

Total number of MTP3 MSUs sent on the specified date.

Receive MSUs

Total number of MTP3 MSUs received on the specified date.

Send Bytes

Total number of bytes sent on the specified date.

Receive Bytes

Total number of bytes received on the specified date.


Custom Application Server Statistics Detail Reports

The Custom Application Server Statistics Detail Reports page shows a custom summary of application server statistics in the MWTM. Custom application server statistics reports are enabled using the mwtm xuastats command.


Note If you do not enable data collection on the active report, a red status indicator and the words Data Collection Disabled appear next to the report title. Click the Data Collection Disabled link to see which command enables the report.

If a statistics calculation results in an undefined value, such as a number divided by zero (0), or an undefined number, based on the configuration, then MathError appears in the field.


Field or Column
Description

ID

Internal ID that the MWTM assigns of the selected summary report of hourly application server statistics.

To see the entire detailed report, click the ID. The MWTM shows the AS Data Record page for that application server, date, and hour, in text format. The AS Data Record can be useful when the TAC is debugging problems.

Node

Name of the node for the application server.

Sig Point

Name of the signaling point for the application server.

AS Name

Name of the application server.

Packets From MTP3

Total number of packets received by the application server, sent from the MTP3 layer for the specified date and hour.

Packets To ASPs

Total number of packets sent to the application server processes by the application server for the specified date and hour.


Custom Application Server Process Statistics Detail Reports

The Custom Application Server Process Statistics Detail Reports page shows a custom summary of application server process statistics in the MWTM. You enable Custom application server process statistics reports by using the mwtm xuastats command.


Note If you do not enable data collection on the active report, a red status indicator and the words Data Collection Disabled appear next to the report title. Click the Data Collection Disabled link to see which command enables the report.

If a statistics calculation results in an undefined value, such as a number divided by zero (0), or an undefined number, based on the configuration, then MathError appears in the field.


Field or Column
Description

ID

Internal ID that the MWTM assigns of a summary report of the selected hourly application server process statistics.

To see the entire detailed report, click the ID. The MWTM shows the ASP Data Record page for that application server process, date, and hour, in text format. The ASP Data Record can be useful when the TAC is debugging problems.

Node

Name of the node for the application server process.

Sig Point

Name of the signaling point for the application server process.

ASP Name

Name of the application server process.

Packets From ASP

Total number of packets received from the application server process for the specified date and hour.

Packets To ASP

Total number of packets sent to the application server process for the specified date and hour.

Packets From MTP3

Total number of packets received by the application server process, sent from the MTP3 layer for the specified date and hour.

Packets To MTP3

Total number of packets sent to the MTP3 layer by the application server process for the specified date and hour.

Send Errors

Total number of errors that occurred when sending packets to the application server processes and to the MTP3 layer for the specified date and hour.

Receive Errors

Total number of errors that occurred when receiving packets from the application server processes and from the MTP3 layer for the specified date and hour.


Custom Link Statistics Detail Reports

The Custom Link Statistics Detail Reports page shows a custom summary of link statistics in the MWTM. Custom link statistics reports are enabled using the mwtm linkstats command.


Note If you do not enable data collection on the active report, a red status indicator and the words Data Collection Disabled appear next to the report title. Click the Data Collection Disabled link to see which command enables the report.

If a statistics calculation results in an undefined value, such as a number divided by zero (0), or an undefined number, based on the configuration, then MathError appears in the field.


Field or Column
Description

ID

Internal ID that the MWTM assigns of the summary report of selected hourly link statistics.

To see the entire detailed report, click the ID. The MWTM shows the Link Data Record page for that link, date, and hour, in text format. The Link Data Record can be useful when the TAC is debugging problems.

Node

Name of the node for the link.

Network Name

Name of the network for the link.

Sig Point

Name of the signaling point for the link.

Link Name

Name of the link.

Type

Type of link. Possible link types are:

HSL—The link uses the SS7-over-ATM (Asynchronous Transfer Mode) high-speed protocol.

SCTP—The link uses the Stream Control Transmission Protocol (SCTP) IP transport protocol.

Serial—The link uses the serial SS7 signaling protocol.

Virtual—The link is a virtual link, which connects signaling point instances running on the same node. The MWTM does not poll virtual links, nor does it display real-time data or accounting statistics for virtual links.

Send Utilization
or
Send Erlangs

Average Send Utilization for the link, expressed as a utilization percentage or number of Erlangs (E) (as set with the mwtm webutil command) for the specified date and hour.

If you do not set the planned send capacity for the SCTP link, then NoCap appears in the field.

Long Term Send Utilization
or
Long Term Send Erlangs

Long-term average Send Utilization for the link, expressed as a utilization percentage or number of Erlangs (E) (as set with the mwtm webutil command), since MWTM polling began for the link, or since the MWTM last reset the averages as a result of bad data.

If you do not set the planned send capacity for the SCTP link, this field shows NoCap.

Receive Utilization
or
Receive Erlangs

Average Receive Utilization for the link, expressed as a utilization percentage or number of Erlangs (E) (as set with the mwtm webutil command) for the specified date and hour.

If you do not set the planned receive capacity for the SCTP link, this field shows NoCap.

Long Term Receive Utilization
or
Long Term Receive Erlangs

Long-term average Receive Utilization for the link, expressed as a utilization percentage or number of Erlangs (E) (as set with the mwtm webutil command), since MWTM polling began for the link, or since the MWTM last reset the averages as a result of bad data.

If you do not set the planned receive capacity for the SCTP link, then NoCap appears in the field.

Send MSUs

Total number of MTP3 MSUs sent on the specified date and hour.

Receive MSUs

Total number of MTP3 MSUs received on the specified date and hour.

Congestion %

Total percentage of congestion on the specified date and hour.

Hourly In-Service

Percentage of time the link was in service on the specified date and hour.

Long Term In-Service

Average percentage of time the link was in service since MWTM polling began for the link, or since the MWTM last reset the averages as a result of bad data.


Custom Linkset Statistics Detail Reports

The Custom Linkset Statistics Detail Reports page shows a custom summary of linkset statistics in the MWTM. Custom linkset statistics reports are enabled using the mwtm linkstats command.


Note If you do not enable data collection on the active report, a red status indicator and the words Data Collection Disabled appear next to the report title. Click the Data Collection Disabled link to see which command enables the report.

If a statistics calculation results in an undefined value, such as a number divided by zero (0), or an undefined number, based on the configuration, then MathError appears in the field.


Field or Column
Description

ID

Internal ID that the MWTM assigns of the summary report of selected hourly linkset statistics.

To see the entire detailed report, click the ID. The MWTM shows the Linkset Data Record page for that linkset, date, and hour, in text format. The Linkset Data Record can be useful when the TAC is debugging problems.

Node

Name of the node for the linkset.

Network Name

Name of the network for the linkset.

Sig Point

Name of the signaling point for the linkset.

Linkset Name

Name of the linkset.

Hourly In-Service

Percentage of time the linkset was in service on the specified date and hour.

Long Term In-Service

Average percentage of time the linkset was in service since MWTM polling began for the linkset, or since the MWTM last reset the averages as a result of bad data.

Send Utilization
or
Send Erlangs

Average Send Utilization for the linkset, expressed as a utilization percentage or number of Erlangs (E) (as set with the mwtm webutil command) for the specified date and hour.

If you do not set the planned send capacity for the linkset, then NoCap appears in the field.

Long Term Send Utilization
or
Long Term Send Erlangs

Long-term average Send Utilization for the linkset, expressed as a utilization percentage or number of Erlangs (E) (as set with the mwtm webutil command), since MWTM polling began for the linkset, or since the MWTM last reset the averages as a result of bad data.

If you do not set the planned send capacity for the linkset, then NoCap appears in the field.

Receive Utilization
or
Receive Erlangs

Average Receive Utilization for the linkset, expressed as a utilization percentage or number of Erlangs (E) (as set with the mwtm webutil command) for the specified date and hour.

If you do not set the planned receive capacity for the linkset, then NoCap appears in the field.

Long Term Receive Utilization
or
Long Term Receive Erlangs

Long-term average Receive Utilization for the linkset, expressed as a utilization percentage or number of Erlangs (E) (as set with the mwtm webutil command), since MWTM polling began for the linkset, or since the MWTM last reset the averages as a result of bad data.

If you do not set the planned receive capacity for the linkset, then NoCap appears in the field.


Understanding Network Statistics Archived Reports

This section contains:

Hourly Network Statistics Archived Reports

Daily Network Statistics Archived Reports

Rolling Network Statistics Archived Reports

Hourly Network Statistics Archived Reports

The Hourly Archived Reports pages show summary reports for all archived MWTM hourly network statistics for all of the following that the MWTM detects for the server to which you connect:

Application servers

Application server processes

Links

Linksets

Q752 links

The summary reports of archived hourly network statistics are stored as downloadable .zip files. The .zip files are archived by type, date, and hour; for example, the sgmLinksetStats.2007-02-13-08.csv.zip file contains summary reports for the hourly linkset statistics for the eighth hour on February 13, 2007.

Each archived .zip file contains a comma-separated value (CSV) text file with a summary report of hourly network statistics for all application servers, application server processes, links, or linksets that the MWTM detects on that date and hour. You can download the .zip files and extract them.

To download a .zip file, click a filename, then save the file to a location of your choice. You can also import the file directly into Microsoft Excel.

See Appendix I, "Archived Reports File Formats" for more information about the format of hourly network statistics archived reports.

Daily Network Statistics Archived Reports

The Daily Archived Reports pages display summary reports for all archived MWTM daily network statistics for all application servers, application server processes, links, linksets, MLR, or point codes that the MWTM detects for the server to which you connect, stored as downloadable .zip files.

The .zip files are archived by type and hour; for example, the sgmLinksetStats.DailySum.2007-02-13.csv.zip file contains the summary report of daily linkset statistics for the February 13, 2007.

Each archived .zip file contains a comma-separated value (CSV) text file with a summary report of daily network statistics for all application servers, application server processes, links, linksets, MLR, or point codes that the MWTM detected on that date and hour. You can download the .zip files and extract them.

To download a .zip file, click a filename, then save the file to a location of your choice. You can also import the file directly into Microsoft Excel.

See Appendix I, "Archived Reports File Formats" for more information about the format of daily network statistics archived reports.

Rolling Network Statistics Archived Reports

The All Rolling Reports page shows summary reports of concatenated MWTM hourly and daily network statistics for all of the following objects detected by the MWTM for the server you are connected to:

Application servers

Application server processes

Links

Linksets

These statistics are stored as downloadable .zip files. The .zip files are archived by type and number of days (7 or 30). For example:

The sgmLinkStats.RollingSevenDayAllHours.csv.zip file contains summary reports of the hourly link statistics for the last seven (7) days, concatenated into one comma-separated value (CSV) text file.

The sgmLinkStats.Rolling30DayAllDays.csv.zip file contains summary reports of the daily link statistics for the last 30 days, concatenated into one comma-separated value (CSV) text file.


Note To limit the maximum number of rows in export CSV files (for example, Excel can only handle 65,535 rows) see mwtm statreps maxcsvrows, page B-111.


The MWTM creates a new set of files every hour.

You can download the .zip files and extract them. To download a .zip file, click a filename, then save the file to a location of your choice. You can also import the file directly into Microsoft Excel.

For more information about the format of rolling statistics archived reports, see Rolling Network Reports File Formats, page I-18.

Viewing the MWTM Statistics Reports Logs

You can view a log that contains all messages pertaining to MWTM ITP reports, and a display of the current values of MWTM report parameters and timers.

This section contains this information:

Viewing the MWTM Report Log

Viewing the MWTM Report Parameters and Timers

Viewing the MWTM Report Log

For details on viewing the MWTM report log, see Viewing the Report Log, page 11-22.

Viewing the MWTM Report Parameters and Timers

The Report Parameters and Timers page shows the current values of report parameters and timers for the server to which you connect, and which is currently running the MWTM server.

To access the Report Parameters and Timers page:


Step 1 Choose Reports from the MWTM web navigation tree.

Step 2 Click Report Parameters and Timers.


Column
Description

Report Dir

Path and name of the directory in which the MWTM stores reports. The default reports directory is /opt/CSCOsgm/reports, but you can change the reports directory using the mwtm repdir command (see mwtm repdir, page B-100).

Status

Indicates whether the MWTM should generate network statistics reports. For more information, see the description of the mwtm statreps [disable enable] command in mwtm statreps servratio, page B-114.

ExportReports

Indicates whether the MWTM should generate network statistics reports in export format. For more information, see the description of the mwtm statreps [export noexport] command in mwtm statreps export, page B-108.

LinkReports

Indicates whether the MWTM should generate summary reports of link and linkset statistics. For more information, see the description of the mwtm statreps [link nolink] command in mwtm statreps link, page B-110.

AcctReports

Indicates whether the MWTM should generate MTP3 accounting statistics reports. For more information, see the description of the mwtm statreps [acct noacct] command in mwtm statreps acct, page B-105.

GTTReports

Indicates whether the MWTM should generate GTT accounting statistics reports. For more information, see the description of the mwtm statreps [gtt nogtt] command in mwtm statreps gtt, page B-109.

MLRReports

Indicates whether the MWTM should generate MLR statistics reports. For more information, see the description of the mwtm statreps [mlr nomlr] command in mwtm statreps mlr, page B-111.

XUAReports

Indicates whether the MWTM should generate accounting statistics reports for application servers and application server processes. For more information, see the description of the mwtm statreps [xua noxua] command in mwtm statreps xua, page B-116.

MSUReports

Indicates whether the MWTM should generate MSU rates reports. For more information, see the description of the mwtm statreps [msu | nomsu] command in mwtm statreps msu, page B-112.

IPLinks

Indicates whether the MWTM should include links that use the Stream Control Transmission Protocol (SCTP) IP transport protocol in network statistics reports. For more information, see the description of the mwtm statreps [iplinks noiplinks] command in mwtm statreps iplinks, page B-110.

Q752Reports

Indicates whether the MWTM should generate Q.752 reports. For more information, see the description of the mwtm statreps [q752 | noq752] command in mwtm statreps q752, page B-113.

NullCaps

Indicates whether the MWTM should include SCTP links that do not have planned send and receive capacities in network statistics reports. For more information, see the description of the mwtm statreps [nullcaps nonullcaps] command in mwtm statreps nullcaps, page B-113.

TimeMode

Indicates the time mode for dates in network statistics reports. For more information, see the description of the mwtm statreps timemode [12 24] command in mwtm statreps timemode, page B-115.

DiskCheck

Indicates whether the MWTM should verify that a disk has at least 10 MB of space remaining before enabling network statistics reports. For more information, see the description of the mwtm statreps [diskcheck nodiskcheck] command in mwtm statreps diskcheck, page B-107.

UtilRatio

Utilization values that are outside a normal range are indicated with a red status ball icon within the Send Utilization or Receive Utilization cell. A Utilization value is outside the normal range if the following condition is met:

Current Utilization > factor * Long-Term Utilization

This inequality is used to recognize increases in the Utilization value. Assuming the default factor of 1.5, the Current Utilization value must be less than or equal to 150% of the Long-Term Utilization value to be within the normal range.

The default value for factor is 1.5.

For more information, see the description of the mwtm statreps utilratio command in mwtm statreps utilratio, page B-116.

ServRatio

In-Service values that are outside a normal range are indicated with a red status ball icon in the In-Service cell. An In-Service value is outside the normal range if the following condition is met:

Current In-Service < factor * Long-Term In-Service

This inequality is used to recognize drops in the In-Service value. Assuming the default factor of 0.95, the Current In-Service value must be greater than or equal to 95% of the Long-Term In-Service value to be within the normal range.

For more information, see the description of the mwtm statreps servratio command in mwtm statreps servratio, page B-114.

Hourly Age

Indicates the maximum number of days the MWTM should archive hourly network statistics reports. For more information, see the description of the mwtm statreps hourlyage and mwtm rephourlyage commands in mwtm statreps servratio, page B-114.

Daily Age

Indicates the maximum number of days the MWTM should archive daily network statistics reports. For more information, see the description of the mwtm statreps dailyage and mwtm repdailyage commands in mwtm statreps dailyage, page B-107.

Custom Age

Indicates the maximum number of days the MWTM should archive custom network statistics reports. For more information, see the description of the mwtm statreps custage and mwtm repcustage commands in mwtm statreps custage, page B-106.

Max CSV Rows

Indicates the maximum number of rows the MWTM should include in export CSV files. For more information, see the description of the mwtm statreps maxcsvrows command in mwtm statreps maxcsvrows, page B-111.

Web Names

Indicates whether the MWTM should show real node names or display names in web pages. For more information, see the description of the mwtm webnames [display real] command in the "mwtm webnames" section on page B-71.

Web Util

Indicates whether the MWTM should display send and receive utilization for linksets and links as percentages or in Erlangs (E), in web pages. For more information, see the description of the mwtm webutil [percent erlangs] command in mwtm who, page B-72.

Timer files

Indicates timer activities during the last report run by the MWTM. The timer file is useful for identifying how much time the MWTM spends gathering report data and generating reports.