-
Massively Scalable Data Center (MSDC) Design and Implementation Guide
-
MSDC Design Architecture Preface
-
MSDC Reference Design Architecture
-
MSDC Solution Details and Testing Summary
-
Server and Network Specifications
-
Buffer Monitoring Code and Configuration Files
-
F2/Clipper Linecard Architecture
-
Competitive Landscape
-
Incast Utility Scripts, IXIA Config
-
Bandwidth Utilization Noise Floor Traffic Generation
-
 Feedback
Table Of Contents
MSDC Solution Details and Testing Summary
Incast Simulation and Conclusions
MSDC Solution Details and Testing Summary
This chapter discusses Power on Auto Provisioning (PoAP) and fabric protocol scaling.
PoAP
As was discussed earlier, PoAP was used to configure the various logical topologies—one major change for each of 4 cycles (a, b, c, and d) for this phase of testing1 . Setup and testing is documented below.
The Goals of the PoAP testing can be summarized in 4 bullet points, along with a summary of results:
1.
It should be demonstrated that automation of simultaneous initial provisioning of all Leafs, without human intervention, is possible.
•
2.
•
a.
b.
c.
d.
–
–
DHCP related problems (DHCP Offer not received, incorrect options in OFFER, etc)
HTTP/TFTP related problems (couldn't reach server, file not found, etc)
Check DHCP/TFTP/HTTP/FTP/SFTP server logs for additional information
e.
–
–
–
3.
•
a.
–
–
–
–
–
–
–
4.
•
PoAP Benefits
Here are a few benefits provided by PoAP:
•
–
•
–
–
–
•
•
•
Topology Setup
Each method of enabling PoAP, below, has its pros and cons. One of the most important decisions is how any method scales. MGMT0, page 2-3 and Inband, page 2-3 are two possible ways to enable PoAP in the topology.
MGMT0
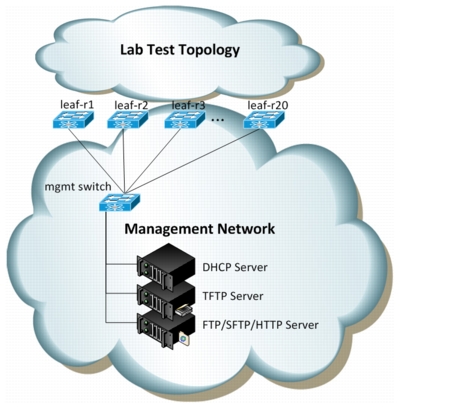
Here is a detailed depiction of how PoAP can be used with the mgmt0 interface of each Spine and Leaf node (Figure 2-1).
Figure 2-1 PoAP Across Dedicated Management Network
Pros
•
•
•
Cons
•
•
If using this setup, the PoAP script uses the management VRF.
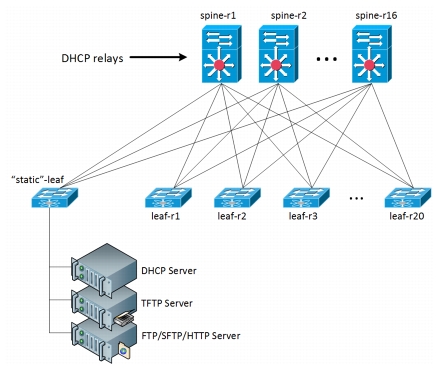
Inband
In this setup, no mgmt network is used, but rather the normal network (Figure 2-2).
Figure 2-2 PoAP Across Inband Network
Pros
•
•
Cons
•
•
•
•
The test topology used this arrangement for PoAP. The Pros for inband are much higher weighted than all the other cons, and it scales much better than a dedicated L2 network. And with software automation the complexity of DHCP server configuration is easily managed.
Infrastructure
PoAP requires supporting services, such as DHCP, TFTP, FTP/SFTP, and HTTP to properly function. These are discussed below.
DHCP Server
PoAP requires DHCP Offer to contain:
1.
2.
3.
4.
5.
6.
7.
8.
If PoAP does not get offer with adequate information, init.log will show:
poap_dhcp_select_interface_config: No interface with required configpoap_dhcp_intf_ac_action_config_interface_select: Failed in the interface selection to send DHCPREQUEST for interface 1a013000isc-dhcpd Configuration
Split config into Subnet and Host portions.
•
–
–
–
•
–
host msdc-leaf-r4 {option dhcp-client-identifier "\000FOC1546R0SL";option host-name "msdc-leaf-r4";}–
–
TFTP/FTP/SFTP/HTTP Server
•
•
–
•
–
–
–
–
•
–
–
–
Demo
The following collection of logfiles demonstrates a successful PoAP event.
•
2012 Jun  4 19:53:22  %$ VDC-1 %$ %NOHMS-2-NOHMS_DIAG_ERR_PS_FAIL: System minor alarm
on power supply 1: failed
Starting Power On Auto Provisioning...2012 Jun 4 19:54:17 %$ VDC-1 %$ %VDC_MGR-2-VDC_ONLINE: vdc 1 has come online2012 Jun 4 19:54:17 switch %$ VDC-1 %$ %POAP-2-POAP_INITED: POAP process initializedDoneAbort Power On Auto Provisioning and continue with normal setup ?(yes/no)[n]:2012 Jun 4 19:54:37 switch %$ VDC-1 %$ %POAP-2-POAP_DHCP_DISCOVER_START: POAP DHCP Discover phase started2012 Jun 4 19:54:37 switch %$ VDC-1 %$ %POAP-2-POAP_INFO: Abort Power On Auto Provisioning and continue with normal setup ?(yes/no)[n]:•
Jun  4 10:54:19 milliways-cobbler dhcpd: DHCPDISCOVER from 54:7f:ee:34:10:c1 via
10.3.1.32
Jun 4 10:54:19 milliways-cobbler dhcpd: DHCPDISCOVER from 54:7f:ee:34:10:c1 via 10.2.1.32Jun 4 10:54:19 milliways-cobbler dhcpd: DHCPDISCOVER from 54:7f:ee:34:10:c1 via 10.4.1.32Jun 4 10:54:19 milliways-cobbler dhcpd: DHCPDISCOVER from 54:7f:ee:34:10:c1 via 10.1.1.32Jun 4 10:54:20 milliways-cobbler dhcpd: DHCPOFFER on 10.3.1.33 to 54:7f:ee:34:10:c1 via 10.3.1.32Jun 4 10:54:20 milliways-cobbler dhcpd: DHCPOFFER on 10.2.1.33 to 54:7f:ee:34:10:c1 via 10.2.1.32Jun 4 10:54:20 milliways-cobbler dhcpd: DHCPOFFER on 10.4.1.33 to 54:7f:ee:34:10:c1 via 10.4.1.32Jun 4 10:54:20 milliways-cobbler dhcpd: DHCPOFFER on 10.1.1.33 to 54:7f:ee:34:10:c1 via 10.1.1.32Jun 4 10:54:34 milliways-cobbler dhcpd: DHCPREQUEST for 10.3.1.33 (10.128.3.132) from 54:7f:ee:34:10:c1 via 10.3.1.32Jun 4 10:54:34 milliways-cobbler dhcpd: DHCPACK on 10.3.1.33 to 54:7f:ee:34:10:c1 via 10.3.1.322012 Jun 4 19:54:53 switch %$ VDC-1 %$ %POAP-2-POAP_INFO: Using DHCP, information received over Eth1/19 from 10.128.3.1322012 Jun 4 19:54:53 switch %$ VDC-1 %$ %POAP-2-POAP_INFO: Assigned IP address: 10.3.1.332012 Jun 4 19:54:53 switch %$ VDC-1 %$ %POAP-2-POAP_INFO: Netmask: 255.255.255.2542012 Jun 4 19:54:53 switch %$ VDC-1 %$ %POAP-2-POAP_INFO: DNS Server: 10.128.3.1362012 Jun 4 19:54:53 switch %$ VDC-1 %$ %POAP-2-POAP_INFO: Default Gateway: 10.3.1.322012 Jun 4 19:54:53 switch %$ VDC-1 %$ %POAP-2-POAP_INFO: Script Server: 10.128.3.1322012 Jun 4 19:54:53 switch %$ VDC-1 %$ %POAP-2-POAP_INFO: Script Name: /poap_script.py2012 Jun 4 19:55:04 switch %$ VDC-1 %$ %POAP-2-POAP_INFO: The POAP Script download has started2012 Jun 4 19:55:04 switch %$ VDC-1 %$ %POAP-2-POAP_INFO: The POAP Script is being downloaded from [copy tftp://10.128.3.132//poap_script.py bootflash:script.sh vrf default ]2012 Jun 4 19:55:06 switch %$ VDC-1 %$ %POAP-2-POAP_SCRIPT_DOWNLOADED: Successfully downloaded POAP script file2012 Jun 4 19:55:06 switch %$ VDC-1 %$ %POAP-2-POAP_INFO: Script file size 15738, MD5 checksum b9b180bd70baee9fabb7a253d59e909a2012 Jun 4 19:55:06 switch %$ VDC-1 %$ %POAP-2-POAP_INFO: MD5 checksum received from the script file is b9b180bd70baee9fabb7a253d59e909a2012 Jun 4 19:55:06 switch %$ VDC-1 %$ %POAP-2-POAP_SCRIPT_STARTED_MD5_VALIDATED: POAP script execution started(MD5 validated)$ head -n 1 poap_script.py#md5sum="b9b180bd70baee9fabb7a253d59e909a"Mon Jun 4 10:54:50 2012 1 10.3.1.33 886 /var/lib/tftpboot/conf_FOC1539R06D.cfg b _ o r administrator ftp 0 * cMon Jun 4 10:54:51 2012 1 10.3.1.33 0 /var/lib/tftpboot/conf_FOC1539R06D.cfg.md5 b _ o r administrator ftp 0 * iMon Jun 4 10:54:53 2012 1 10.3.1.33 3060 /var/lib/tftpboot/conf_mgmt_milliways.cfg b _ o r administrator ftp 0 * cMon Jun 4 10:54:55 2012 1 10.3.1.33 0 /var/lib/tftpboot/conf_mgmt_milliways.cfg.md5 b _ o r administrator ftp 0 * iMon Jun 4 10:54:56 2012 1 10.3.1.33 632 /var/lib/tftpboot/conf_proto_ospf.cfg b _ o r administrator ftp 0 * cMon Jun 4 10:54:58 2012 1 10.3.1.33 0 /var/lib/tftpboot/conf_proto_ospf.cfg.md5 b _ o r administrator ftp 0 * i2012 Jun 4 19:55:27 switch %$ VDC-1 %$ %POAP-2-POAP_SCRIPT_EXEC_SUCCESS: POAP script execution success2012 Jun 4 19:55:30 switch %$ VDC-1 %$ %PFMA-2-PFM_SYSTEM_RESET: Manual system restart from Command Line Interfacewriting reset reason 9,· leaf-r1. After second reboot, the remainder of the cofiguration is applied:POAP - Applying scheduled configuration...2012 Jun 4 19:58:36 %$ VDC-1 %$ %VDC_MGR-2-VDC_ONLINE: vdc 1 has come onlineWarning: URPF successfully disabledWarning: Please copy running-config to startup-config and reload the switch to apply changes[########################################] 100%DoneWARNING: This command will reboot the system2012 Jun 4 19:58:54 switch %$ VDC-1 %$ %PFMA-2-PFM_SYSTEM_RESET: Manual system restart from Command Line Interfacewriting reset reason 9,POAP - Applying scheduled configuration...2012 Jun 4 20:02:01 switch %$ VDC-1 %$ %VDC_MGR-2-VDC_ONLINE: vdc 1 has come onlinePlease disable the ICMP redirects on all interfacesrunning BFD sessions using the command below'no ip redirects '% Warning - the verbose event-history buffer may result in a slow down of OSPF[########################################] 100%Done2012 Jun 4 16:02:36 msdc-leaf-rmsdc-leaf-r1 login:PoAP Considerations
The following PoAP considerations are recommended.
•
–
–
–
•
–
–
•
–
–
•
Fabric Protocol Scaling
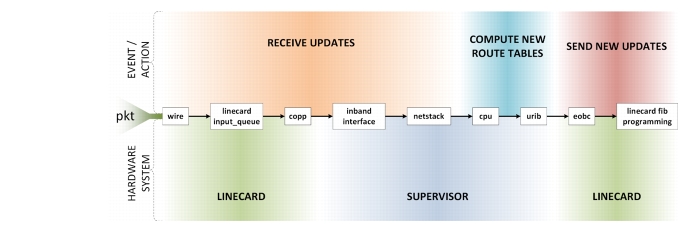
This section discusses ways to tell if a MSDC is approaching meltdown. Refer to the "Scale" section on page 1-31 for designing MSDC networks to mitigate issues with churn. Figure 2-3 through Figure 2-11 shows and defines the routing and processing subsystems of a packets journey.
Churn
Figure 2-3 is used to describe the day in the life of a packet and how it relates to various routing events and actions.
Figure 2-3 Day in the Life of a Packet Through Routing and Processing Subsystems
Several terms are used to describe a routing protocol failure; meltdown, cascading failures, etc. The underlying problem in each of these is the network reaches the point where the protocol can no longer keep up. It is so far backed up and sending updates that it becomes the cause of problems instead of routing packets around problems. From an application point of view, this manifests as communication failures between endpoints. But how can one tell from the router point of view that this is occurring? Every routing protocol does three basic things; receive updates, compute new route tables based on these updates, and send out new updates. The most obvious item to check is CPU utilization. If CPU is pegged at 100% computing new route tables, then the limit has obviously been reached. There are, however, other potential breakpoints from when new updates are taken off the wire, to when those updates are processed by the routing protocol, to when new RIB and FIB and generated and pushed to hardware, to when new updates are sent out.
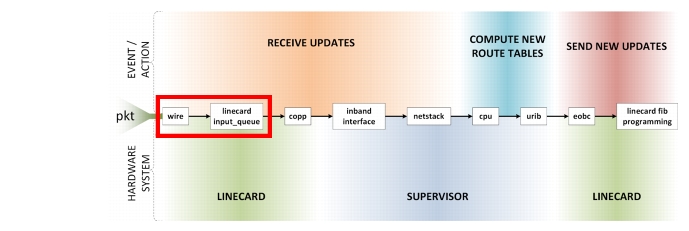
Line Card Input Queues
The first place a packet goes when it comes off the wire is the port's input queue. The architecture of each linecard and platform is different, so the specifics won't be covered here.4
Figure 2-4 Line Card Input Queues
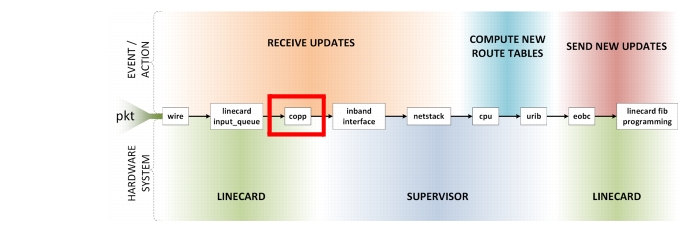
CoPP
Control Plane Policing (CoPP) protects the supervisor from becoming overwhelmed by DDOS type attacks using hardware rate-limiters. The CoPP configuration is user customizable. The default N7k CoPP policy puts all routing protocol packets into the copp-system-p-class-critical class. By default this class is given the strict policy of 1 rate and 2 color and has a BC value of 250ms. The default N3k CoPP policy divides the routing protocol packets into several classes based on each protocol. Should the routing protocol exceed configured rates, packets will be dropped. Dropped Hello's can lead to entire neighbor session being dropped. Dropped updates/LSAs can lead to increased load due to retransmissions or inconsistent routing state.
Figure 2-5 CoPP Path
CoPP Commands
On the N7k the show policy-map interface control-plane class copp-system-p-class-critical command displays counters for default CoPP class regulating routing protocol traffic. A violated counter that is continuously incrementing indicates network churn rate is approaching meltdown.
msdc-spine-r9# show pol int cont class copp-system-p-class-critical | begin modmodule 3 :conformed 14022805664 bytes; action: transmitviolated 0 bytes; action: dropmodule 4 :conformed 8705316310 bytes; action: transmitviolated 0 bytes; action: dropOn the N3k, the show policy-map interface control-plane command displays counters for all CoPP classes. A routing protocol class DropPackets counter that is continuously incrementing indicates the network churn rate is approaching meltdown.
msdc-leaf-r21# show policy-map interface control-plane | begin copp-s-igmpclass-map copp-s-igmp (match-any)match access-grp name copp-system-acl-igmppolice pps 400OutPackets 0DropPackets 0class-map copp-s-eigrp (match-any)match access-grp name copp-system-acl-eigrpmatch access-grp name copp-system-acl-eigrp6police pps 200OutPackets 0DropPackets 0class-map copp-s-pimreg (match-any)match access-grp name copp-system-acl-pimregpolice pps 200OutPackets 0DropPackets 0class-map copp-s-pimautorp (match-any)police pps 200OutPackets 0DropPackets 0class-map copp-s-routingProto2 (match-any)match access-grp name copp-system-acl-routingproto2police pps 1300OutPackets 0DropPackets 0class-map copp-s-v6routingProto2 (match-any)match access-grp name copp-system-acl-v6routingProto2police pps 1300OutPackets 0DropPackets 0class-map copp-s-routingProto1 (match-any)match access-grp name copp-system-acl-routingproto1match access-grp name copp-system-acl-v6routingproto1police pps 1000OutPackets 1208350DropPackets 0class-map copp-s-arp (match-any)police pps 200OutPackets 9619DropPackets 0class-map copp-s-ptp (match-any)police pps 1000OutPackets 0DropPackets 0class-map copp-s-bfd (match-any)police pps 350OutPackets 24226457DropPackets 0<snip>Supervisor Inband Interface
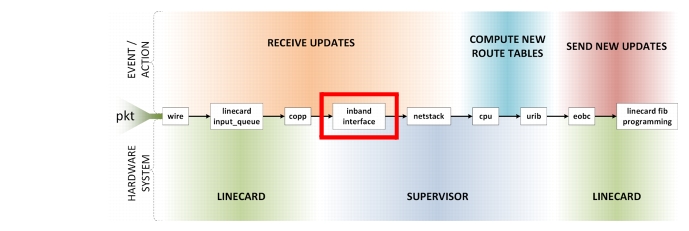
After making it through CoPP, control plane packets are sent to the supervisor via its inband interface. As the level of network churn increases, it is expected the number of Updates/LSAs sent and received by the device should also increase. A corresponding increase is seen in RX and TX utilization on the inband interface. Should this interface become overwhelmed, throttling occurs and packets will be dropped. Dropped Hello's may lead to entire neighbor sessions being dropped. Dropped updates/LSAs may also lead to increased load due to retransmissions or inconsistent routing state.
Figure 2-6 Inband Interface Path
Supervisor Inband Interface Commands
On the N7k, the inband rate limit for Sup1 is 32kpps, while the limit for Sup2 is 64kpps. The show hardware internal cpu-mac inband stats command gives a vast array of statics regarding the inband interface, specifically statistics about throttling. Seeing the rate limit reached counter incrementing indicates the network churn rate is approaching meltdown.
msdc-spine-r1# show hard int cpu-mac inband stats | be Throttle | headThrottle statistics-----------------------------+---------Throttle interval ........... 2 * 100msPacket rate limit ........... 32000 ppsRate limit reached counter .. 0Tick counter ................ 2217856Active ...................... 0Rx packet rate (current/max) 261 / 3920 ppsTx packet rate (current/max) 618 / 4253 ppsNetstack
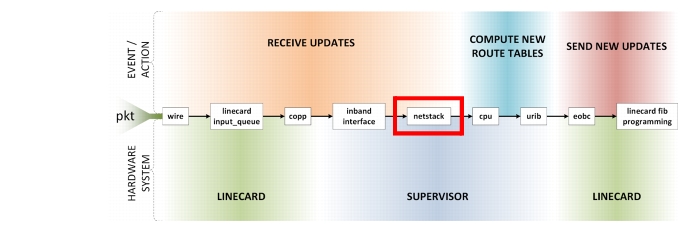
Netstack is the set of NX-OS processes that implement all protocol stacks required to send and receive control plane packets. Routing protocols register with the IP Process to receive their Hello and Update packets. MTS is used to pass these updates between IP Process and routing protocols. When routing protocols are too busy processing previous messages or doing route recalculations to receive these messages, they can be dropped. Dropped Hello's can lead to entire neighbor session being dropped. Dropped updates/LSAs can lead to increased load due retransmissions or inconsistent routing state. Each routing protocol registers as a client of IP process to receive these messages. Statistics are available on a per-client basis.
Figure 2-7 Netstack Path
Netstack Output Commands
The show ip client command lists all the processes that have registered to receive IP packets. Seeing the failed data messages counter incrementing is an indication that the network churn rate is approaching meltdown.
msdc-spine-r9# show ip client ospfClient: ospf-msdc, uuid: 1090519321, pid: 4242, extended pid: 4242Protocol: 89, client-index: 12, routing VRF id: 65535Data MTS-SAP: 324, flags 0x3Data messages, send successful: 737284, failed: 0msdc-spine-r8# show ip client tcpudpClient: tcpudp, uuid: 545, pid: 4416, extended pid: 4416Protocol: 1, client-index: 6, routing VRF id: 65535Data MTS-SAP: 2323, flags 0x1Data messages, send successful: 462, failed: 0Recv fn: tcp_process_ip_data_msg (0x8369da6)Client: tcpudp, uuid: 545, pid: 4416, extended pid: 4416Protocol: 2, client-index: 7, routing VRF id: 65535Data MTS-SAP: 2323, flags 0x1Data messages, send successful: 0, failed: 10Recv fn: tcp_process_ip_data_msg (0x8369da6)Client: tcpudp, uuid: 545, pid: 4416, extended pid: 4416Protocol: 6, client-index: 4, routing VRF id: 65535Data MTS-SAP: 2323, flags 0x1Data messages, send successful: 14305149, failed: 0Recv fn: tcp_process_ip_data_msg (0x8369da6)Client: tcpudp, uuid: 545, pid: 4416, extended pid: 4416Protocol: 17, client-index: 5, routing VRF id: 65535Data MTS-SAP: 2323, flags 0x1Data messages, send successful: 588710, failed: 0Recv fn: tcp_process_ip_data_msg (0x8369da6)Client: tcpudp, uuid: 545, pid: 4416, extended pid: 4416Protocol: 112, client-index: 8, routing VRF id: 65535Data MTS-SAP: 2323, flags 0x1Data messages, send successful: 0, failed: 0Recv fn: tcp_process_ip_data_msg (0x8369da6)CPU Utilization
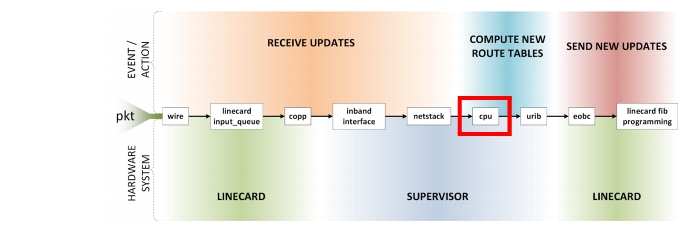
Once the update has reached its final destination, the routing protocol requires compute time on the supervisor to run its SPF or best-path algorithms. As the network converges more frequently, the more load will be put on CPU. However, each platform has a different type of CPU so load will be different on each platform. Also, the location of the device in the network has an impact (routers in an OSPF totally stubby area are insulated from churn in other areas). Thus CPU utilization is one metric to carefully examine, but monitoring all devices is required until it is determined which platform+roles will be high water marks. If the network melts before any devices have pegged the CPU, then one of the other breakpoints are being reached first.
Figure 2-8 CPU Usage
CPU Utilization Commands
The following CPU usage commands were used:
•
•
•
msdc-spine-r1# show proc cpu sort | exc 0.0%PID Runtime(ms) Invoked uSecs 1Sec Process----- ----------- -------- ----- ------ -----------3929 229 87 2641 6.8% netstack4347 4690520 3655116 1283 2.9% statsclient3824 5842819 2004444 2914 2.0% diagmgr4223 9112189 35562230 256 2.0% stp26 507049 1086599 466 0.9% kide/13983 33557935 1148416 29221 0.9% sac_usd4034 5259725 1575385 3338 0.9% oc_usd4218 1484069 4998255 296 0.9% diag_port_lb4235 1991337 1127732 1765 0.9% udldCPU util : 5.0% user, 4.5% kernel, 90.5% idlePlease note that only processes from the requested vdc are shown abovemsdc-spine-r1# show proc cpu hist1 11 226 2 111 211 111 4554 353 2 2 1 3696787708864288269140716978855989375663843527196860868197579100908070 #60 # # #50 # ## #40 # #### #30 # #### ### # #20 # # ### # ### ### #### ### # # # #10 ################################# ##########################0....5....1....1....2....2....3....3....4....4....5....5....0 5 0 5 0 5 0 5 0 5CPU% per second (last 60 seconds)# = average CPU%1 1 11777877697797678967989767785988798980787586978798098788009679166077546715148676827549868699342800060935474641066850000773100 * * * * * * ** **90 * * ** * * * *** * * * * * * *** * *** *80 ***** ***** ** ***** *** *** ***** * * *************** **70 ************ ********* *** ************ ********************60 ************************************************************50 ************************************************************40 **#****#**********#******#*#*****#******#*#*****#*****##***#30 **##*#*##*#***#***#*##***#*###***#*###**#*###***#*#***##**##20 ###############*############################################10 ############################################################0....5....1....1....2....2....3....3....4....4....5....5....0 5 0 5 0 5 0 5 0 5CPU% per minute (last 60 minutes)* = maximum CPU% # = average CPU%111111111111 1111111 111111111111111111111111111111111111111111111111111000000000000900000009000000000000000000000000000000000000000000000000000000000000000900000006000000000000000000000000000000000000000000000000000100 **************************##########################********************90 **************************##########################********************80 **************************###########################*******************70 *************************############################*******************60 *************************############################*******************50 ******#*****************################################################40 ******#****************#################################################30 ###*###*####***********#################################################20 ########################################################################10 ########################################################################0....5....1....1....2....2....3....3....4....4....5....5....6....6....7.0 5 0 5 0 5 0 5 0 5 0 5 0CPU% per hour (last 72 hours)* = maximum CPU% # = average CPU%msdc-spine-r1# show system resources module allCPU Resources:-----------------------------------------------------------CPU utilization: Module 5 seconds 1 minute 5 minutes-----------------------------------------------------------1 25 15 142 21 15 153 26 23 214 14 14 145 21 15 146 11 13 137 11 13 138 11 12 1210 27 18 1911 23 13 1212 17 11 1213 10 13 1214 10 13 1315 11 12 1316 11 12 1217 11 13 13-----------------------------------------------------------Processor memory: Module Total(KB) Free(KB) % Used-----------------------------------------------------------1 2075900 1339944 352 2075900 1340236 353 2075900 1333976 354 2075900 1339780 355 2075900 1341112 356 2075900 1344648 357 2075900 1344492 358 2075900 1344312 3510 8251592 6133856 2511 2075900 1344604 3512 2075900 1344904 3513 2075900 1344496 3514 2075900 1344496 3515 2075900 1344808 3516 2075900 · show process cpu sort•
•
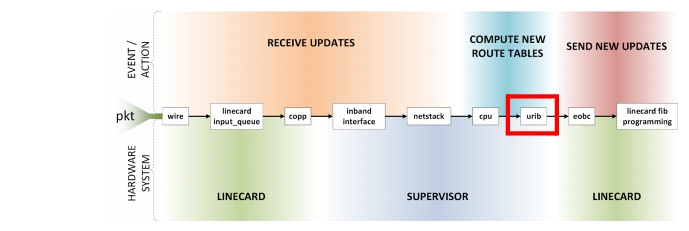
msdc-spine-r1# show proc cpu sort | exc 0.0%PID Runtime(ms) Invoked uSecs 1Sec Process----- ----------- -------- ----- ------ -----------3929 229 87 2641 6.8% netstack4347 4690520 3655116 1283 2.9% statsclient3824 5842819 2004444 2914 2.0% diagmgr4223 9112189 35562230 256 2.0% stp26 507049 1086599 466 0.9% kide/13983 33557935 1148416 29221 0.9% sac_usd4034 5259725 1575385 3338 0.9% oc_usd4218 1484069 4998255 296 0.9% diag_port_lb4235 1991337 1127732 1765 0.9% udldCPU util : 5.0% user, 4.5% kernel, 90.5% idlePlease note that only processes from the requested vdc are shown abovemsdc-spine-r1# show proc cpu hist1 11 226 2 111 211 111 4554 353 2 2 1 3696787708864288269140716978855989375663843527196860868197579100908070 #60 # # #50 # ## #40 # #### #30 # #### ### # #20 # # ### # ### ### #### ### # # # #10 ################################# ##########################0....5....1....1....2....2....3....3....4....4....5....5....0 5 0 5 0 5 0 5 0 5CPU% per second (last 60 seconds)# = average CPU%1 1 11777877697797678967989767785988798980787586978798098788009679166077546715148676827549868699342800060935474641066850000773100 * * * * * * ** **90 * * ** * * * *** * * * * * * *** * *** *80 ***** ***** ** ***** *** *** ***** * * *************** **70 ************ ********* *** ************ ********************60 ************************************************************50 ************************************************************40 **#****#**********#******#*#*****#******#*#*****#*****##***#30 **##*#*##*#***#***#*##***#*###***#*###**#*###***#*#***##**##20 ###############*############################################10 ############################################################0....5....1....1....2....2....3....3....4....4....5....5....0 5 0 5 0 5 0 5 0 5CPU% per minute (last 60 minutes)* = maximum CPU% # = average CPU%111111111111 1111111 111111111111111111111111111111111111111111111111111000000000000900000009000000000000000000000000000000000000000000000000000000000000000900000006000000000000000000000000000000000000000000000000000100 **************************##########################********************90 **************************##########################********************80 **************************###########################*******************70 *************************############################*******************60 *************************############################*******************50 ******#*****************################################################40 ******#****************#################################################30 ###*###*####***********#################################################20 ########################################################################10 ########################################################################0....5....1....1....2....2....3....3....4....4....5....5....6....6....7.0 5 0 5 0 5 0 5 0 5 0 5 0CPU% per hour (last 72 hours)* = maximum CPU% # = average CPU%msdc-spine-r1# show system resources module allCPU Resources:-----------------------------------------------------------CPU utilization: Module 5 seconds 1 minute 5 minutes-----------------------------------------------------------1 25 15 142 21 15 153 26 23 214 14 14 145 21 15 146 11 13 137 11 13 138 11 12 1210 27 18 1911 23 13 1212 17 11 1213 10 13 1214 10 13 1315 11 12 1316 11 12 1217 11 13 13-----------------------------------------------------------Processor memory: Module Total(KB) Free(KB) % Used-----------------------------------------------------------1 2075900 1339944 352 2075900 1340236 353 2075900 1333976 354 2075900 1339780 355 2075900 1341112 356 2075900 1344648 357 2075900 1344492 358 2075900 1344312 3510 8251592 6133856 2511 2075900 1344604 3512 2075900 1344904 3513 2075900 1344496 3514 2075900 1344496 3515 2075900 1344808 3516 2075900 1344416 3517 2075900 1344536 35msdc-spine-r1# 1344416 3517 2075900 1344536 35msdc-spine-r1#URIB
When there is a lot of network instability urib-redist can run out of shared memory waiting for acks caused by routing changes. urib-redist uses 1/8 of the memory allocated to urib, which can be increased by modifying the limit for 'limit-resource u4route-mem' (urib).
This data shows urib-redist with 12292 allocated, which is 1/8 of urib (98308)
n7k# show processes memory sharedComponent Shared Memory Size Used Available RefAddress (kbytes) (kbytes) (kbytes) Countsmm 0X50000000 1028 4 1024 41cli 0X50101000 40964* 25151 15813 12npacl 0X52902000 68 2 66 2u6rib-ufdm 0X52913000 324* 188 136 2u6rib 0X52964000 2048+ (24580) 551 1497 11urib 0X54165000 7168+ (98308) 5161 2007 22u6rib-notify 0X5A166000 3076* 795 2281 11urib-redist 0X5A467000 12292* 11754 538 22urib-ufdm 0X5B068000 2052* 0 2052 2Protocols often express interest in notifications whenenever there is a change in the status of their own routes or routes of others (redistribution). Previously, no flow control in this notification mechanism existed, that is, urib kept sending notifications to protocols without checking whether the protocol was able to process the notifications or not. These notifications use shared memory buffers which may encounter situations where shared memory was exhausted. Part of this feature, urib will now allow only for a fixed number of unacknowledged buffers. Until these buffers are acknowledged additional notifications will not be sent.
Figure 2-9 URIB Path
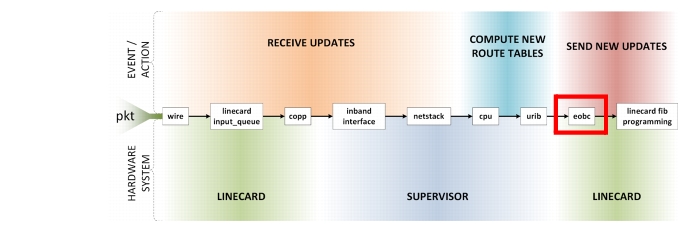
EOBC
Once a new FIB has been generated from the RIB, updates are sent to the forwarding engine on each linecard via the Ethernet Out of Band Channel (EOBC) interface on the supervisor. Many other internal system processes utilize the EOBC as well. As the level of network churn increases, it is expected the number of FIB updates increase. Thus it is expected an increase in RX and TX utilization on the EOBC interface to happen. Should this interface become overwhelmed, throttling will occur and packets will be dropped. This delays programming new entries into the forwarding engine, causing packet misrouting and increased convergence times.
Figure 2-10 EOBC Path
EOBC Commands
On the N7k, the EOBC rate limit for SUP1 is 16kpps, while the limit for SUP2 is significantly higher. The show hardware internal cpu-mac eobc stats command gives a vast array of statics regarding the EOBC interface. Statistics about throttling are specifically sought after. Seeing the Rate limit reached counter incrementing indicates the network churn rate is approaching meltdown.
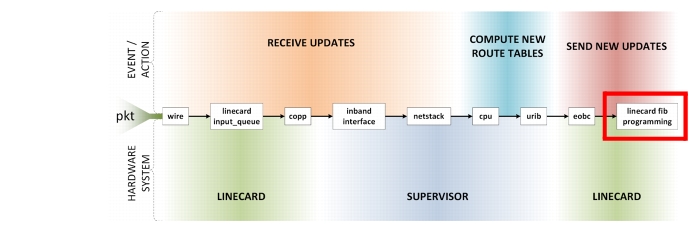
msdc-spine-r8# show hard int cpu-mac eobc stats | be Throttle | headThrottle statistics-----------------------------+---------Throttle interval ........... 3 * 100msPacket rate limit ........... 16000 ppsRate limit reached counter .. 0Tick counter ................ 6661123Active ...................... 0Rx packet rate (current/max) 30 / 6691 ppsTx packet rate (current/max) 28 / 7581 ppsLinecard FIB Programming
Each linecard and platform has its own programming algorithms for its forwarding engines. The architecture of each is different, so the specifics won't be covered here.5
Figure 2-11 Linecard FIB Programming
OSPF
Open Shortest Path First (OSPF) testing focused around control plane scale at a real MSDC customer network, herein to be referred as ACME_16 . ACME_1 has an OSPF network that runs at a higher scale than Cisco originally published for the N7K platform as supported, and is growing at a rapid pace.
This testing verification ensures Nexus 7000 capabilities of handling ACME_1s specific scenario.
This version of ACME_1 testing includes the following primary technology areas:
•
•
•
DDTS caveats discovered and/or encountered in this initial testing effort are identified in the "Defects Enountered" section of the external test results document.7
Table 2-1shows project scale number for OSPF scale parameters.
Table 2-1 Project Scale Number for OSPF Scale Parameters
Area 0 Type-1 LSA
>1000
Type-5 External
20,000->30,000
Neighbors
~45
All routing protocols are susceptible to scale limitation in the number of routes in the table and the number of peers to which they are connected. Link state protocols like OSPF are also susceptible to limitations in the number of routers and links within each area. The ACME_1 topology pushes all these limits, as is typical of most MSDC customers.
Summary of Test plan
OSPF Scale testing focused on 7 major considerations in this phase:
1.
2.
3.
4.
5.
6.
7.
Each test group (test set) had a series of individual tests. The reader may refer to a subsequent document detailing all tests and results upon request.
Summary of Results
OSPF testing results demonstrated that the network remains stable up to 30k LSAs, and can scale to 60k LSAs if BFD is enabled. OSPF and OSPF with BFD enabled showed some instability in a few instances with steady-state flaps and LSA propagation delays; however, both those issues are addressed in NX-OS 6.2.
BGP
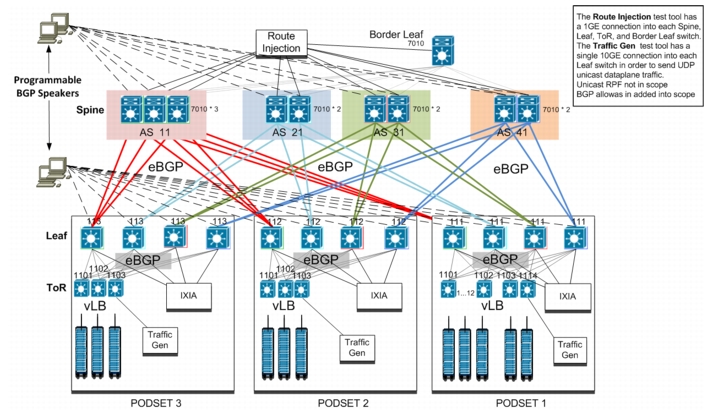
Another MSDC customer, ACME_2, was selected to examine alternative BGP arrangements for increasing scale of an MSDC without compromising convergence. Both resiliency and reliability were also top concerns needing attention, and are discussed below. The test topology was not a straightforward three-stage Clos, but rather closer to a "reduced" five-stage Clos with multiple Spine "networks", never the less, the same high-level topological principles apply (Figure 2-12). It was run within the test topology.
Figure 2-12 BGP Testing: Resilliency and Reliability
The system was composed of 3 physical Podsets8 , Podsets 1, 2 and 3. Each Podset consisted of 4 Nexus 3064 Leaf nodes and a mixture of Nexus 3064/3048 ToRs. Podset 1 had over a dozen TORs while Podset 2 and 3 had 3 ToRs. IXIA IXNetwork was used to bring the total number of real and simulatied ToRs to 17 for each Podset. Route-maps were configured on each ToR to advertise four /24 directly connected prefixes. A 300x VM Hadoop cluster was also connected to Podset 1 (also used for TCP incast and buffer utilization testing). Each VM connected to the ToR via a /30 connected subnet, configured through DCHP.
Note
Based on the DHCP forwarding address, backend servers map requests to specific racks, and position in the rack. Inband management was used for the Hadoop cluster, out of band was utilized for network devices. Each Leaf node connected to a single Spine. Depending on the Leaf node there were either two or three parallel connections to the Spine layer (ACME_2 requirement). IXNetwork was used to simulate up to 32 BGP spine sessions for each Leaf node.
Scaling was done to 140 POD sets at the Spine layer using combinations of real and simulated equipment. Each Spine node connected three non-simulated Leaf nodes, and the remaining nodes, 137 of them, were simulated using IXIA. All Leafs advertised 68 /24 ipv4 prefixes to each Spine node, and each Spine node received over 9000 BGP prefixes, in total, from the Leaf layer.
With the exception of the programmable BGP Speakers (pBS), BFD was enabled across the topology for each BGP session. BFD is enabled for all ToR <-> Leaf, Leaf <-> Spine, and Spine <-> Border connections.
pBSes were simulated using IXIA. Each Spine and Leaf node peered with a pBS. There were 32 BGP sessions with the pBS, per device, broken down into two groups, with each group consisting of sixteen BGP sessions. All 32 BGP sessions advertised hundreds of /32 VIPs used for service loadbalancing to the server. For all VIPS advertised, Group1 advertises prefix with MED 100 while Group 2 advertised MED 200. Each VIP had 16 equal cost paths in the route table; NH reachability for all VIPs point to the physical IP address of the load balancer(s).
To reach the final goal of 16,000 IPV4 prefixes, IXIA injected 4700 prefixes at the Border Leaf layer. Nexus 3000 limits the route size to 8K in hardware if uRPF is enabled (default). To get to the target of 16K routes, urpf had to be disabled on Leaf and ToR nodes.
Two types of traffic were used in testing:
1.
a.
b.
c.
2.
a.
b.
c.
With the entire system configured as outlined above, these were the 3 major test sets executed:
1.
2.
3.
Note
Summary of Results
All platforms must be considered when examining routing scale limits. For the N7K9 ; 2 session limits exist when running BGP with and without BFD. BFD is limited to 200 sessions per module, and 1000 sessions were supported per system. For BGP, 1000 neighbors per system were supported. Limits for N3K were less than N7K.
Observations
•
4.
•
–
–
5.
6.
7.
event manager applet fib-exceptionevent syslog pattern "<put-to-FIB-exception-gone-syslog>"action 1.0 cli clear ip route *action 1.1 syslog msg FIB Re-downloaded to HWFeatures are available in IOS-XR which would benefit NX-OS development, which address FIB issues encountered above.
8.
9.
10.
11.
Refer to subsequent testing documentation for complete details about ACME_2 testing.
BFD
Bidirectional Forwarding Detection (BFD), a fast failure detection technology, was found to allow for relaxed routing protocol timers. This in turn creates room for scaling routing protocols.
Summary of Results
BFD testing occurred between test instrumentation hardware and the Spine. 384 sessions were validated at the spine with both BGP and OSPF. A 500ms interval was configured based on overall system considerations for other LC specific processes.
Incast Simulation and Conclusions
Since SDU-MSDC's objective was provide meaningful network architecture guidance in this space, it is necessary to simulate as close to the real thing as possible. This presents difficulties in MSDC space because of the sheer volume of servers (endpoints, or nodes) that are required to make the problem appear in the first place.
Servers
Servers are distributed throughout the fabric with 10G connectivity. Refer to Server and Network Specifications, page A-1 for server specifications, configurations, and Hadoop applications details.
Intel recommends the following based on real world applications: http://www.intel.com/content/dam/doc/application-note/82575-82576-82598-82599-ethernet-controllers-interrupts-appl-note.pdf
Note
TCP receive buffers were configured at 32MB. It was set higher because the goal was to remove receive window size as a potential limitation on throughput and to completely rely on CWND. This is not realistic for a production deployment, but it made tracking key dependencies easier. Refer to Incast Utility Scripts, IXIA Config, page E-1 for relevant sysctl.conf items.
The formula for TCP receive window is:
Below shows TCP RX window is set correctly:
[root@r09-p02-vm01 tmp]# more /proc/sys/net/ipv4/tcp_adv_win_scale2Based on theeformula, 75% of buffer size is used for TCP receive window (25MB window scale factor 10). This value is never reached as CWND is always the limiting factor.
Note
Other TCP parameters were as follows:
•
[root@r09-p02-vm01 ipv4]# more tcp_sack1•
[root@r09-p02-vm01 ipv4]# more ip_forward0•
[root@r09-p02-vm01 ipv4]# more tcp_congestion_controlCubic[root@r09-p02-vm01 ipv4]# more tcp_reordering3•
All VMs were configured with 4 VCPU and 20G memory. Since the Hadoop jobs were not CPU bound, one vcpu would have been sufficient. IO was the biggest bottleneck especially when less than 20G assigned and during cluster failure; hence moving to 20G masked that. For comparison purposes, to copy a 1G file from hdfs to local disk iowait peak was at 75% with 3G memory, barely over 1% @20G. This is because linux page cache relies on pdflush to write data of cache to disk, and this is nominally 30 seconds or 10% dirty pages. Depending on the type of job write interval can be tuned up or down, as required :
Note
To manage failures and their impact to Incast events, two scripts were written to track the status of a job: "fail-mapper.sh" and "find-reducer.sh". fail-mapper.sh reloads 15% of the VMs immediately before the reduce phase, and find-reducer.sh launches tcpdump on the reducer. Tcpdump output was used to analyze TCP windowing behavior during Incast events.
Following logic was implemented in fail-mapper.sh:
1.
2.
3.
4.
Find-reducer.sh determines the location of the reducer and launches tcpdump.
Topology
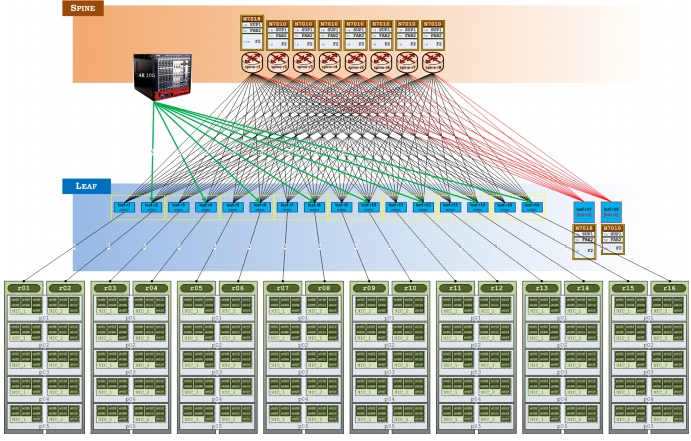
Figure 2-13 shows a standard 3-stage folded Clos topology, with 8 Spines and 16 Leafs.
Figure 2-13 Incast Lab Setup
Note
Initially, there was noise traffic sent to exhaust both "bandwidth" and "buffer utilization", but it was determined exercising buffers was sufficient, along with Hadoop traffic, to create Incast events. For completeness, the "bandwidth utilization" noise floor traffic method is described in Bandwidth Utilization Noise Floor Traffic Generation, page F-1.
The border devices represent "external" networks and are injecting a default route, effectively acting as a sensor for spurious traffic.
Buffer Utilization
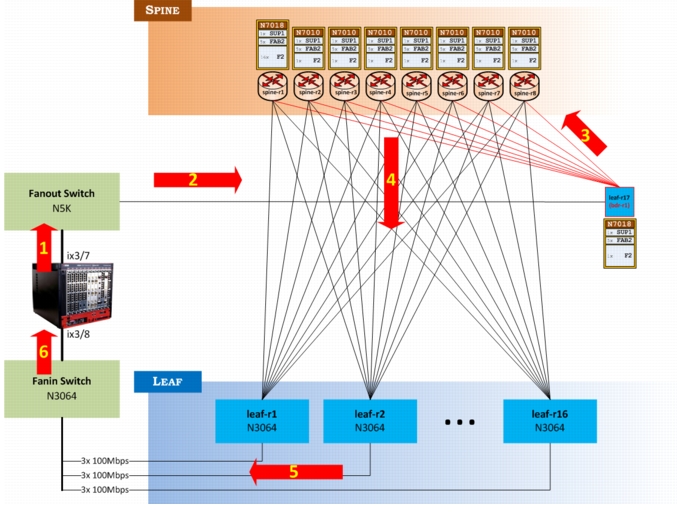
Figure 2-14 shows an IXIA shared buffer setup.
Figure 2-14 IXIA Shared Buffer Setup
The IXIA is connected to each Leaf indirectly, and using a series of oscillating traffic bursts, in conjunction with the bandwidth "noise" traffic above, both dedicated and shared buffers on the Leafs are consumed at will (oscillating traffic is needed because the IXIA wasn't able to consistently consume N3K buffers with steady-stream traffic). The purposes of sending traffic through the border leaf and to the Spines are two-fold:
1.
2.
In detail, this is how the IXIA is configured for shared buffer impairment traffic:
2x 10G interfaces, in total, are used to Send (Ix3/7) and Recv (Ix3/8) uni-directional UDP traffic. The source traffic comes into an N5K fanout switch (this switch held other experiments to the border, so it was left intact - technically, the IXIA could be connected directly to the border leaf, achieving the same result) to Border leaf-r1 (msdc-leaf-r17), which connects to Spines r1 - r8.
•
msdc-leaf-r17# show ip route 10.128.4.131IP Route Table for VRF "default"'*' denotes best ucast next-hop'**' denotes best mcast next-hop'[x/y]' denotes [preference/metric]'%<string>' in via output denotes VRF <string>10.128.4.128/25, ubest/mbest: 8/0*via 10.1.1.32, [20/0], 8w0d, bgp-64617, external, tag 64512*via 10.2.1.32, [20/0], 8w0d, bgp-64617, external, tag 64512*via 10.3.1.32, [20/0], 8w0d, bgp-64617, external, tag 64512*via 10.4.1.32, [20/0], 8w0d, bgp-64617, external, tag 64512*via 10.5.1.32, [20/0], 8w0d, bgp-64617, external, tag 64512*via 10.6.1.32, [20/0], 8w0d, bgp-64617, external, tag 64512*via 10.7.1.32, [20/0], 8w0d, bgp-64617, external, tag 64512*via 10.8.1.32, [20/0], 8w0d, bgp-64617, external, tag 64512•
msdc-leaf-r1# show ip int briefIP Interface Status for VRF "default"(1)Interface IP Address Interface StatusVlan11 10.128.4.129 protocol-up/link-up/admin-upVlan12 10.128.5.1 protocol-up/link-up/admin-upVlan13 10.128.6.1 protocol-up/link-up/admin-upmsdc-leaf-r2# show ip int briefIP Interface Status for VRF "default"(1)Interface IP Address Interface StatusVlan11 10.128.8.129 protocol-up/link-up/admin-upVlan12 10.128.9.1 protocol-up/link-up/admin-upVlan13 10.128.10.1 protocol-up/link-up/admin-up•
msdc-leaf-r1# show cdp neighborsCapability Codes: R - Router, T - Trans-Bridge, B - Source-Route-BridgeS - Switch, H - Host, I - IGMP, r - Repeater,V - VoIP-Phone, D - Remotely-Managed-Device,s - Supports-STP-DisputeDevice-ID Local Intrfce Hldtme Capability Platform Port IDmsdc-leaf-r42(FOC1550R05E)Eth1/46 131 R S I s N3K-C3048TP-1 Eth1/1msdc-leaf-r42(FOC1550R05E)Eth1/47 135 R S I s N3K-C3048TP-1 Eth1/2msdc-leaf-r42(FOC1550R05E)Eth1/48 133 R S I s N3K-C3048TP-1 Eth1/3Two traffic items are configured:
1.
2.
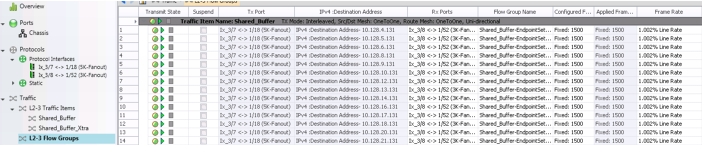
Shared_Buffer (Figure 2-15) has 48 endpoints that send UDP traffic unidirectional (3 streams to each leaf) at ~ 100Mb. This causes dedicated buffers to be consumed for that port, but does not dip into the system-wide shared buffer pool.
Figure 2-15 IXIA Flows for Shared_Buffer
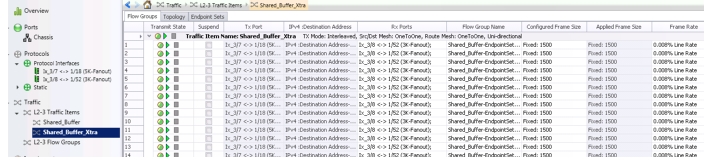
Shared_Buffer_Xtra (Figure 2-16) has the same 48 endpoints and traffic profile except that it sends traffic at ~ 800Kb.
Figure 2-16 IXIA Flows for Shared_Buffer_Xtra
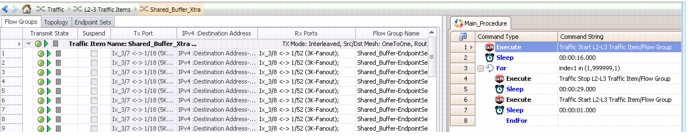
This exceeds the interface throughput when combined with the first profile and starts to consume shared buffers. To achieve a shared buffer impairment without running out of buffers an IXIA script is used to stop and start the Xtra traffic stream, while the Shared_Buffer stream runs continuously (Figure 2-17).
Figure 2-17 IXIA Shared Buffer Impairment Timing
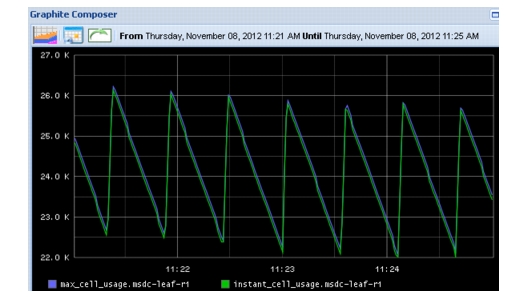
The timing of the script first loads up the shared buffers to ~8.5k for each of the 3 interfaces and then switches to a pattern where it alternates between bleeding off and increasing the buffer usage. This allows for a majority of the shared buffers to be used without exceeding the limit and dropping packets. The process forms a saw tooth pattern of usage shown in Figure 2-18.
Figure 2-18 IXIA Shared Buffer Impairment Traffic Oscillation
Buffer Allocation
Because the primary objective in these tests is to observe buffer behavior on the N3K Leaf layer, it must be ensured that dedicated buffers are consumed and shared buffer space is being exercised.
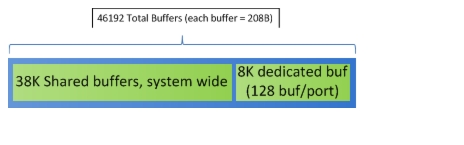
Figure 2-19 shows the overall schema of shared vs dedicated buffers on the N3K
Figure 2-19 N3K Buffers
This means the noise floor will consume all 128 dedicated buffers per port and has the capability of leeching into shared space, at will. With this control, Incast traffic can be pushed over the tipping point of consuming the remainder of available buffer space, i.e. - shared buffers, thus causing an Incast event. Table 2-2 shows how buffers are allocated system-wide.
Note
Admission control criteria are:
1.
2.
3.
N3064-E imposes dynamic limits on a per queue basis for each port. The dynamic limit is controlled by the alpha parameter, which is set to 2. In dynamic mode, buffers allocated per interface cannot exceed the value based on this formula:
See N3K datasheets for a more detailed treatment of buffer admission control.
Monitoring
Standard Hadoop, Nagios, Graphite and Ganglia tools were used to monitor all VMs involved. Custom Python scripts, running on the native N3K Python interpreter, were created to monitor shared buffer usage.
Incast Event
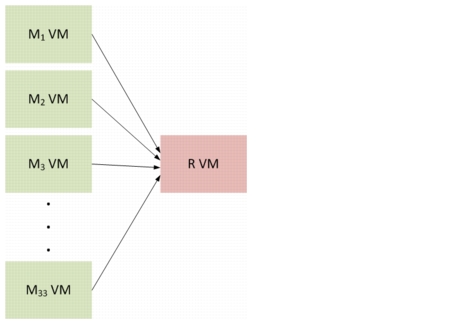
Figure 2-20 shows a logical representation of the Incast event created.
Figure 2-20 Incast Event with M Mappers and R Reducers
Incast events were created by one of three methods:
1.
2.
3.
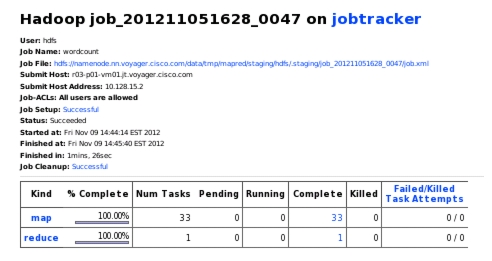
The test results in this section show two examples of a 33:1 Incast event created by inducing failures, as listed above, between the 33 M VMs to the 1 Reducer (R) VM: copying a 1GB file.
Note
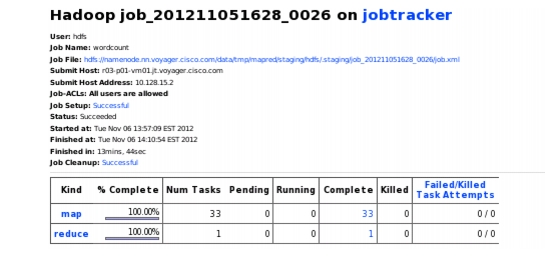
For the first example (Figure 2-21, Figure 2-22), two Hadoop jobs were executed: _0026 and _0027. Job 26 was tracked, and when the Map phase reached 96% of completion a script would kill 15% of the Map nodes only used in job 27. This would force failures on that particular job and cause block replication (data xfer) throughout the network. This was an attempt to introduce a cascading failure. However, it did not occur - Job 26 experienced the expected incast event, but no additional failure events were seen. Though numerous errors due to force-failed datanodes were observed in Job27, it too completed once it was able to recover after the Incast event.
Figure 2-21 33 Mappers to 1 Reducer
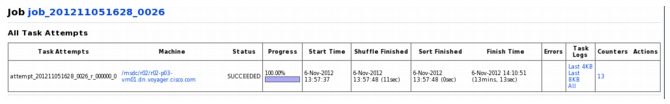
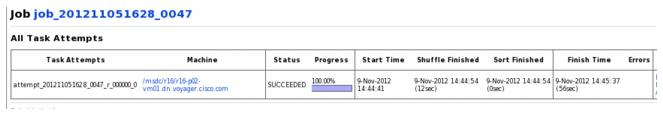
Figure 2-22 Task Ran to Completion Once it Recovered
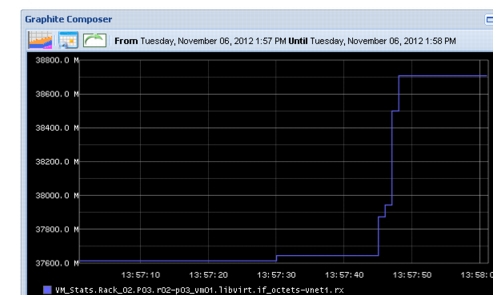
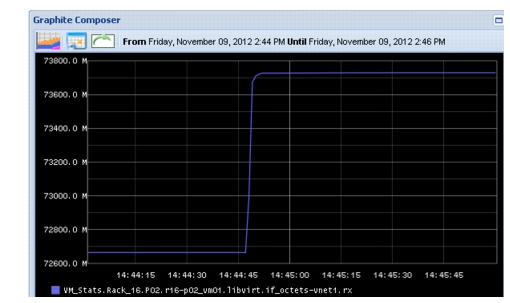
The Reduce Copy phase is when the reducer requests all Map data in order to sort and merge the resulting data to be written to the output directory. The Incast burst occurs during this `Copy' phase, which occurs between the Start time and Shuffle Finished time (Figure 2-23). Due to tuning parameters used to maximize network throughput bursting, the 1GB data transfer completed within a few seconds during the time window of 11s.
Figure 2-23 Traffic Received from Perspective of Reducer
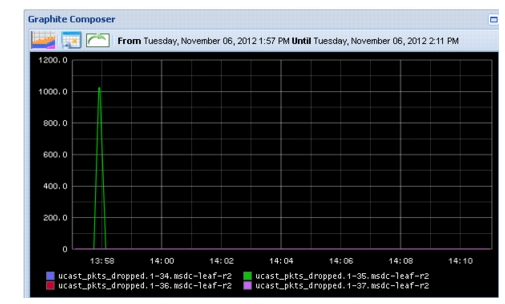
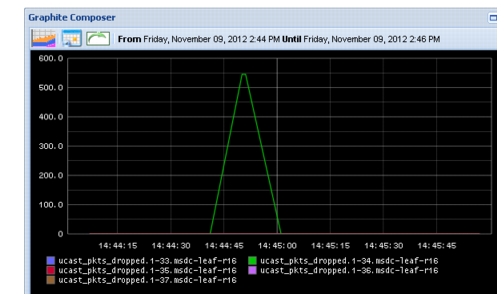
Interfaces on the Leaf switch which connects to servers are 1-33 - 37, map to r02-p0(1-5)_vm01, respectively, thus Leaf interfaces which connect to the Reducer is 1-35. Figure 2-24 shows packet loss seen by the switch interface during event. Because data points for packets dropped are plotted every 10s by Graphite, and reported every 1s by the switch, the time period is slightly skewed.
Figure 2-24 Packet Loss, as Seen by Leaf Device
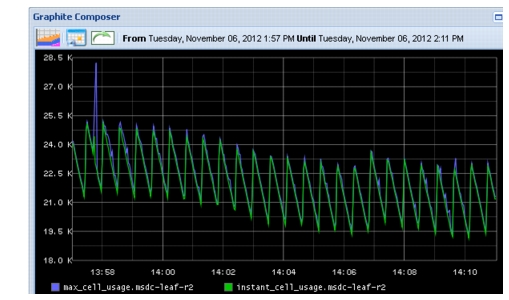
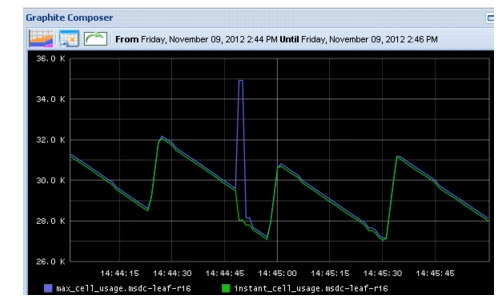
Figure 2-25 shows global instant cell usage and max cell usage, observed as the sharp burst in traffic, for the Reducer (Leaf-R2). The instant cell data point doesn't show up for this interface because the event occurs quickly then clears before the data point can be captured. However, max cell usage is persistent and reflects the traffic event.
Figure 2-25 Instant and Max Cell (Buffer) Usage, as Seen on the N3K
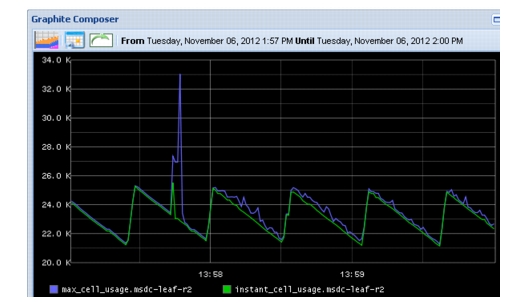
Figure 2-26 is a zoomed-in view of the spike. The additional spiking after the event is due to block replication that occurs from the force-failed VMs.
Figure 2-26 Max Cell Usage Zoom on the Spike
The reason why the spike didn't use all 37976 shared buffers available on the N3K system is because of buffer admission control - cannot exceed 2x available buffer per interface.
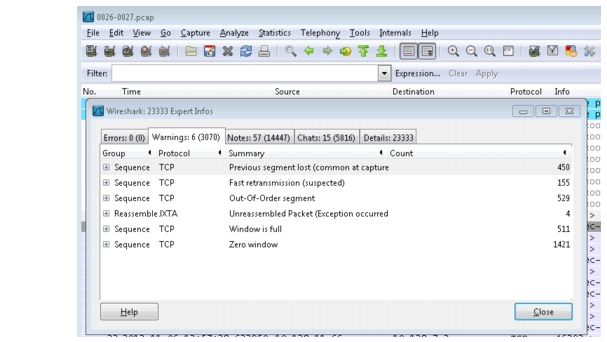
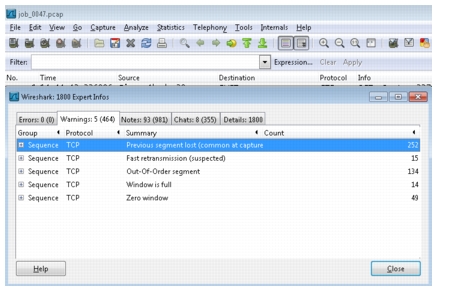
Lastly, for Job26, Figure 2-27 shows a Wireshark Expert Analysis of this job from a trace taken on the Reducer. Throughput collapse is evidenced by "Zero window" parameter (this means the TCP connection has a window-size of 0 and no payload can be transmitted/acknowledged); after which TCP slow-start mechanism kicks in.
Figure 2-27 TCP Statistics
The second example is Job47 (Figure 2-28, Figure 2-29), which looks similar to Job26, but there is an additional comparison to the Control at the end. As before, there are 33 Mappers and 1 Reducer. One Hadoop job was launched with the IXIA shared buffer impairment running without any force failures. The Reduce copy phase produced a spike causing drops and degradation.
Due to the tuning parameters used to maximize network throughput bursting the 1GB data transfer was complete within a few seconds during the time window of 12s.
Figure 2-28 Job47: 33 Mappers and 1 Reducer
Figure 2-29 Completed Successfully After it Recovered From the Incast Event
As with Job26, the burst received by Reducer (r16-p02_vm01) is seen in Figure 2-30:
Figure 2-30 Traffic Burst to the Reducer
Figure 2-31 shows packet loss for the Incast event.
Figure 2-31 Packet Loss for Job47 During Incast Event
Figure 2-32 shows instant and max cell (buffer) usage.
Figure 2-32 Zoom In on Spike in Max Cell Usage
Note
Figure 2-33 shows TCP connection stats throughput collapse.
Figure 2-33 TCP Stats as Reported by Wireshark of Packet Capture File
The following configuration is a parsed tcptrace CLI output on VMs, with important metrics highlighted:
TCP connection 6:host k: r16-p02-vm01.dn.voyager.cisco.com:43809host l: r10-p01-vm01.dn.voyager.cisco.com:50060complete conn: yesfirst packet: Fri Nov 9 14:44:48.479320 2012last packet: Fri Nov 9 14:45:02.922288 2012elapsed time: 0:00:14.442968total packets: 3107filename: job_0047.pcapk->l: l->k:total packets: 1476 total packets: 1631ack pkts sent: 1475 ack pkts sent: 1631pure acks sent: 1473 pure acks sent: 1sack pkts sent: 40 sack pkts sent: 0dsack pkts sent: 0 dsack pkts sent: 0max sack blks/ack: 1 max sack blks/ack: 0unique bytes sent: 302 unique bytes sent: 33119860actual data pkts: 1 actual data pkts: 1628actual data bytes: 302 actual data bytes: 33158956rexmt data pkts: 0 rexmt data pkts: 5rexmt data bytes: 0 rexmt data bytes: 39096zwnd probe pkts: 0 zwnd probe pkts: 0zwnd probe bytes: 0 zwnd probe bytes: 0outoforder pkts: 0 outoforder pkts: 0pushed data pkts: 1 pushed data pkts: 60SYN/FIN pkts sent: 1/1 SYN/FIN pkts sent: 1/1req 1323 ws/ts: Y/Y req 1323 ws/ts: Y/Yadv wind scale: 10 adv wind scale: 10req sack: Y req sack: Ysacks sent: 40 sacks sent: 0urgent data pkts: 0 pkts urgent data pkts: 0 pktsurgent data bytes: 0 bytes urgent data bytes: 0 bytesmss requested: 1460 bytes mss requested: 1460 bytesmax segm size: 302 bytes max segm size: 26064 bytesmin segm size: 302 bytes min segm size: 1448 bytesavg segm size: 301 bytes avg segm size: 20367 bytesmax win adv: 3950592 bytes max win adv: 16384 bytesmin win adv: 1024 bytes min win adv: 16384 byteszero win adv: 0 times zero win adv: 0 timesavg win adv: 1953866 bytes avg win adv: 16384 bytesmax owin: 303 bytes max owin: 983193 bytesmin non-zero owin: 1 bytes min non-zero owin: 1 bytesavg owin: 1 bytes avg owin: 414083 byteswavg owin: 0 bytes wavg owin: 59842 bytesinitial window: 302 bytes initial window: 14480 bytesinitial window: 1 pkts initial window: 1 pktsttl stream length: 302 bytes ttl stream length: 33119860 bytesmissed data: 0 bytes missed data: 0 bytestruncated data: 246 bytes truncated data: 33067788 bytestruncated packets: 1 pkts truncated packets: 1628 pktsdata xmit time: 0.000 secs data xmit time: 3.594 secsidletime max: 10728.5 ms idletime max: 10842.2 msthroughput: 21 Bps throughput: 2293148 BpsRTT samples: 3 RTT samples: 1426RTT min: 0.6 ms RTT min: 0.1 msRTT max: 1.0 ms RTT max: 64.5 msRTT avg: 0.8 ms RTT avg: 13.5 msRTT stdev: 0.2 ms RTT stdev: 9.3 msRTT from 3WHS: 0.6 ms RTT from 3WHS: 0.3 msRTT full_sz smpls: 2 RTT full_sz smpls: 2RTT full_sz min: 0.6 ms RTT full_sz min: 0.1 msRTT full_sz max: 0.9 ms RTT full_sz max: 0.3 msRTT full_sz avg: 0.8 ms RTT full_sz avg: 0.2 msRTT full_sz stdev: 0.0 ms RTT full_sz stdev: 0.0 mspost-loss acks: 0 post-loss acks: 0segs cum acked: 0 segs cum acked: 199duplicate acks: 0 duplicate acks: 36triple dupacks: 0 triple dupacks: 1max # retrans: 0 max # retrans: 4min retr time: 0.0 ms min retr time: 0.0 msmax retr time: 0.0 ms max retr time: 89.2 msavg retr time: 0.0 ms avg retr time: 35.5 mssdv retr time: 0.0 ms sdv retr time: 47.7 msNote the RTT was quite large, especially considering all VMs for these tests are in the same datacenter.
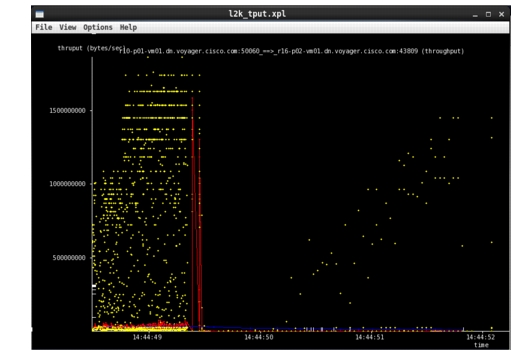
Figure 2-34 shows a scatterplot taken from raw tcptrace data as sampled on the Reducer - thoughput collapse and ensuring TCP slow-start are easily visible. Yellow dots are raw, instantaneous, throughput samples. Red line is the average throughput based on the past 10 samples. Blue line (difficult to see) is the average throughput up to that point in the lifetime of the TCP connection.
Figure 2-34 Scatterplot of TCP Throughput (y-axis) vs Time (x-axis)
By way of comparison, here is the Control for the test: a copy of the same 1GB job between the Reducer to the output directory, as assigned by HDFS, and no Incast event was present (it's a one to many, not many to one, communication).
TCP connection 46:host cm: r16-p02-vm01.dn.voyager.cisco.com:44839host cn: r10-p05-vm01.dn.voyager.cisco.com:50010complete conn: yesfirst packet: Fri Nov 9 14:45:13.413420 2012last packet: Fri Nov 9 14:45:15.188133 2012elapsed time: 0:00:01.774713total packets: 4542filename: job_0047.pcapcm->cn: cn->cm:total packets: 2146 total packets: 2396ack pkts sent: 2145 ack pkts sent: 2396pure acks sent: 100 pure acks sent: 1360sack pkts sent: 0 sack pkts sent: 0dsack pkts sent: 0 dsack pkts sent: 0max sack blks/ack: 0 max sack blks/ack: 0unique bytes sent: 67659222 unique bytes sent: 12399actual data pkts: 2044 actual data pkts: 1034actual data bytes: 67659222 actual data bytes: 12399rexmt data pkts: 0 rexmt data pkts: 0rexmt data bytes: 0 rexmt data bytes: 0zwnd probe pkts: 0 zwnd probe pkts: 0zwnd probe bytes: 0 zwnd probe bytes: 0outoforder pkts: 0 outoforder pkts: 0pushed data pkts: 928 pushed data pkts: 1034SYN/FIN pkts sent: 1/1 SYN/FIN pkts sent: 1/1req 1323 ws/ts: Y/Y req 1323 ws/ts: Y/Yadv wind scale: 10 adv wind scale: 10req sack: Y req sack: Ysacks sent: 0 sacks sent: 0urgent data pkts: 0 pkts urgent data pkts: 0 pktsurgent data bytes: 0 bytes urgent data bytes: 0 bytesmss requested: 1460 bytes mss requested: 1460 bytesmax segm size: 65160 bytes max segm size: 12 bytesmin segm size: 210 bytes min segm size: 3 bytesavg segm size: 33101 bytes avg segm size: 11 bytesmax win adv: 15360 bytes max win adv: 195584 bytesmin win adv: 15360 bytes min win adv: 16384 byteszero win adv: 0 times zero win adv: 0 timesavg win adv: 15360 bytes avg win adv: 183357 bytesmax owin: 174158 bytes max owin: 37 bytesmin non-zero owin: 1 bytes min non-zero owin: 1 bytesavg owin: 65325 bytes avg owin: 10 byteswavg owin: 66250 bytes wavg owin: 0 bytesinitial window: 241 bytes initial window: 3 bytesinitial window: 1 pkts initial window: 1 pktsttl stream length: 67659222 bytes ttl stream length: 12399 bytesmissed data: 0 bytes missed data: 0 bytestruncated data: 67544758 bytes truncated data: 0 bytestruncated packets: 2044 pkts truncated packets: 0 pktsdata xmit time: 1.755 secs data xmit time: 1.766 secsidletime max: 18.7 ms idletime max: 19.2 msthroughput: 38124036 Bps throughput: 6986 BpsRTT samples: 1086 RTT samples: 891RTT min: 0.2 ms RTT min: 0.1 msRTT max: 3.0 ms RTT max: 8.0 msRTT avg: 1.3 ms RTT avg: 0.7 msRTT stdev: 0.5 ms RTT stdev: 1.0 msRTT from 3WHS: 0.3 ms RTT from 3WHS: 0.2 msRTT full_sz smpls: 2 RTT full_sz smpls: 2RTT full_sz min: 0.3 ms RTT full_sz min: 0.2 msRTT full_sz max: 0.8 ms RTT full_sz max: 0.3 msRTT full_sz avg: 0.5 ms RTT full_sz avg: 0.2 msRTT full_sz stdev: 0.0 ms RTT full_sz stdev: 0.0 mspost-loss acks: 0 post-loss acks: 0segs cum acked: 960 segs cum acked: 145duplicate acks: 1 duplicate acks: 0triple dupacks: 0 triple dupacks: 0max # retrans: 0 max # retrans: 0min retr time: 0.0 ms min retr time: 0.0 msmax retr time: 0.0 ms max retr time: 0.0 msavg retr time: 0.0 ms avg retr time: 0.0 mssdv retr time: 0.0 ms sdv retr time: 0.0 ms================================It comes as no surprise that RTT is significantly less than when there was Incast: 3ms down from ~60ms, what one would expect for a 1:1 interaction.
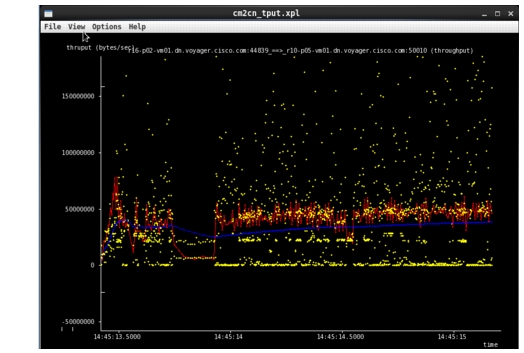
Finally, Figure 2-35 shows the scatterplot of the TCP connection while the file was being copied.
Figure 2-35 Example of Good TCP Throughput for 1:1 Control Test
The reason for the dip ¼ the way through is inconclusive, but the important point is that it doesn't go to zero, nor is slow-start seen after the dip (as one would expect if collapse had occurred), and the file copy for the Control test completed in 1.7 seconds (with reasonable RTT), as opposed to 14 seconds for Job47.
Incast Testing Summary
The objectives of performing Incast testing for Phase 1 were achieved, that is:
1.
2.
3.
Future Phases of MSDC testing may include additional Incast research. Such research would potentially explore additional tuning on both Linux and NX-OS platforms to better signal when Incast events occur, and perhaps even deal with Incast more proactively using technologies like ECN and buffer usage trending.
MSDC Conclusion
The purpose of this document was to:
1.
2.
3.
4.
It achieved that purpose.
•
•
•
•
Using underlying theory, coupled with hands-on examples and use-cases, knowledge and tools are given to help network architects be prepared to build and operate MSDC networks.
2 As of this writing hostname is only available in Caymen+ (U4.1) and GoldCoast Maintenance.3 This output is from 5.0(3)U3.2. Output is more verbose in 5.0(3)U4.1.6 To protect the names of the innocent, as well as comply with MNDA requirements, ACME_1 will be used. If other real MSDC customers are referred to in this document, they will be notated as "ACME_2", "ACME_3", etc.7 For a detailed discussion of testing results, please refer to the document "Cisco ACME_1 Control Plane Scale Testing, Phase 1 Test Results". This guide is intended to provide a summary only of overall considerations.8 A Podset would be comprised of hundreds of servers. ToRs for each rack were N3064s. Pod sets connect to an infrastructure based on the three-stage Clos topology. For the purposes of testing, a smaller-scale version of the customer has in production was used.9 http://www.cisco.com/en/US/docs/switches/datacenter/sw/verified_scalability/b_Cisco_Nexus_7000_Series_NX-OS_Verified_Scalability_Guide.html#concept_2CDBB777A06146FA934560D7CDA37525