Table Of Contents
Ensuring Consistent Application Experiences
Evaluating Service Health
Health Rules
Creating Custom Applications
Identifying Optimization Candidates
Establishing Performance Baselines
Enabling Baselining
Validating Optimization ROI
Monitoring Optimized Flows
Ensuring Consistent Application Experiences
Cisco Wide Area Application Services (WAAS) devices and software help to ensure high-quality WAN end-user experiences across applications at multiple sites.
•
Evaluating Service Health
•
Identifying Optimization Candidates
•
Establishing Performance Baselines
•
Validating Optimization ROI
•
Monitoring Optimized Flows
Note
To use this feature, your Cisco Prime Infrastructure implementation must include Assurance licenses.
For WAAS deployments to be successful, however, network operations staff must share a common data resource that gives them complete visibility into network performance data throughout every stage of the optimization cycle, including:
•
Identifying the sites and applications that are candidates for optimization, so that network designers can plan where WAAS optimization is critical (see Identifying Optimization Candidates).
•
Establishing site and application performance baselines (see Establishing Performance Baselines).
Prime Infrastructure performs baselining for key performance metrics and detects abnormal deviations of baselined values. The key performance metrics include:
–
Server Response Time
–
Client Transaction Time
–
Network Round-Trip Time
–
MOS score
–
Jitters
–
Packet loss
–
Bytes sent/received
–
Interface utilization
–
CPU Utilization
–
Memory Utilization
Prime Infrastructure determines the baseline (mean) for each metric by taking the average values of the metric during the last 30 days. Average values are computed separately for each hour of the day for each monitored entity (such as interface, host, site, or application). For example, the baseline for HTTP response time of a given server between 9AM to 10AM today will be different from the baseline of the same server between 7PM to 8PM yesterday.
Prime Infrastructure also computes the metrics' standard deviations using the last 30 days of data. Similar to averages, standard deviations are computed separately for each hour of the day for each monitored entity.
•
Post-implementation validation that WAN performance and application stability have actually improved (see Validating Optimization ROI).
Because the mean and standard deviation of each metric vary over time, Prime Infrastructure continuously reevaluates the thresholds used to compute the health scores (adaptive thresholds). Prime Infrastructure computes baselines and thresholds every hour, and evaluates health scores every five minutes. In each interval:
a.
Health scores are computed for every application-site combination.
b.
These health scores are aggregated to derive the overall health of each business-critical application (across all sites) and overall health of each site (across all business-critical applications).
When aggregating across sites/applications, the worst scores are used. For example, if any business-critical application of a given site is rated "red," that site is also rated "red" for that interval. See Health Rules for more information.
•
Ongoing monitoring and troubleshooting of the optimized flows (see Monitoring Optimized Flows).
Using the baseline means and standard deviations, Prime Infrastructure can monitor application and service health issues by detecting abnormal deviations of key metrics from their baselined values and assign a health scores (red, yellow, or green) for each application and site for each monitoring interval:
–
A red score indicates a highly abnormal deviation from baseline (deviations from baselines with a probability of less than 0.1%).
–
A yellow score indicates a mildly abnormal deviation (deviations with a probability of less than 1%).
–
A green score indicates that the metric is within its normal range.
–
A gray score indicates there is insufficient data for a site/application.
Cisco Prime Infrastructure offers a consistent data resource for each of these stages in performance optimization.
Evaluating Service Health
The Service Health dashboard (Home > Performance > Service Health) displays the sites and their business critical applications. Each application for a site is given a score for each of the KPIs (Key Performance Indicators) that are available in the system:
•
Traffic (megabits per second)
•
Client Experience (varies based on application type: average transaction time for transaction-based applications such as HTTP, or MOS code for real-time applications such as RTP)
•
Network Performance (average network time for HTTP, jitter and Package Loss for RTP)
•
Application Response (applicable only for transaction-based applications such as HTTP)
The KPI scores can come from multiple data sources; scores are computed across all data sources for all of the KPIs, and the overall score in the main dashboard is an aggregate of these scores. Scores are assigned as red, yellow, or green based on the warning and critical threshold values assigned in Administration > Health Rules; you can use this option to modify the health rule settings as necessary for your network.
For data to be displayed in Service Health, there must be at least one hour of data. After the first hour, the previous hour's data is overlaid on the data line as the historical data for the next hour. After the first day, standard deviation and mean are based on the hourly data for the previous day.
Note
The Site-Application Health Summary dashlet will display data two hours after the server has been installed; baseline dashlets will display baseline values after one hour.
These scores are stored for seven days. When you view the data for a previous day, the maximum moving time interval is six hours (you can look at up to six hours of data at a time).
Health Rules
The data displayed in the Service Health dashboard (Home > Performance > Service Health) is computed using health rules. You can customize the health rules by clicking the desired row and editing the Critical and Warning values.
•
Critical—turns red when the data value exceeds the specified Critical value.
•
Warning—turns yellow when the data value exceeds the Warning value.
If the health rule does not exceed the specified Critical or Warning values, it is green.
For example, for Traffic Rate, you might specify the T1 the baseline value of 100 Mbps for a given site, application, and datasource, and the standard deviation value of 20 Mbps.
If the Traffic Rate exceeds 161.8 Mbps, which is 100+(3.09 x 20), you see a red bar indicating a critical warning.
You can click any of the colored bars to get further details.
Creating Custom Applications
Use the Applications and Services option to create and manage custom applications and services. Services are groups of applications. Prime Infrastructure provides a default set of applications and services consistent with the Cisco NBAR standard. (See http://www.cisco.com/en/US/products/ps6616/products_ios_protocol_group_home.html for more information.)
You can create custom applications that contain the definitions you require and which are not available (either from the device or from Prime Infrastructure). After you create an application, you can deploy the application to the supported devices. Deploying the application definition to the device makes Netflow exported data consistent with Prime Infrastructure and other management tools.
If you deploy a custom application to a device and later want to remove it, you must undeploy the application using the Applications and Services option. If you delete the custom application from Prime Infrastructure only, the custom application remains active on the device.
Applications without definitions are displayed as "unknown."
Custom applications are organized under services; services are organized by category and subcategory to align with the Cisco NBAR standard. For more information about NBAR, see http://www.cisco.com/en/US/products/ps6616/products_ios_protocol_group_home.html.
To create a custom application:
Step 1
Choose Operate > Applications and Services, click All Applications in the left column, then click Create.
Step 2
On the Service Health dashboard, some applications are already set as "Business Critical". To view the currently defined business critical applications and to edit the contents of the Service Health dashboard:
a.
Click All Applications in the left column, check the check box for the application, then click Edit.
b.
In the Edit Application box, check the Business Critical check box, then click Update.
Step 3
Enter any additional required fields, then click Create.
Step 4
Push your new application to a NAM or an ASR/ISR:
a.
Choose the User Defined Applications, from the show drop-down list, and check the new application check box, then click Deploy.
b.
In the Device Selection dialog box, select the NAM device or the ISR/ASR to which this application is to be deployed, then click Submit.
c.
Click View Jobs to display the status of the deployment job.
Identifying Optimization Candidates
Follow these steps to identify your network's lowest performing applications, clients, servers, and network links.
Step 1
Choose Operate > Monitoring Dashboards > Detail Dashboards, then click the WAN Optimization tab.
Step 2
Add the following dashlets (see Adding Dashlets) to this dashboard:
•
Application Traffic
•
Server Traffic
•
Client Traffic
•
Network Links
Step 3
Using these dashlets, identify the optimization candidates:
•
All of the dashlets show the current traffic rate (in bytes per second), average number of concurrent connections, and average transaction time in milliseconds, for every application, client, server, or network link.
•
Network Links also shows the sites for that client and server endpoints of each link, and the average length of time that the link exists.
•
Server Traffic shows both the server IP address and the application that it serves.
Step 4
Sort and filter the performance data as needed:
•
To sort on any column in any dashlet, click the column heading.
•
To filter the data displayed in all of the dashlets by Time Frame, Site, or Application, enter or select the filter criteria you want on the Filters line and click Go.
•
To filter within a dashlet, click its Filter icon and specify a Quick or Advanced Filter, or use a Preset Filter.
Step 5
For a quick report of the same data:
a.
Choose Report > Report Launch Pad. Choose Operate > Performance > WAN Traffic Analysis Summary.
b.
Specify filter and other criteria for the report, then click Run.
Establishing Performance Baselines
Follow these steps to establish the standard performance characteristics of your candidate applications and sites before implementing WAN optimizations.
Step 1
Choose Operate > Monitoring Dashboards > Detail Dashboards, then click the Application tab.
Step 2
Add the following dashlets (see Adding Dashlets) to this page:
•
Worst N Clients by ART Metrics
•
Worst N Sites by ART Metrics
•
Application Server Performance
•
Application Traffic Analysis
Step 3
Use these dashlets to establish the performance characteristics of your optimization candidates as currently configured:
•
Worst N Clients by ART Metrics: For the worst-performing clients and applications: Maximum and average transaction times, and 24-hour performance trend.
•
Worst N Sites by ART Metrics: The same information for the worst-performing sites and applications.
•
Application Server Performance: For all application servers: the maximum and average server response time, and a 24-hour performance trend.
•
Application Traffic Analysis: Gives 24-hour application traffic metrics in bytes per second and packets per second. Calculates statistical mean, minimum, maximum, median, and first and second standard deviation for the period,
You can sort by any column in any dashlet by clicking the column heading. You can also filter the data in the dashlets by Time Frame, Site, and Application.
Step 4
Click the Site tab and use Top N Applications, Top N Devices with Most Alarms, Top N Clients and Worst N Clients by ART Metrics as you did in Step 3.
Enabling Baselining
Standard deviation and mean values are used to compute the scores in the Service Health dashboard. Baselining is not enabled by default. When baselining is enabled:
•
The blue box indicates the standard deviation.
•
The blue line indicates the mean value for that hour.
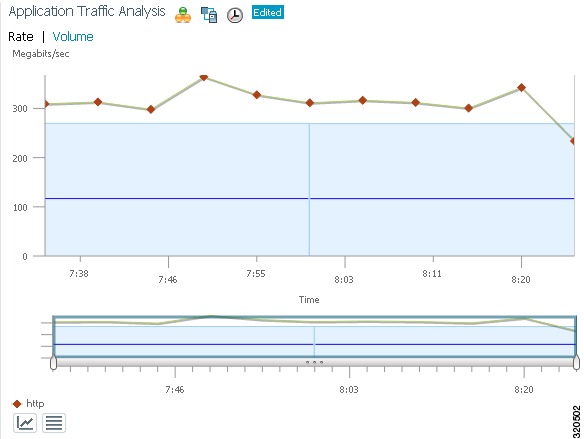
Figure 17-1 Sample Baseline Values
To enable baselining:
Step 1
Choose Operate > Monitoring Dashboards > Detail Dashboards, then click the Application tab.
Baselining is supported by these dashlets:
•
Application Traffic Analysis—Shows the aggregate bandwidth rate/volume for a site/enterprise one application, service, or set of applications.
•
Application ART Analysis—Shows the response times for a transaction.
Step 2
To enable application traffic analysis baselining:
a.
Open the Application Traffic Analysis dashlet, hover your cursor over the dashlet icons and click Dashlet Options.
b.
Check the Baseline check box and save your changes.
Step 3
To enable application response time analysis baselining:
a.
Open the Application ART Analysis dashlet, hover your cursor over the dashlet icons and click Dashlet Options.
b.
Choose a metric from the Metric Type drop-down list.
If you choose the Server Response Time metric, you can select an individual Application Server to see what the response time of that server has been in the past.
c.
Check the Baseline check box and save your changes.
Validating Optimization ROI
After you have deployed your WAAS changes at candidate sites, follow these steps to validate the return on your optimization investment.
Step 1
Choose Operate > Monitoring Dashboards > Detail Dashboards.
Step 2
Click the WAN Optimization tab. The dashlets on this page show:
•
Transaction Time (Client Experience): Graphs average client transaction times (in milliseconds) for the past 24 hours, with separate lines for optimized traffic and pass-through traffic (in which optimization is turned off). With optimization enabled, you should see a drop in the optimized traffic time when compared to the pass-through time.
•
Average Concurrent Connections (Optimized vs Passthru): Graphs the average number of concurrent client and pass through connections over a specified time period.
•
Traffic Volume and Compression Ratio: Graphs the bandwidth reduction ratio between the number of bytes before compression and the number of bytes after compression.
•
Multi-Segment Network Time (Client LAN-WAN - Server LAN): Graphs the network time between the multiple segments.
Step 3
You can filter the data in the dashlets by Time Frame, Client Site, Server Site, and Application.
Step 4
To generate a report:
a.
Choose Tools > Reports > Report Launch Pad, then choose Performance > WAN Application Performance Analysis Summary.
b.
Specify the filter and other settings for the report, then click Run.
Monitoring Optimized Flows
Follow these steps to monitor WAAS-optimized WAN traffic.
Step 1
Choose Operate > Monitoring Dashboards > Detail Dashboards.
Step 2
Click the WAN Optimization tab, open the Multi-Segment Analysis dashlet, then click View Multi-Segment Analysis.
Step 3
Click the Conversations tab to see individual client/server sessions, or the Site to Site tab to see aggregated site traffic. For each client (or client site) and server (or server site) pair and application in use, these pages show:
•
Average and Max Transaction Time: The time between the client request and the final response packet from the server. Transaction time will vary with client uses and application types, as well as with network latency. Transaction Time is a key indicator in monitoring client experiences and detecting application performance problems.
•
Average Client Network Time: The network time between a client and the local switch or router. In WAAS monitoring, Client Network Time from a WAE client data source represents the network RTT between the client and its edge WAE, while Client Network Time from the WAE server data source represents the WAN RTT (between the edge and core WAEs).
•
Average WAN Network Time: The time across the WAN segment (between the edge routers at the client and server locations).
•
Average Server Network Time: The network time between a server and NAM probing point. In WAAS monitoring, Server Network Time from a server data source represents the network time between the server and its core WAE.
•
Average Server Response Time: The average time it takes an application server to respond to a request. This is the time between the client request arriving at the server and the first response packet being returned by the server. Increases in the server response time usually indicate problems with application server resources, such as the CPU, Memory, Disk, or I/O.
•
Traffic Volume: The volume of bytes per second in each of the Client, WAN, and Server segments.
Step 4
Sort and filter the performance data as needed:
•
To sort any column, click the column heading.
•
You can filter the data displayed by Time Frame, Or click the Filter icon and specify a Quick or Advanced Filter, or use a Preset Filter.