-
Cisco IP Solution Center Infrastructure Reference, 4.0
-
Index
-
About This Guide
-
Getting Started
-
WatchDog Commands
-
Service Inventory > Inventory and Connection Manager
-
Service Inventory > Inventory and Connection Manager > Inventory Manager
-
Service Inventory > Device Console
-
Service Design
-
Monitoring
-
Administration
-
Cisco CNS IE2100 Appliances
-
Property Settings
-
Glossary
-
 Feedback
Table Of Contents
Create From Any SA Agent Device(s)
Create From MPLS PE or MVRF-CE
Monitoring
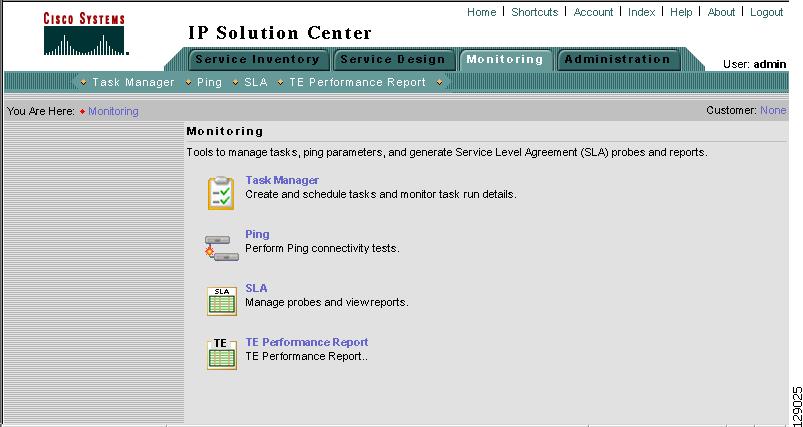
From the Home window of Cisco IP Solution Center (ISC), you receive upon logging in, click the Monitoring tab and you receive a window as shown in Figure 7-1, "Monitoring Selections."
Figure 7-1 Monitoring Selections
Next you can navigate to the following selections:
•
Task Manager Create and schedule tasks and monitor task run details.
•
•
•
Task Manager
ISC provides a Task Manager that allows you to view pertinent information about both current and expired tasks of all types, and to create and schedule new tasks, delete specified tasks, and delete the active and expired tasks.
This section contains the following subsections:
Tasks
Starting Task Manager
To start Task Manager, follow these steps:
Step 1
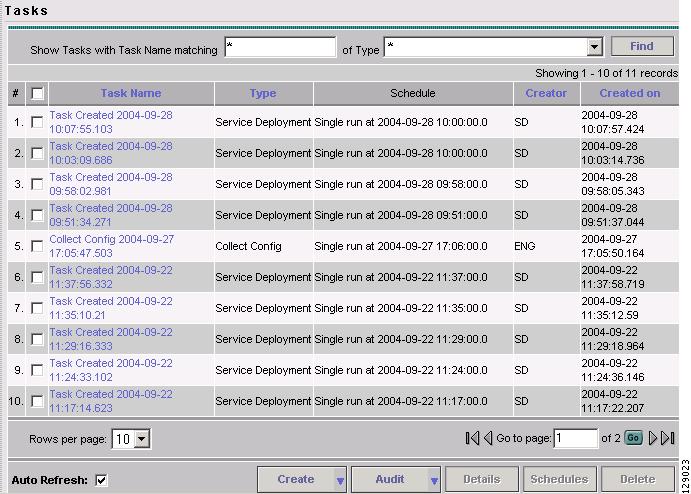
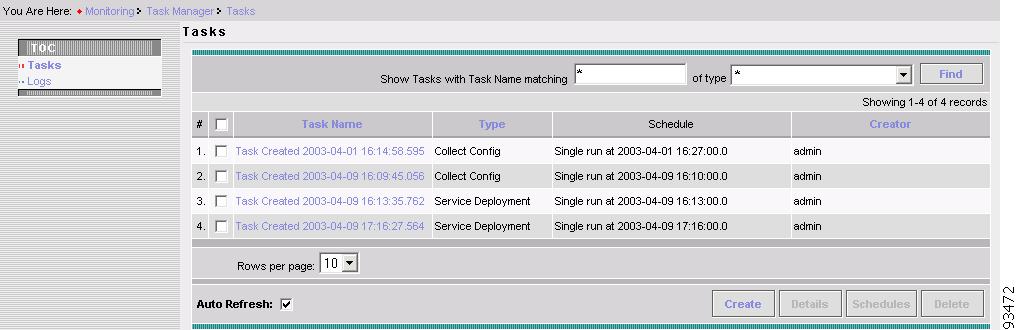
Figure 7-2 Tasks
The Tasks window displays information about each task by Task Name, Type, Schedule date and time, the user name of the Creator who created those tasks, and the date Created on. To view, schedule, or delete the listed tasks, select the corresponding check box.
New Tasks can also be created or audited using this window.
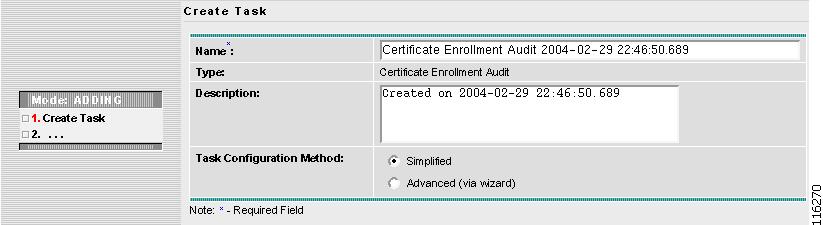
Creating a New Task
To create a new task, follow these steps:
Step 1
•
•
•
•
•
•
Figure 7-3 Create Tasks
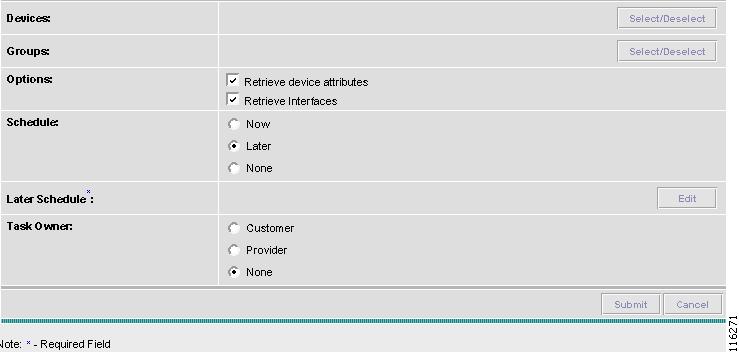
Step 2
Step 3
Step 4
Step 5
Step 6
Figure 7-4 Task Devices
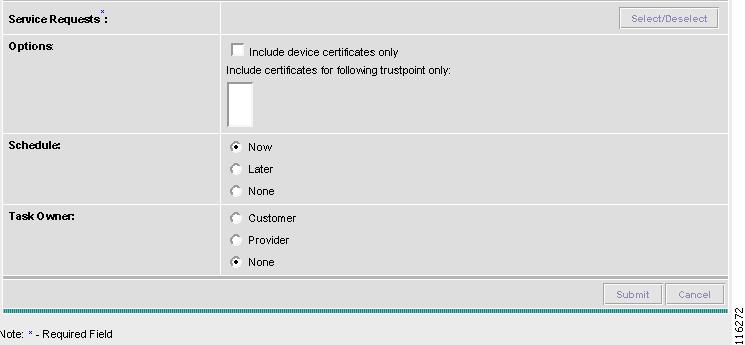
Figure 7-5 Task Service Requests
Step 7
Step 8
Step 9
Step 10
Step 11
Figure 7-6 Task Schedule Details
Step 12
Step 13
Audit
To get audit information, follow these steps:
Step 1
•
•
•
•
•
•
Task Logs
Task Logs can be used to understand the status of a task, whether or not it completed successfully. You can also use the Task Logs to troubleshoot why a task has failed. To view the Task Logs, follow these steps:
Step 1
Figure 7-7 Tasks
Step 2
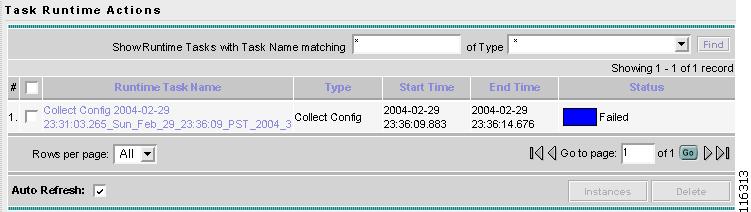
Figure 7-8 Task Runtime Actions
This window displays the task by Runtime Task Name, and the Type, Start Time, End Time and the Status of the task. You can use this window to view or delete the logs.
Step 3
Step 4
Note
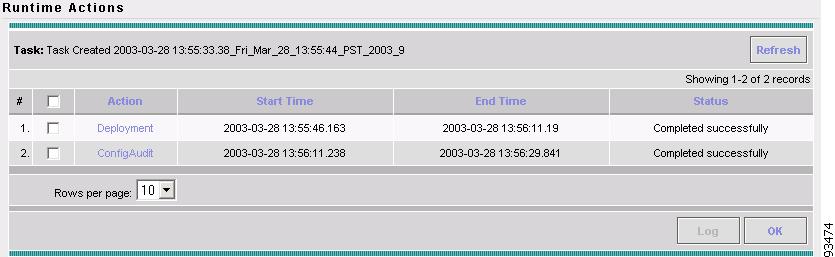
Figure 7-9 Runtime Actions
Step 5
Step 6
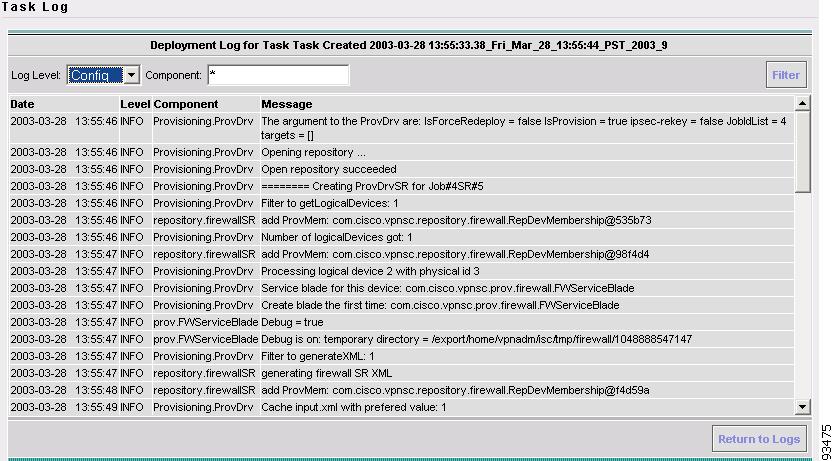
Figure 7-10 Task Log
It is possible to set the types of log level you want to view. Specify the Log Level and click on the Filter button to view that information you want to view.
Step 7
Ping
Ping is the way ISC monitors the VPN connectivity, that is verify the connectivity among various edge devices comprising the VPN. To achieve this, you can perform a series of pings among these devices. Ping has the following benefits:
•
•
•
•
However, Ping does not do the following:
•
•
•
The Ping GUI supports all possible pings for MPLS service requests.
This section explains how to ping MPLS service requests.
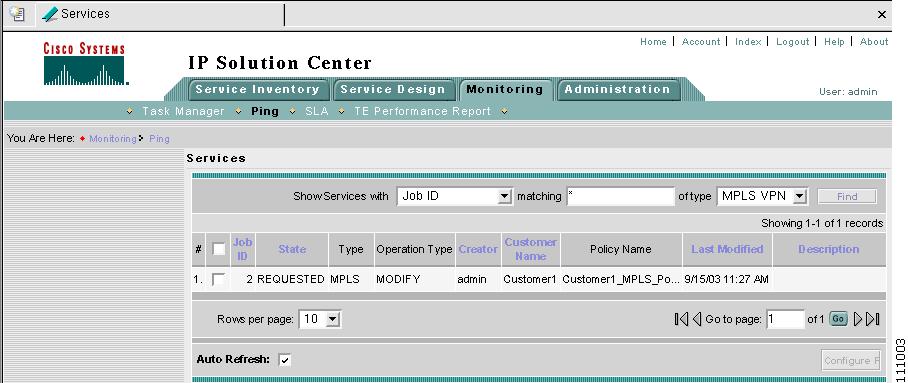
After you navigate Monitoring > Ping, you receive a window as shown in.Figure 7-11, "Services."
Figure 7-11 Services
From here you can use the Show Services with drop-down menu to select:
•
•
•
•
•
Then for matching, enter the beginning characters of the names you want to match followed by *.
Then before clicking Find, from of type select MPLS or IPsec (This feature is NOT SUPPORTED in this release). -and proceed as follows:
•
•
Note
Note
MPLS
After you navigate Monitoring > Ping and select MPLS as the type, follow these steps:
Step 1
Step 2
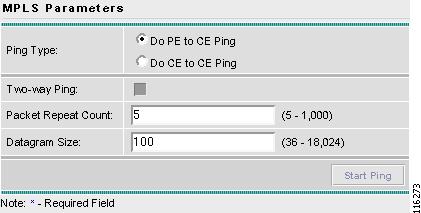
Figure 7-12 MPLS Parameters
Fill in the following and then click Start Ping:
•
•
•
•
•
Step 3
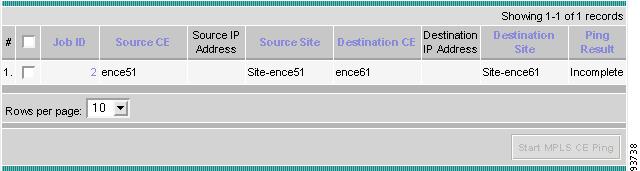
Figure 7-13 MPLS CE Selection
Step 4
Step 5
Step 6
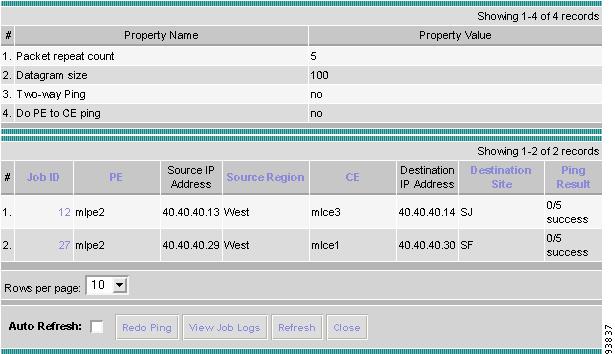
Figure 7-14 MPLS Ping Test Results
Step 7
•
•
•
•
•
Note
Step 8
IPsec
- This feature is NOT SUPPORTED in this release. -
After you navigate Monitoring > Ping and select IPsec as the type, follow these steps:
Step 1
Step 2
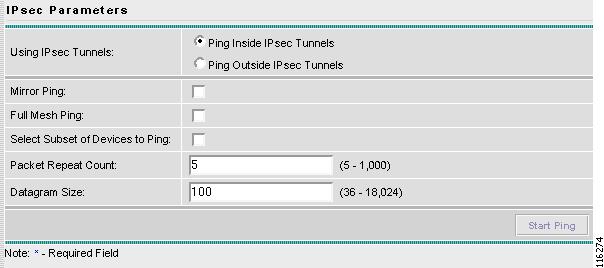
Figure 7-15 IPsec Parameters
Fill in the following and then click Start Ping. If you select Select subset of devices to ping, you proceed to Step 3. If not, you proceed to Step 6.
•
•
•
•
Note
•
•
Step 3
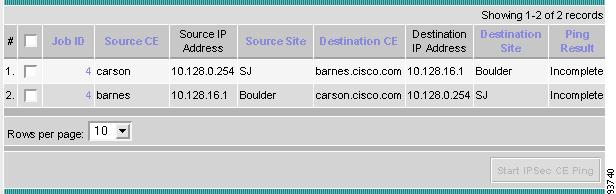
Figure 7-16 IPsec CE Selection
Step 4
Step 5
Step 6
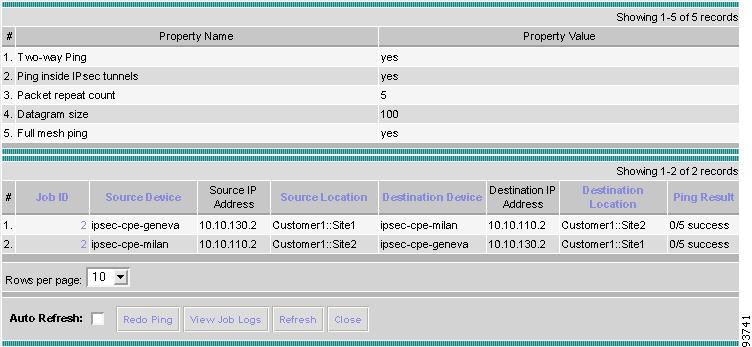
Figure 7-17 IPsec Ping Test Results
Step 7
•
•
•
•
•
Note
Step 8
SLA
A service-level agreement (SLA) defines a level of service provided by a service provider to any customer. Performance is monitored through the SLA server. ISC monitors the service-related performance criteria by provisioning, collecting, and monitoring SLAs on Cisco IOS routers that support the Service Assurance Agent (SA Agent) devices. To provision the SLAs and to collect statistics for each SLA, the data collection task requires minimal user input.
The SLA collection task collects the relevant performance data, stores it persistently, aggregates it, and presents useful reports. The SLA collection task collects from the SA Agent MIB on devices. ISC leverages the SA Agent MIB to monitor SLA performance on a 24 x 7 basis. Using the MIB, you can monitor network traffic for the popular protocols: Dynamic Host Configuration Protocol (DHCP), Domain Name System (DNS), File Transfer Protocol (FTP), Hyper text Transfer Protocol (HTTP), Internet Control Message Protocol Echo (ICMP Echo), Jitter (voice jitter), Transmission Control Protocol Connect (TCP Connect), and User Datagram Protocol Echo (UDP Echo).
Note
Note
This section explains how to configure SLA probes, collect SLA data, and view SLA reports about these SLA probes.
Before you navigate Monitoring > SLA, implement the setup procedures in the "Setup Prior to Using SLA" section."
Then navigate Monitoring > SLA and you can select one of the following:
•
Setup Prior to Using SLA
SLA is an SNMP activity. Be sure SNMP is enabled and the SNMP settings on the router match the settings in the repository.
When creating an SLA From MPLS CPE, From MPLS PE, or From IPsec CPE (This feature is NOT SUPPORTED in this release.), the service requests associated with the devices must be in the Deployed state.
Probes
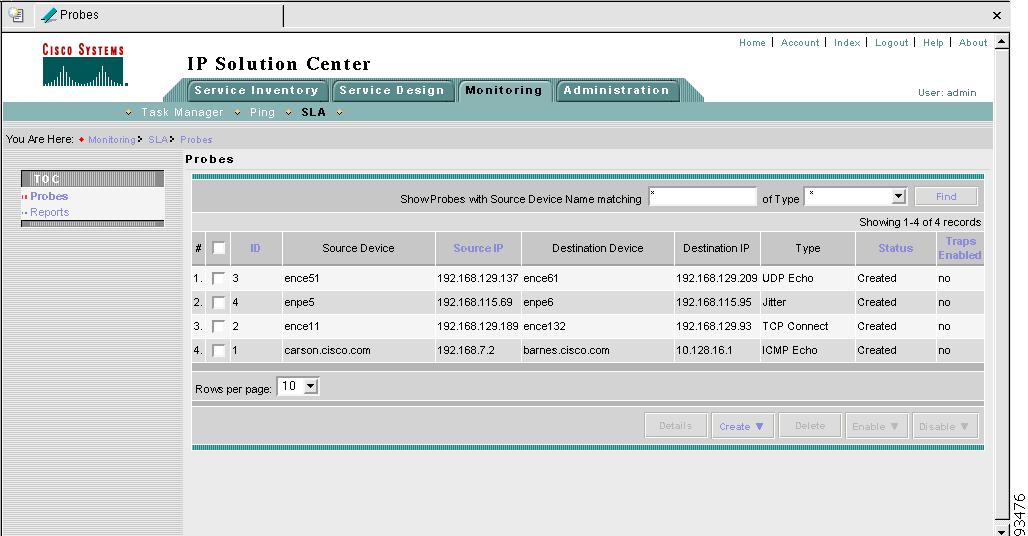
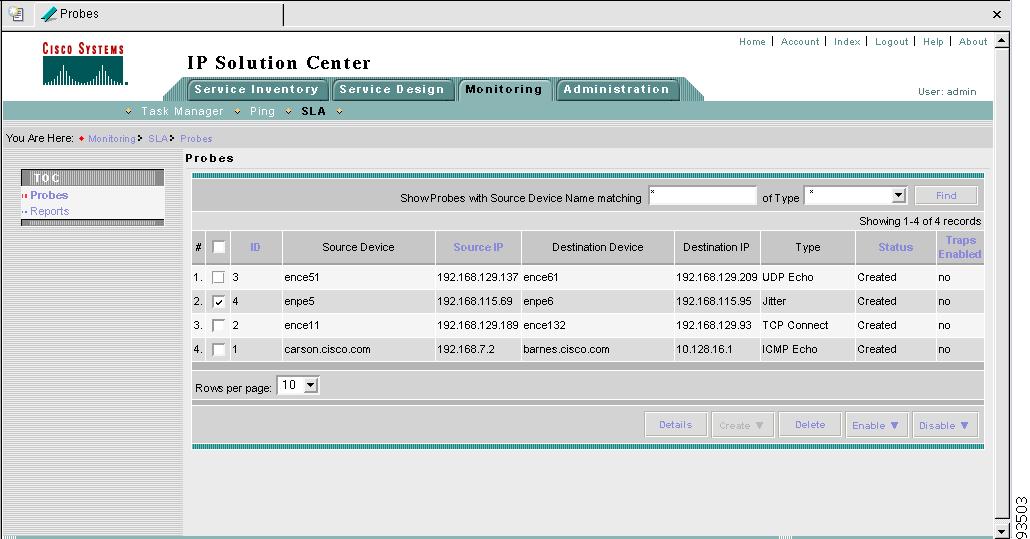
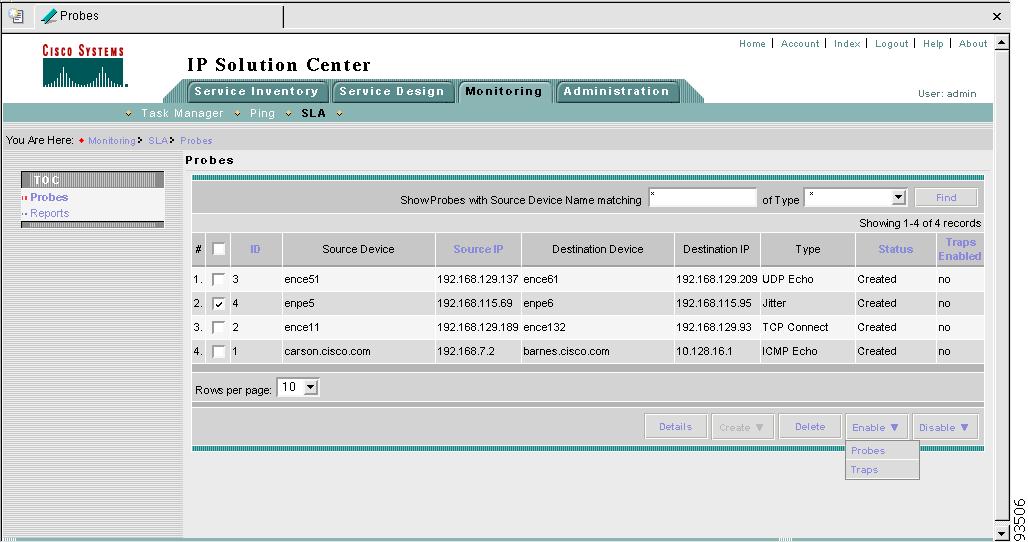
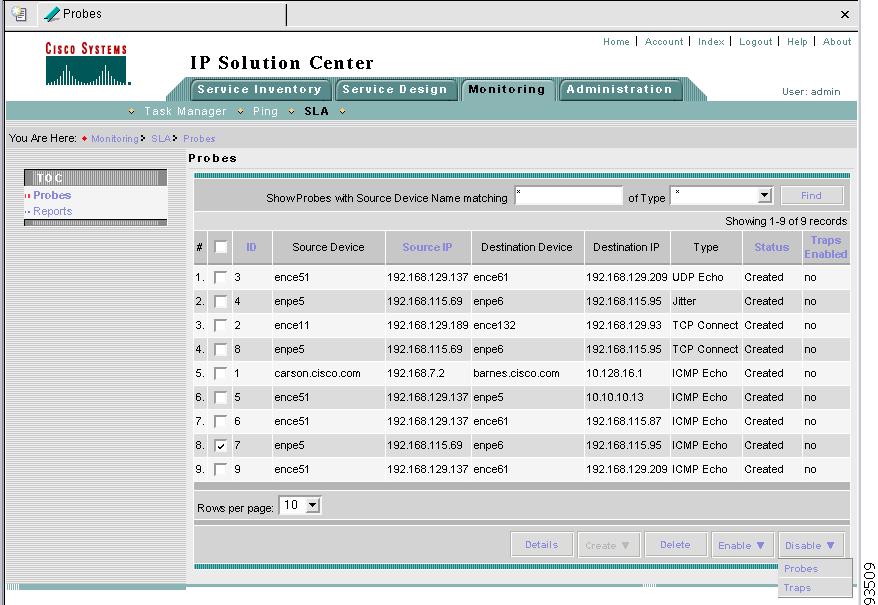
When you navigate Monitoring > SLA > Probes, you receive a window as shown in Figure 7-18, "SLA Probes."
Figure 7-18 SLA Probes
The default button that is enabled is Create and from the Create drop-down menu, you can choose to create SLA probes From Any SA Agent Device(s); From MPLS CPE; From MPLS PE; or From IPsec CPE (This feature is NOT SUPPORTED in this release.). However, if you select one or more existing probes by clicking the row(s) of existing probe(s), to select the specific probe(s), or you click the box in the header row, to select all the probes, then you have access to the other buttons, Details, Delete, Enable, and Disable. For Enable and Disable, the drop-down menu contains options to enable or disable SLA Probes and SLA Traps.
At the top of this window, for Show Probes with Source Device Name matching you can enter the beginning characters of the names you want to match followed by *; then for of Type, you can keep the default of *, which searches for all the protocol types, or you can select the drop-down menu to select a specific protocol type; and then click Find.
At the bottom of the window, you can change the number of rows shown on this window in Rows per page. Click the drop-down menu and you can select 5, 10, 20, 30, 40, or All.
The explanations of the buttons and subsequent drop-down menus is given as follows:
•
•
•
•
•
•
•
•
•
•
•
Create From Any SA Agent Device(s)
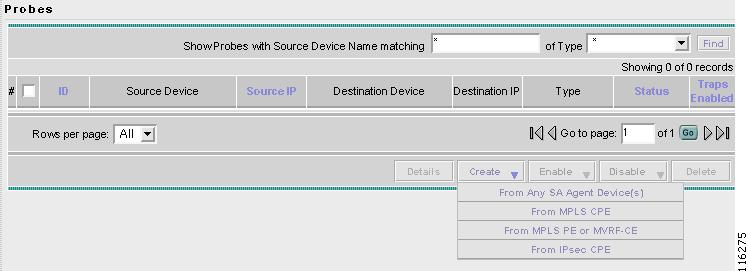
When you navigate Monitoring > SLA > Probes, the default is the Probes page with only the Create button enabled. From the Create drop-down menu, you can select From Any SA Agent Device(s), as shown in Figure 7-19, "SLA Probes > Create > From Any SA Agent Device(s)."
Note
Figure 7-19 SLA Probes > Create > From Any SA Agent Device(s)
You then proceed through the following steps:
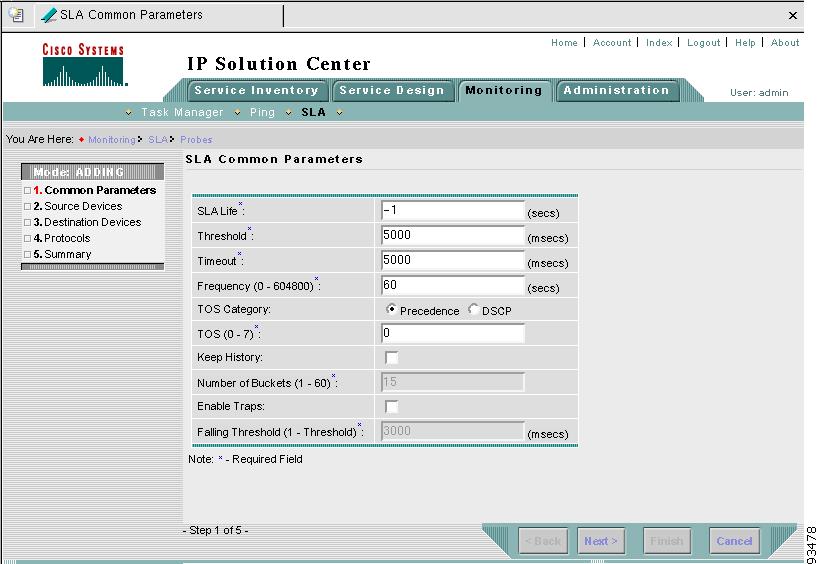
Step 1
Figure 7-20 SLA Common Parameters
Accept the defaults or change the information in the fields of the common SLA parameters, as follows, and then click Next:
•
•
•
•
•
•
–
Note
–
Note
•
•
•
•
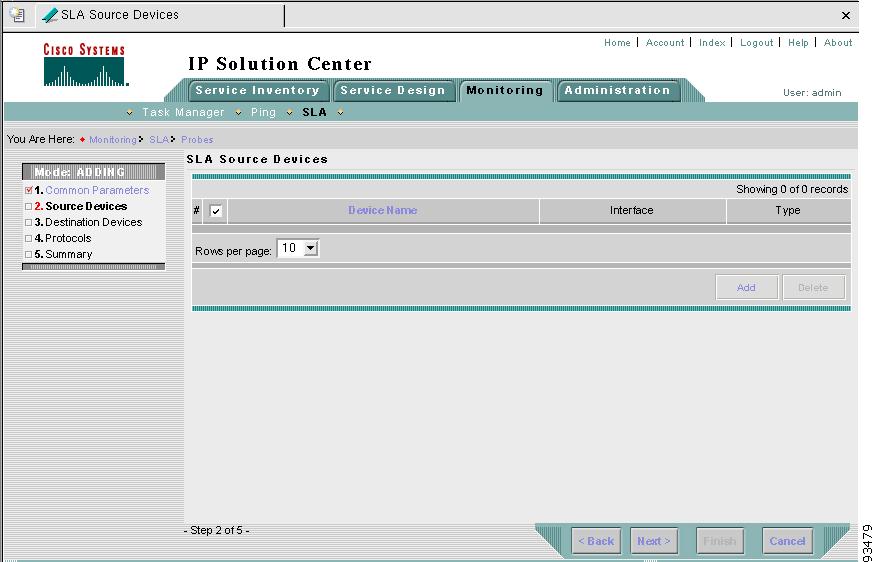
Step 2
Figure 7-21 SLA Source Devices
Step 3
Note
Figure 7-22 SLA Devices > Add
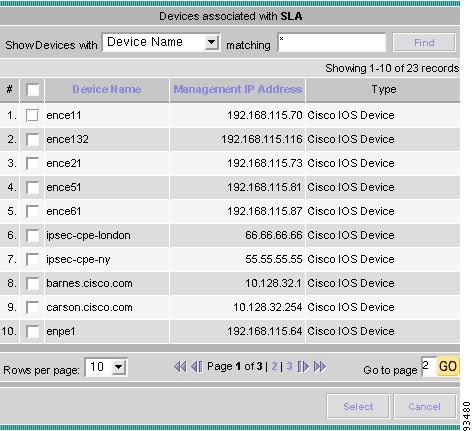
Step 4
•
•
•
Step 5
Note
Step 6
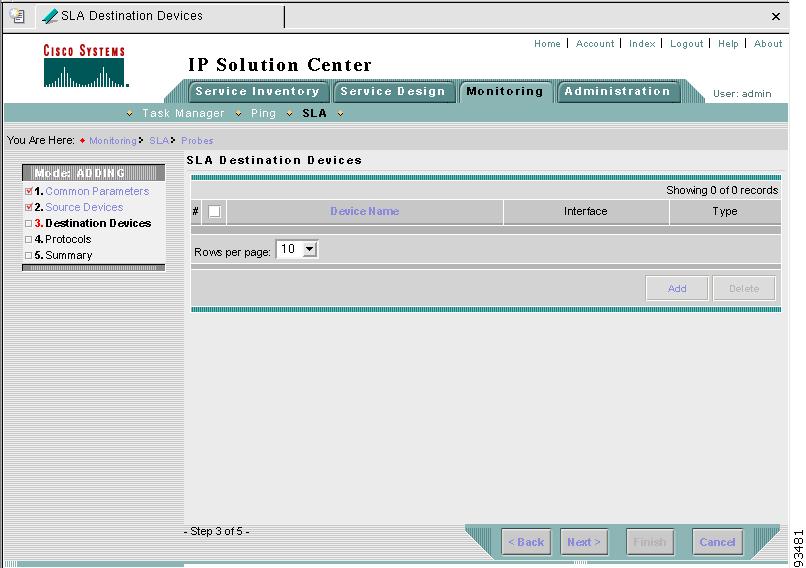
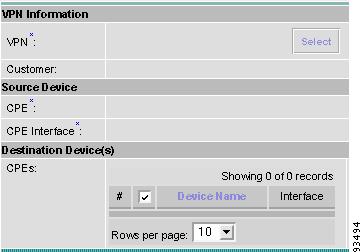
Figure 7-23 SLA Destination Devices
Step 7
Note
Step 8
•
•
•
Step 9
Note
Step 10
Create from MPLS CPE
When you navigate Monitoring > SLA > Probes and select no probe, you have access to the Create button. From the Create drop-down menu, you can select From MPLS CPE, as shown in Figure 7-24, "SLA Probes > Create > From MPLS CPE."
Figure 7-24 SLA Probes > Create > From MPLS CPE
You then proceed through the following steps:
Step 1
Figure 7-25 SLA Common Parameters
Accept the defaults or change the information in the fields of the common SLA parameters, as follows, and then click Next:
•
•
•
•
•
•
–
Note
–
Note
•
•
•
•
Step 2
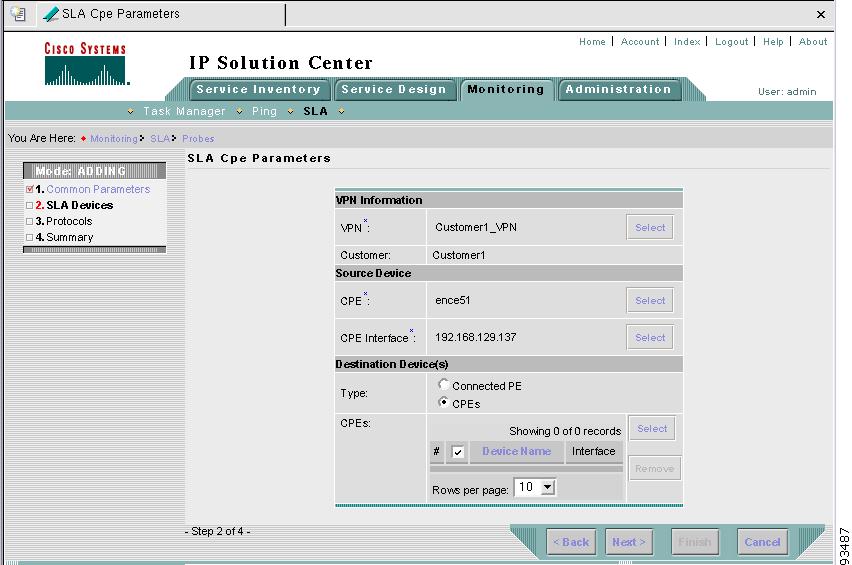
Figure 7-26 SLA CPE Parameters
Step 3
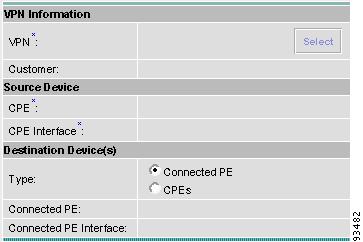
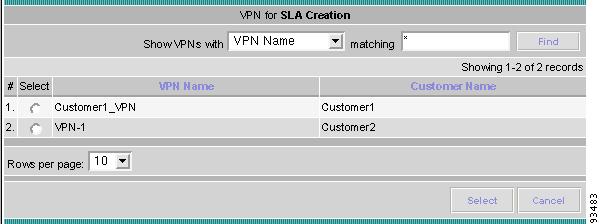
Figure 7-27 Select VPN
At the top of this window you can select the drop-down menu for Show VPNs with and select VPN Name or Customer Name; then for matching, enter the beginning characters of the names you want to match followed by *; and then click Find. Click the box next to each row for the VPN you want to select. Then click Select.
Note
Step 4
Step 5
Note
Figure 7-28 Select CPE
Step 6
Step 7
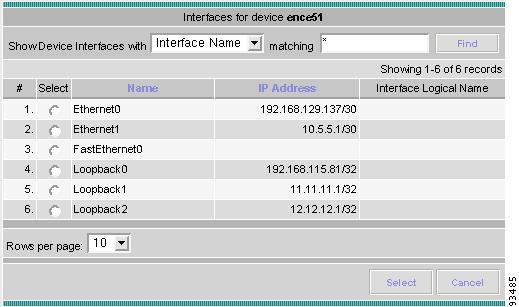
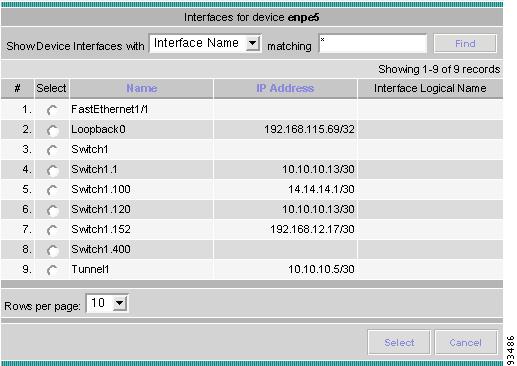
Figure 7-29 Interfaces
At the top of this window you can select the drop-down menu for Show Device Interfaces with and select Interface Name or IP Address; then for matching, enter the beginning characters of the names you want to match followed by *; and then click Find. Click the box next to the row for the VPN you want to select. Then click Select.
Note
Step 8
Step 9
Step 10
Figure 7-30 Connected PE Interface
At the top of this window you can select the drop-down menu for Show Device Interfaces with and select Interface Name or IP Address; then for matching, enter the beginning characters of the names you want to match followed by *; and then click Find. Click the box next to the row for the Name you want to select. Then click Select.
Note
Step 11
Step 12
Step 13
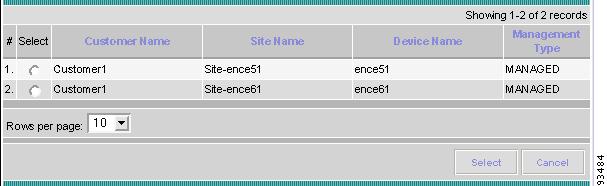
Figure 7-31 CPEs
Step 14
Figure 7-32 Select CPE Associated with the Specified VPN
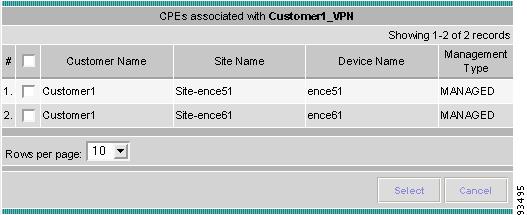
Select the check box next to the row(s) for the CPE(s) you want to select or the check box in the header row to select all the listed CPEs. Then click Select.
Note
Note
Step 15
Step 16
At the top of this window you can select the drop-down menu for Show Device Interfaces with and select Interface Name or IP Address; then for matching, enter the beginning characters of the names you want to match followed by *; and then click Find. Click the box next to the row for the CPE you want to select. Then click Select.
Note
Step 17
Step 18
Step 19
Create From MPLS PE or MVRF-CE
When you navigate Monitoring > SLA > Probes and select no probe, you have access to the Create button. From the Create drop-down menu, you can select From MPLS PE or MVRF-CE, as shown in Figure 7-33, "SLA Probes > Create > From MPLS PE or MVRF-CE."
Figure 7-33 SLA Probes > Create > From MPLS PE or MVRF-CE
You then proceed through the following steps:
Step 1
Figure 7-34 SLA Common Parameters
Accept the defaults or change the information in the fields of the common SLA parameters, as follows, and then click Next:
•
•
•
•
•
•
–
Note
–
Note
•
•
•
•
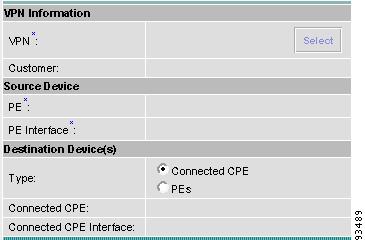
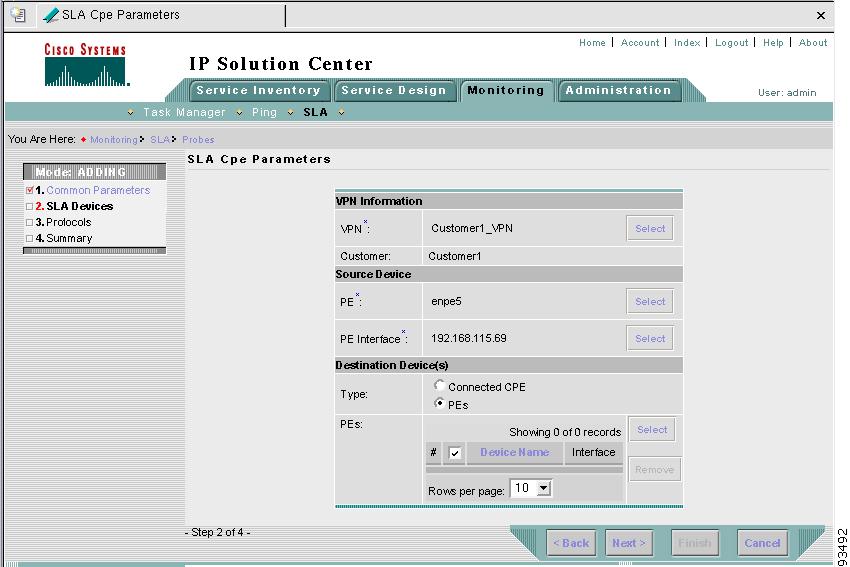
Step 2
Figure 7-35 SLA CPE Parameters
Step 3
Note
Figure 7-36 Select VPN
Step 4
Step 5
Note
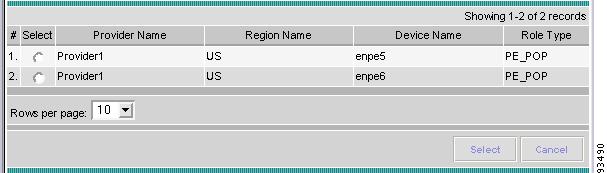
Figure 7-37 Select PE
Step 6
Step 7
Note
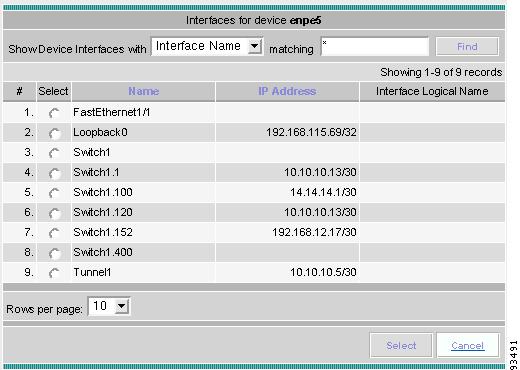
Figure 7-38 Select Device Interface
Step 8
Step 9
Step 10
Figure 7-39 Connected PE Interface
At the top of this window you can select the drop-down menu for Show Device Interfaces with and select Interface Name or IP Address; then for matching, enter the beginning characters of the names you want to match followed by *; and then click Find. Click the box next to the row for the VPN you want to select. Then click Select.
Note
Step 11
Step 12
Step 13
Figure 7-40 PEs
Step 14
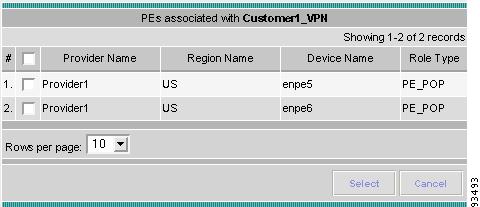
Figure 7-41 Select PE Associated with the Specified VPN
Select the check box(es) next to the row(s) for the PE you want to select or the check box in the header row to select all the listed PEs. Then click Select.
Note
Note
Step 15
Step 16
At the top of this window you can select the drop-down menu for Show Device Interfaces with and select Interface Name or IP Address; then for matching, enter the beginning characters of the names you want to match followed by *; and then click Find. Click the box next to the row for the VPN you want to select. Then click Select.
Note
Step 17
Step 18
Step 19
Create from IPsec CPE
- This feature is NOT SUPPORTED in this release. -
When you navigate Monitoring > SLA > Probes and select no probe, you have access to the Create button. From the Create drop-down menu, you can select From IPsec CPE, as shown in Figure 7-42, "SLA Probes > Create > From IPsec CPE."
Figure 7-42 SLA Probes > Create > From IPsec CPE
You then proceed through the following steps:
Step 1
Figure 7-43 SLA Common Parameters
Accept the defaults or change the information in the fields of the common SLA parameters, as follows, and then click Next:
•
•
•
•
•
•
–
Note
–
Note
•
•
•
•
Step 2
Figure 7-44 SLA CPE Parameters
Step 3
Note
Figure 7-45 Select VPN
Step 4
Step 5
Note
Figure 7-46 Select CPE
Step 6
Step 7
Step 8
Figure 7-47 Select CPE Associated with the Specified VPN
Select the check box(es) next to the row(s) for the CPE you want to select or select the check box in the header row to select all the listed CPEs. Then click Select.
Note
Note
Step 9
Step 10
At the top of this window you can select the drop-down menu for Show Device Interfaces with and select Interface Name or IP Address; then for matching, enter the beginning characters of the names you want to match followed by *; and then click Find. Click the box next to the row for the VPN you want to select. Then click Select.
Note
Step 11
Step 12
Step 13
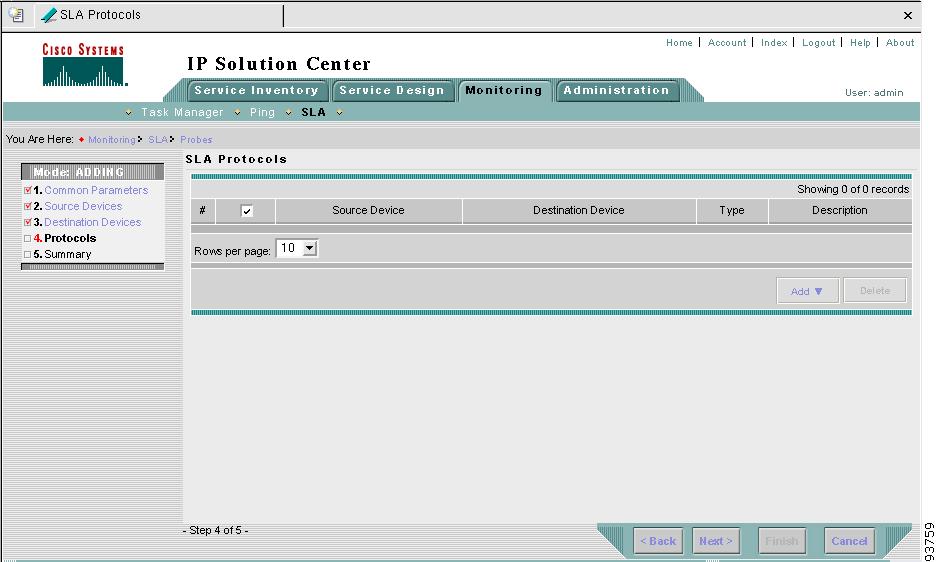
Protocols
You navigate to this location after you have completed all the steps in one of the Create functions: Create From Any SA Agent Device(s); Create from MPLS CPE; Create From MPLS PE or MVRF-CE; or Create from IPsec CPE. Follow these steps:
Step 1
Figure 7-48 Protocols
Step 2
•
•
•
•
•
•
•
•
Step 3
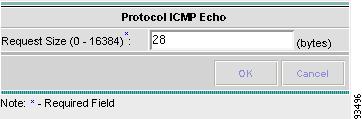
Figure 7-49 Protocol ICMP Echo
Enter the required information as follows, click OK, and then proceed to Step 11.
•
Step 4
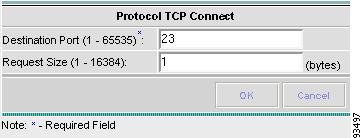
Figure 7-50 Protocol TCP Connect
Enter the required and optional information as follows, click OK, and then proceed to Step 11.
•
•
Step 5
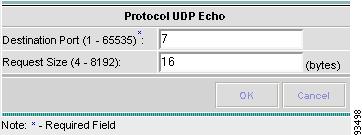
Figure 7-51 Protocol UDP Echo
Enter the required and optional information as follows, click OK, and then proceed to Step 11.
•
•
Step 6
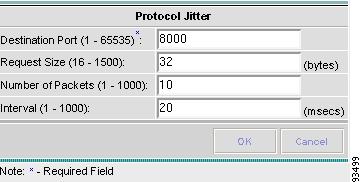
Figure 7-52 Protocol Jitter
Enter the required and optional information as follows, click OK, and then proceed to Step 11.
•
•
•
•
Step 7
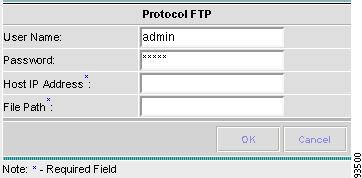
Figure 7-53 Protocol FTP
Enter the required and optional information as follows, click OK, and then proceed to Step 11.
•
•
•
•
Step 8
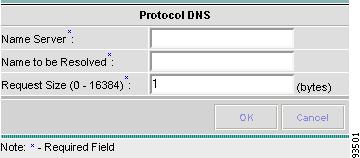
Figure 7-54 Protocol DNS
Enter the required information as follows, click OK, and then proceed to Step 11.
•
•
•
Step 9
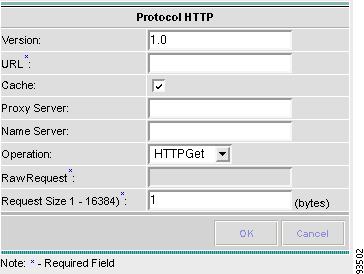
Figure 7-55 Protocol HTTP
Enter the optional and required information as follows, click OK, and then proceed to Step 11.
•
•
•
•
•
•
•
•
Step 10
Step 11
Note
Step 12
Details
When you navigate Monitoring > SLA > Probes, you can get details by following these steps:
Step 1
Figure 7-56 SLA Probes > Details
Step 2
Figure 7-57 SLA Probes Details
Step 3
Delete
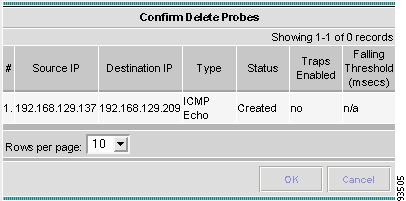
When you navigate Monitoring > SLA > Probes, you can delete probes from the list by following these steps:
Step 1
Figure 7-58 SLA Probes > Delete
Step 2
Figure 7-59 Confirm Delete Probes
Step 3
Note
Note
Step 4
Enable Probes
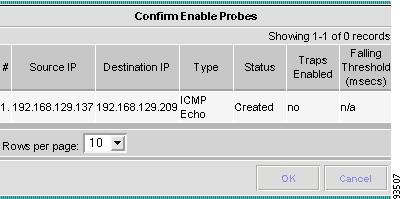
When you navigate Monitoring > SLA > Probes, you can enable probes by following these steps:
Step 1
Figure 7-60 SLA Probes > Enable > Probes
Step 2
Figure 7-61 Confirm Enable Probes
Step 3
Note
Step 4
Enable Traps
When you navigate Monitoring > SLA > Probes, you can enable traps by following these steps:
Step 1
Figure 7-62 SLA Probes > Enable > Traps
Step 2
Figure 7-63 Confirm Enable Traps
Step 3
Note
Step 4
Disable Probes
When you navigate Monitoring > SLA > Probes, you can use Disable Probes to delete probes on the devices. Follow these steps:
Step 1
Figure 7-64 SLA Probes > Disable > Probes
Step 2
Figure 7-65 Confirm Disable Probes
Step 3
Note
Step 4
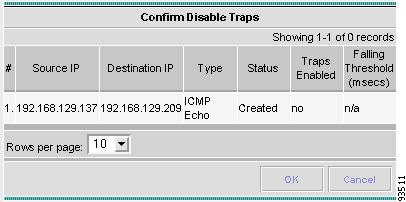
Disable Traps
When you navigate Monitoring > SLA > Probes, you can disable traps by following these steps:
Step 1
Figure 7-66 SLA Probes > Disable > Traps
Step 2
Figure 7-67 Confirm Disable Traps
Step 3
Note
Step 4
Reports
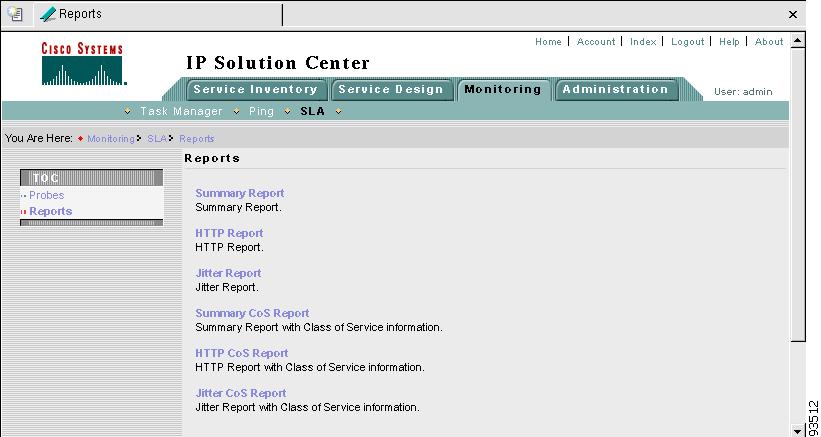
When you navigate Monitoring > SLA > Reports, you receive a window as shown in Figure 7-68, "SLA Reports."
Figure 7-68 SLA Reports
You can then click on any of the following choices and receive that report
•
•
•
•
•
•
Summary Report
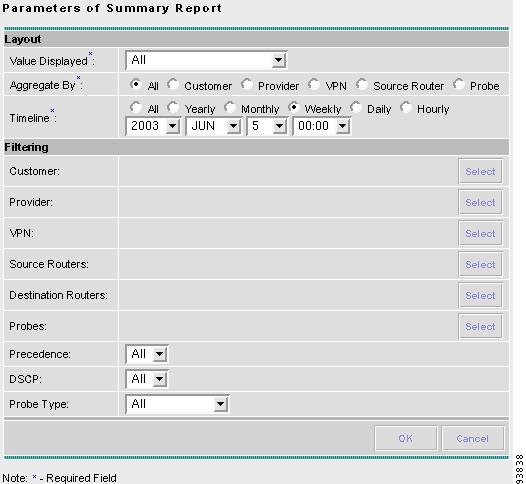
From Figure 7-68, select Summary Report and proceed as follows:
Step 1
Figure 7-69 Parameters of Summary Report
Step 2
•
–
–
–
–
–
–
–
–
•
•
Step 3
Note
•
•
•
•
•
•
•
Note
Note
•
Note
Note
•
Note
Step 4
Step 5
Note
HTTP Report
From Figure 7-68, select HTTP Report and proceed similarly to the "Summary Report" section, with the following exceptions:
•
•
•
Jitter Report
From Figure 7-68, select Jitter Report and proceed exactly as in the "Summary Report" section, with only two exceptions. There is no Destination Routers selection and there is no Probe Type drop-down menu in the equivalent of Figure 7-69, because the probe type is automatically Jitter. The result is a Jitter Report.
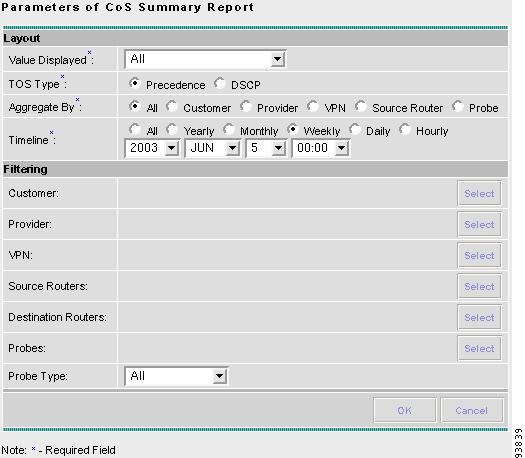
Summary CoS Report
From Figure 7-68, select Summary CoS Report for a summary of the Class of Service (CoS) reports, which are based on the TOS values of the SLA probes, and proceed as follows:
Step 1
Figure 7-70 Parameters of CoS Summary Report
Step 2
Step 3
Step 4
Step 5
Note
HTTP CoS Report
From Figure 7-68, select HTTP Report and proceed exactly as in the "Summary CoS Report" section, with only two exceptions. There is no Destination Routers selection and there is no Probe Type drop-down menu in the equivalent of Figure 7-70, because the probe type is automatically HTTP. The result is an HTTP CoS Report. This CoS report is based on the TOS values of the SLA probes.
Jitter CoS Report
From Figure 7-68, select Jitter Report and proceed exactly as in the "Summary CoS Report" section, with only two exceptions. There is no Destination Routers selection and there is no Probe Type drop-down menu in the equivalent of Figure 7-70, because the probe type is automatically Jitter. The result is a Jitter CoS Report. This CoS report is based on the TOS values of the SLA probes.
TEM Performance Report
TEM Performance Report for Traffic Engineering Management is explained in detail in Cisco IP Solution Center Traffic Engineering Management User Guide, 4.0.