Feedback
Table Of Contents
Monitoring with the Multicast Manager Tool
Viewing the Multicast Manager Home Page
Monitoring with the Multicast Manager Tool
This chapter covers:
•
Viewing the Multicast Manager Home Page
Viewing the Multicast Manager Home Page
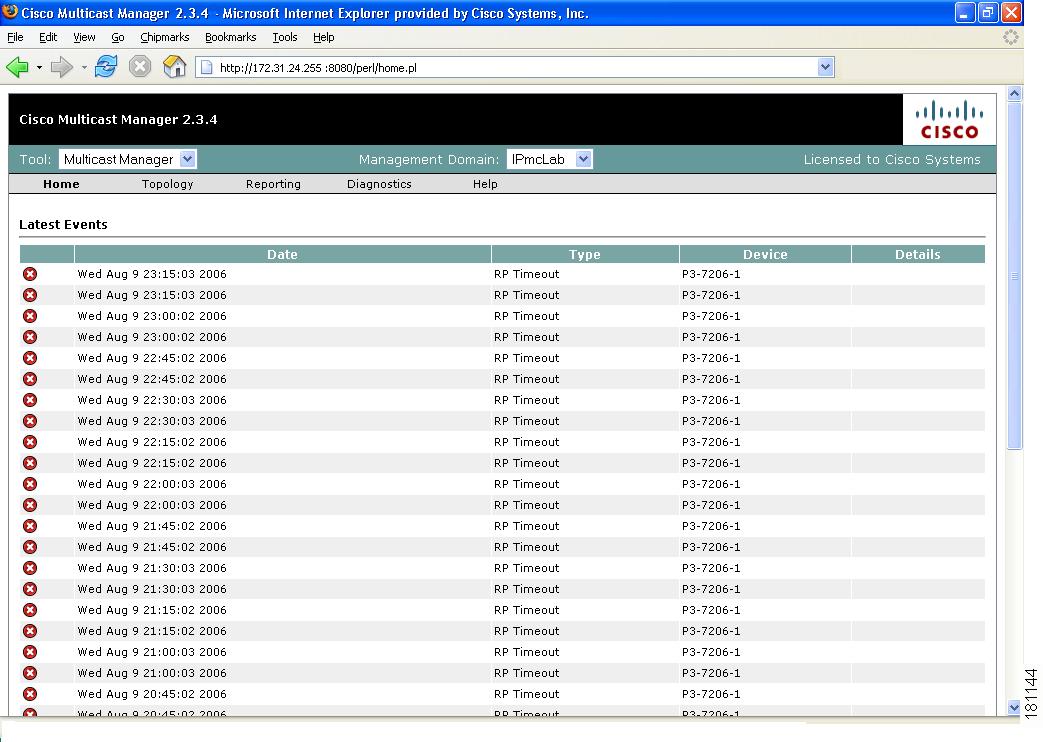
When you log into the CMM, the Multicast Manager Home Page opens. To access this page from within the CMM, select the Multicast Manager tool, then select Home.
The Home page shows the last 20 events (see the "Latest Events" section).
Figure 3-1 Multicast Manager Home Page
Viewing Topology
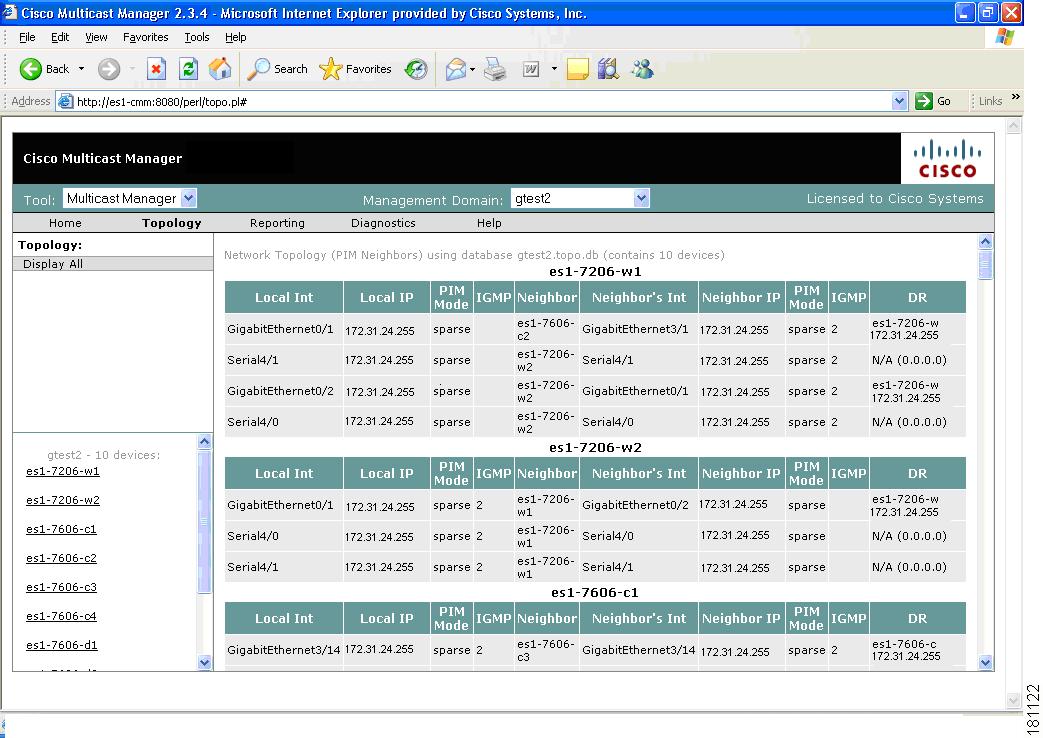
Using Topology, you can display routers and their multicast information in the database, on an individual basis, or by showing the complete database.
To see the complete database, select Display All. Router names appear at the top of each table.
Figure 3-2 Topology Display All
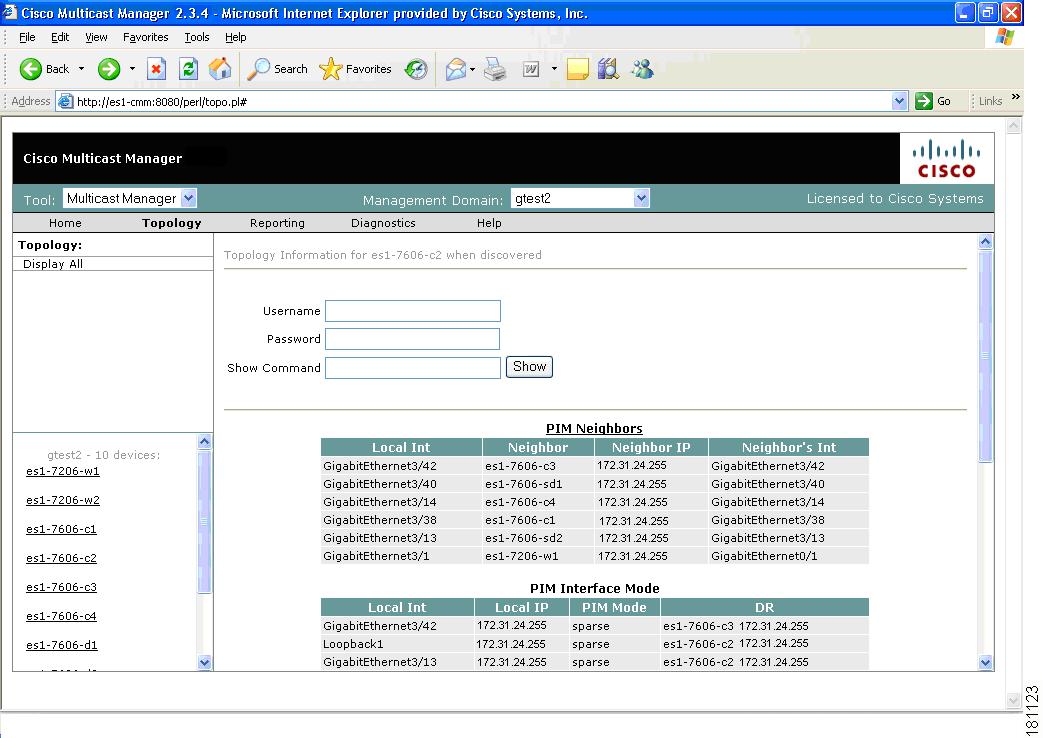
To see topology for an individual router, click a router from the list pane at lower left.
Figure 3-3 Topology for an Individual Router
Note
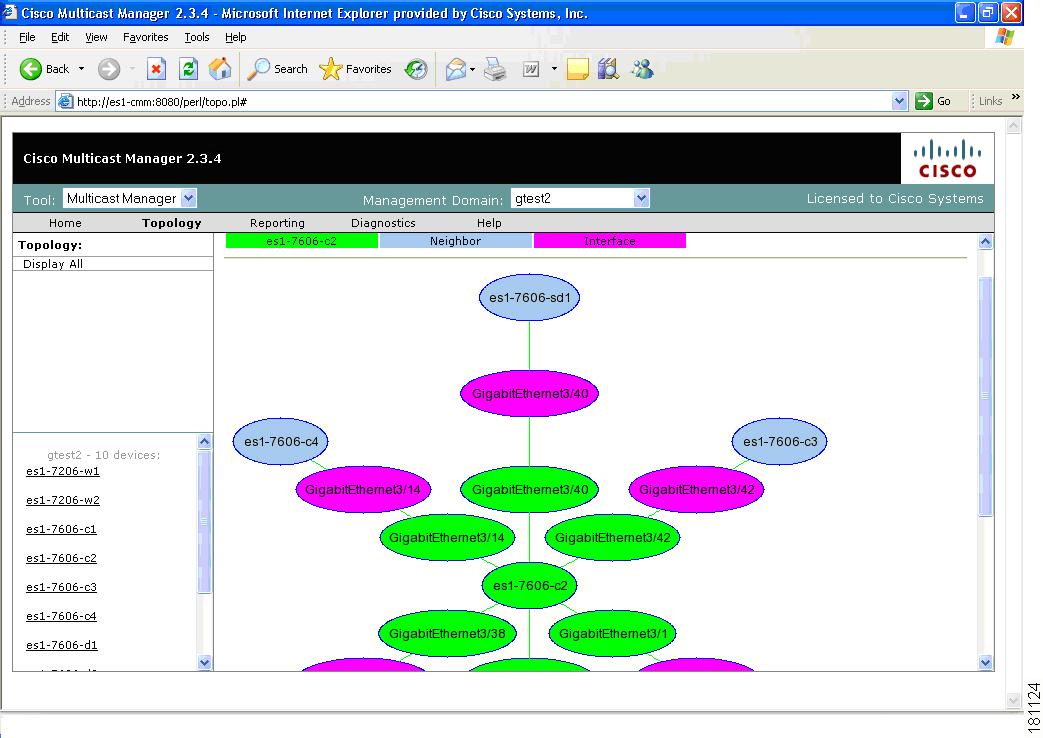
To see a topological display of the routers, select PIM Neighbors.
Figure 3-4 PIM Neighbors
On the PIM Neighbors page:
•
•
•
Managing Reports
To start managing reports, within the Multicast Manager tool, click on Reporting.
Within Reporting, you can view:
•
•
•
Note
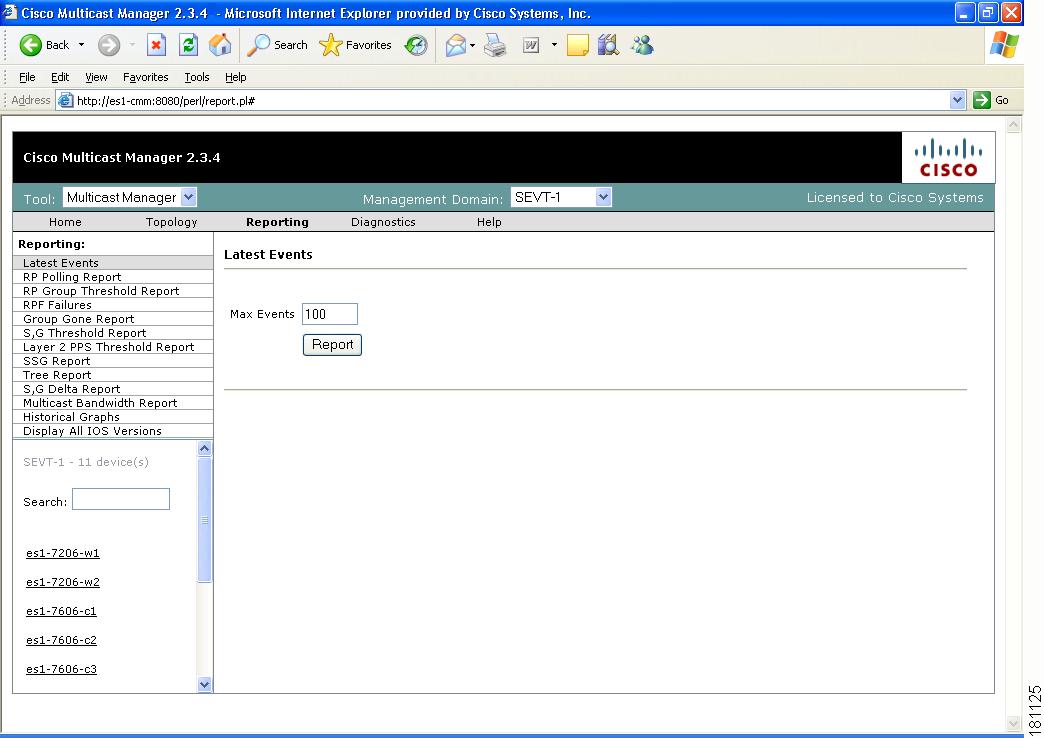
Latest Events
Using the Latest Events page, you can set a configurable amount of the latest events generated by the CMM. Clicking Report lists the traps in time order.
Figure 3-5 Latest Events
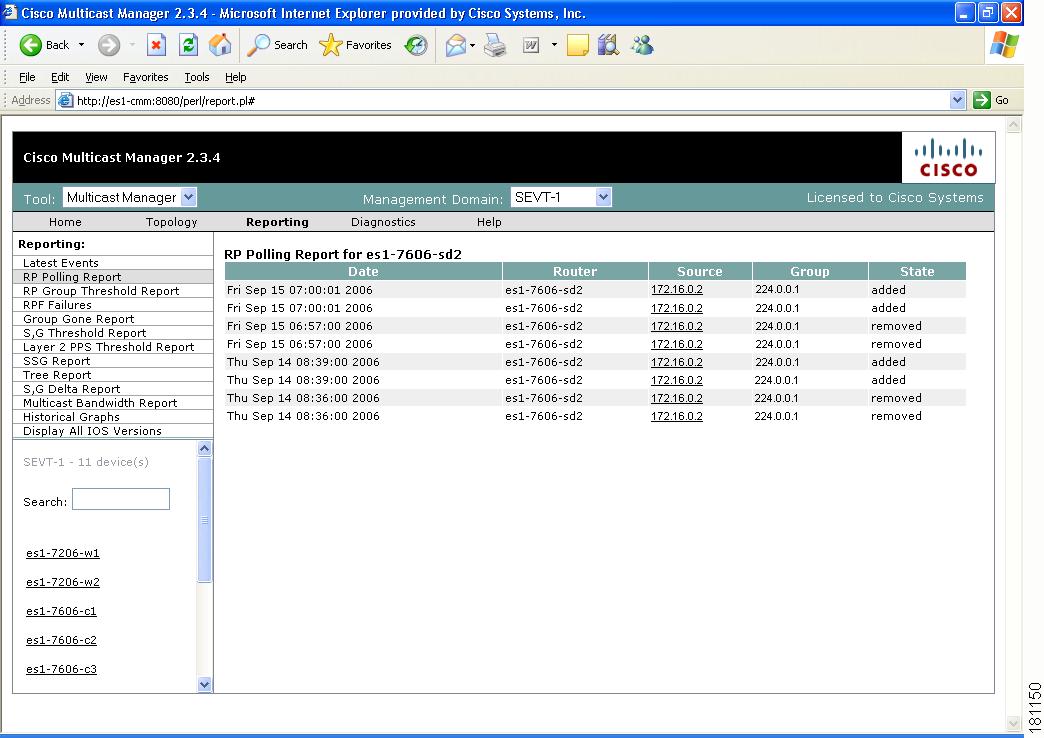
RP Polling Report
Using the RP Polling Report, you can monitor:
•
•
•
To generate an RP Polling report:
Step 1
Step 2
Step 3
Figure 3-6 RP Polling Report
RP Group Threshold Report
Using the RP Group Threshold Report, you can monitor a list of RPs that have exceeded their active number of groups limit.
To generate an RP Group Threshold report:
Step 1
Step 2
Step 3
Figure 3-7 RP Group Threshold Polling Report
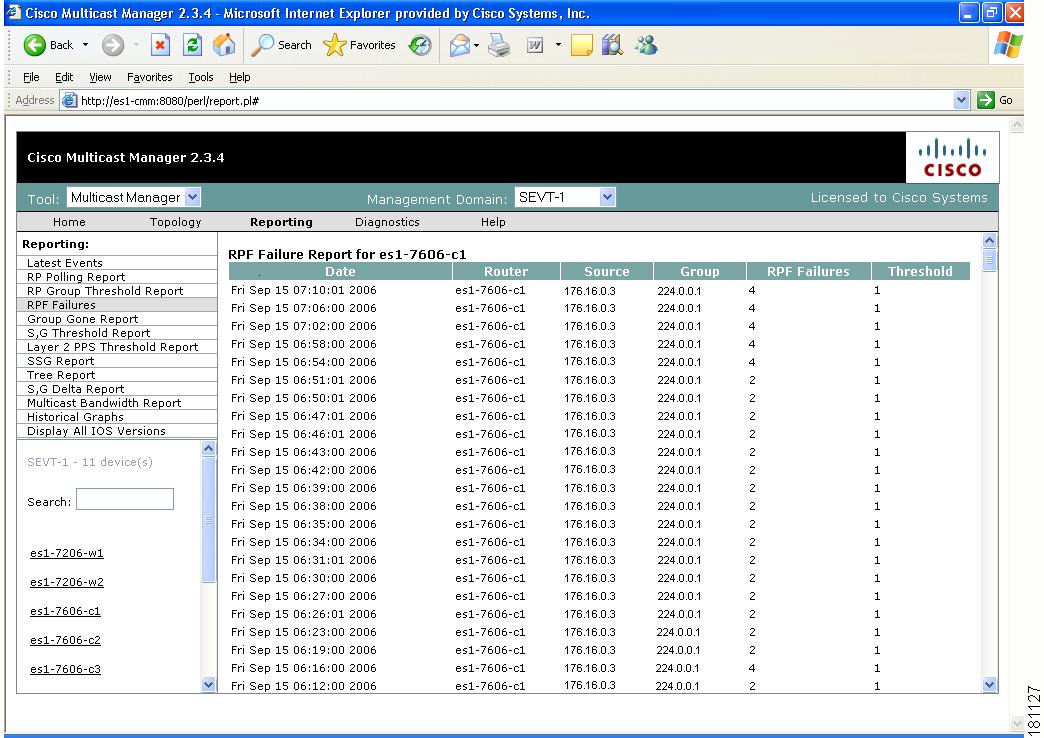
RPF Failures
Using the RPF Failures Report, you can monitor all routers that are experiencing RPF failures above the configured threshold for the configured sources and groups.
To generate an RPF Failures report:
Step 1
Step 2
Step 3
Figure 3-8 RPF Failures Report
Group Gone Report
The Group Gone Report is currently unsupported. Functionality in this page has moved to the S,G Polling Report.
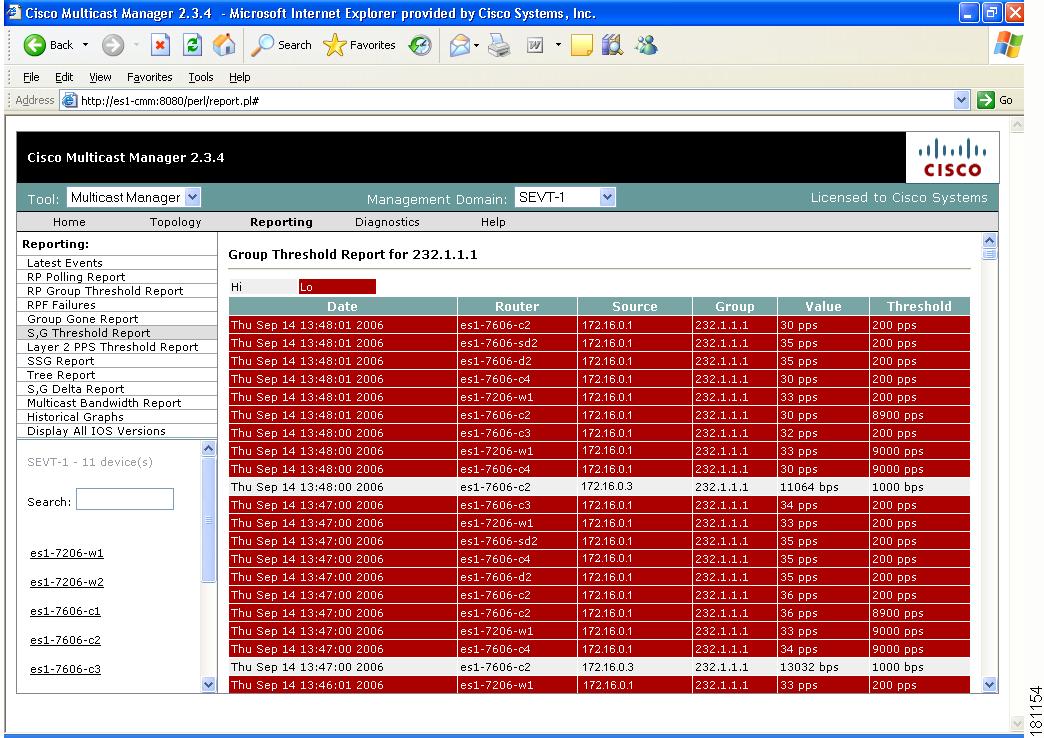
S,G Threshold Report
Using the S,G Threshold Report, you can monitor every source and group that has exceeded its configured threshold.
To generate an S,G Threshold report:
Step 1
Step 2
Step 3
Figure 3-9 S,G Threshold Report
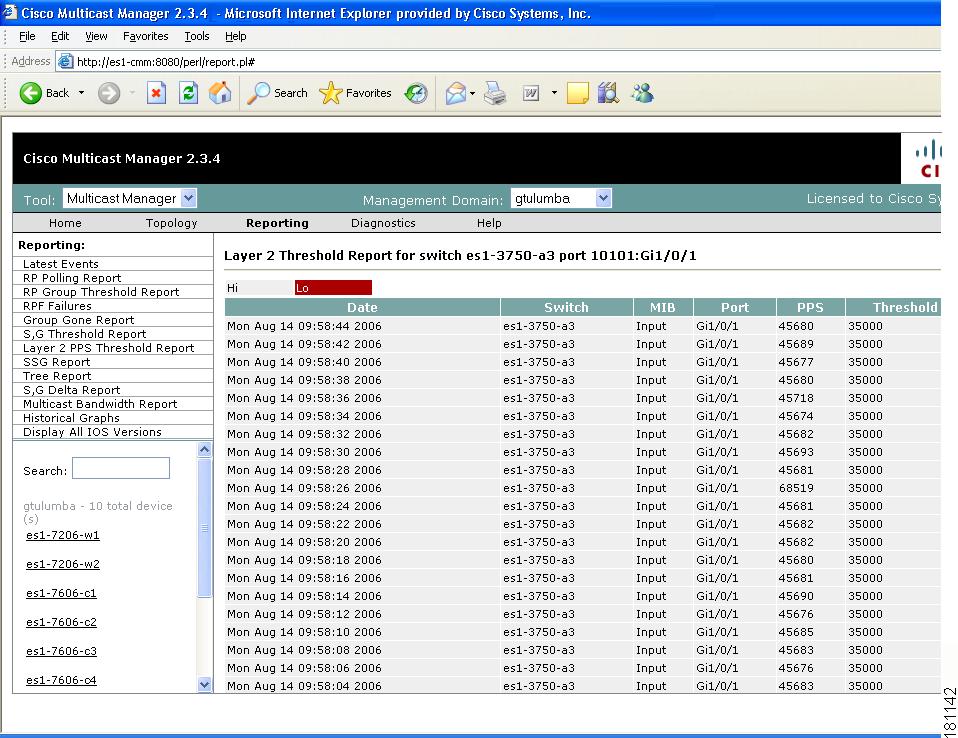
Layer 2 PPS Threshold Report
Using the Layer 2 PPS Threshold Report, you can monitor all Layer 2 ports that have exceeded their configured thresholds.
To generate a Layer 2 PPS Threshold Report:
Step 1
Step 2
Step 3
Note
Figure 3-10 Layer 2 PPS Threshold Report
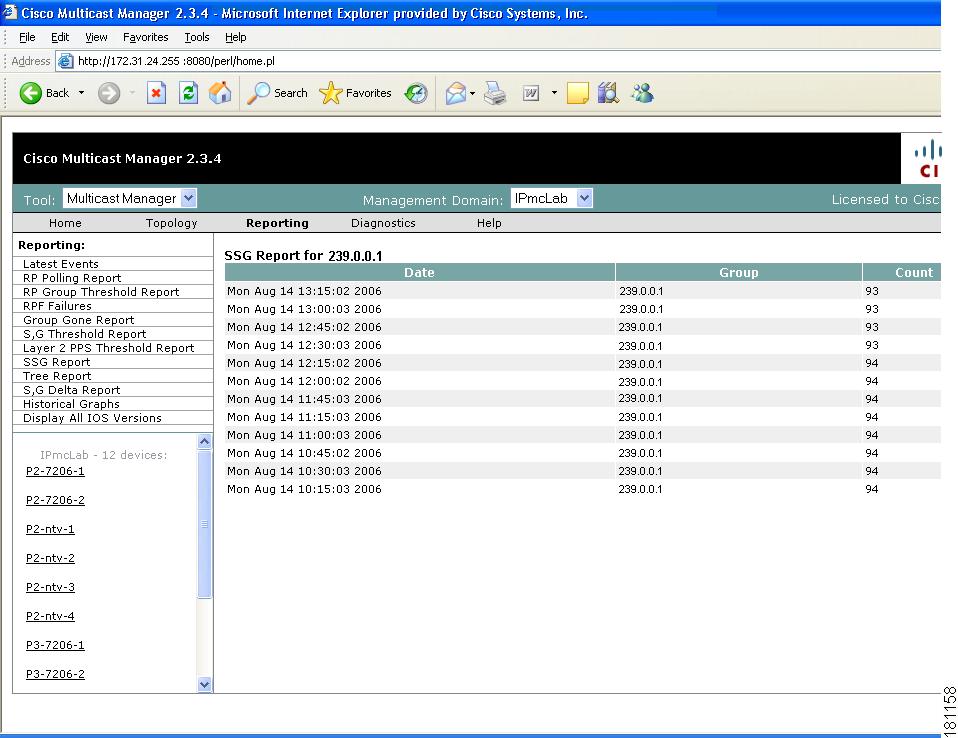
SSG Report
Using the SSG Report, you can display information about groups that have more than one sender.
To generate an SSG Report:
Step 1
Step 2
Figure 3-11 SSG Report
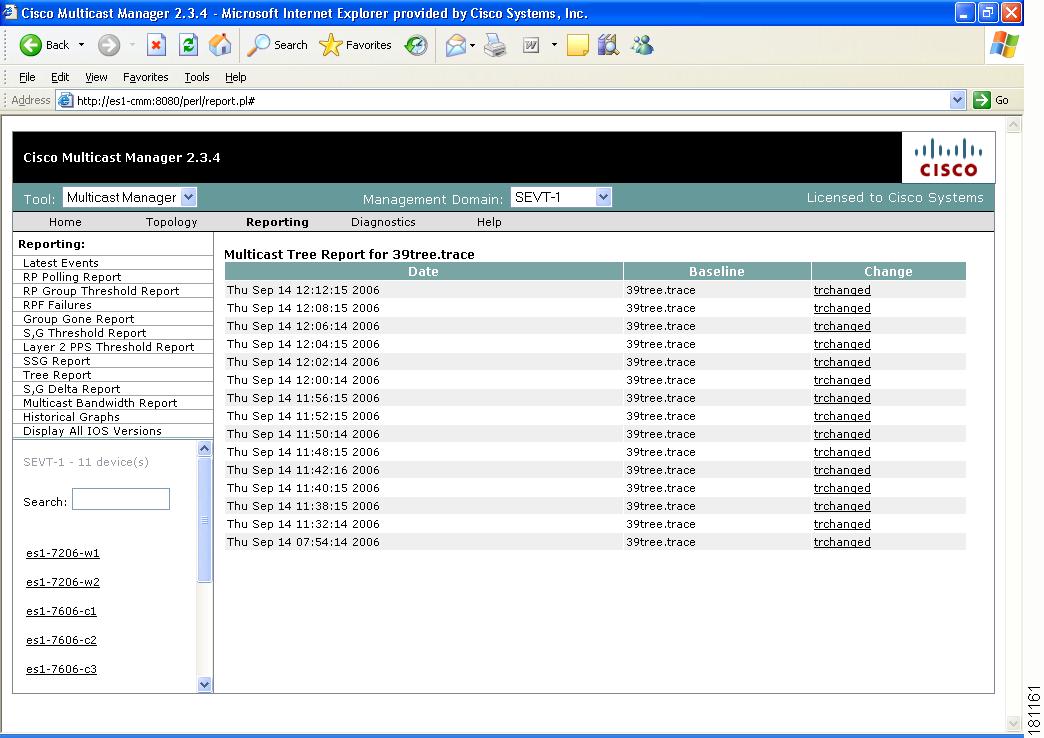
Tree Report
Using the Multicast Tree Report, you can draw and save multicast trees (called baselines). You can then set up the CMM to draw trees that have been saved in the background, and report any changes. (Only changes to Layer 3 devices are reported.)
Note
If a multicast tree you are monitoring changes, a trap is generated. You can then view the baseline and the changed tree. Changes are highlighted in the text and also in the drawing.
To generate a Multicast Tree Report:
Step 1
Step 2
Step 3
Figure 3-12 Tree Report
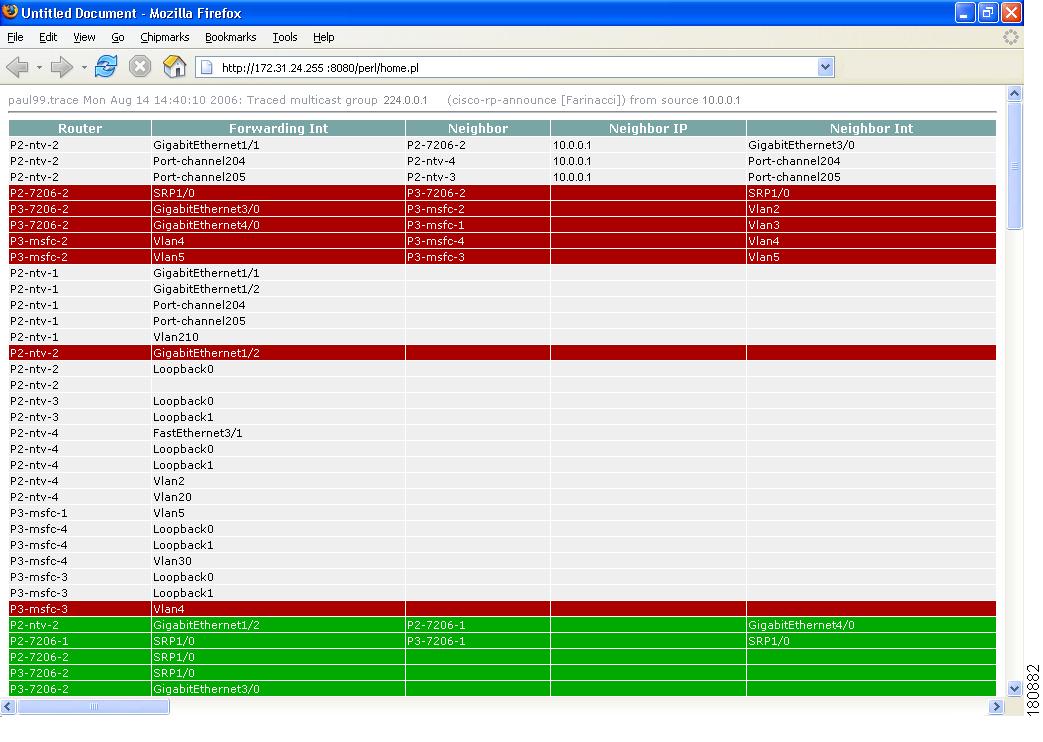
Selecting "trchanged" in the third column in the report will graphically show the baseline, along with the changed tree. Changes to the tree are highlighted in the table at the top as shown in the figure. The baseline and the current tree are also shown graphically.
Figure 3-13 Tree Report Page—trchanged
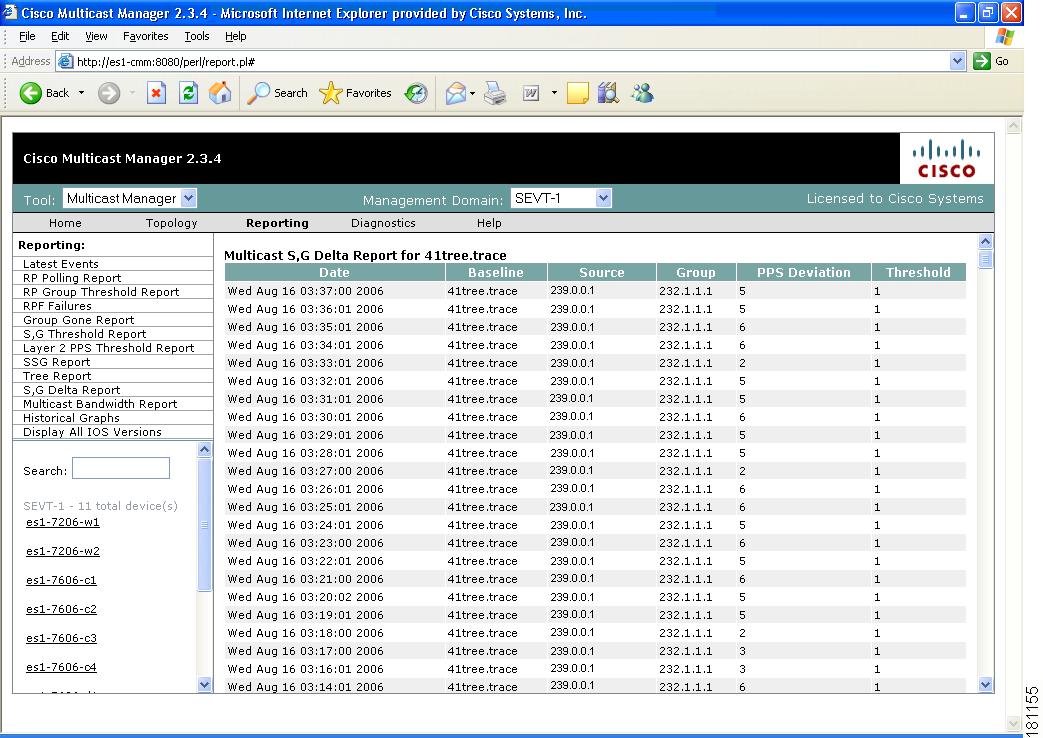
S,G Delta Report
Using the Multicast S,G Delta Report, you can view information about PPS rate deviation on multicast trees.
To generate a Multicast S,G Delta Report:
Step 1
Step 2
Step 3
Figure 3-14 Multicast S,G Delta Report
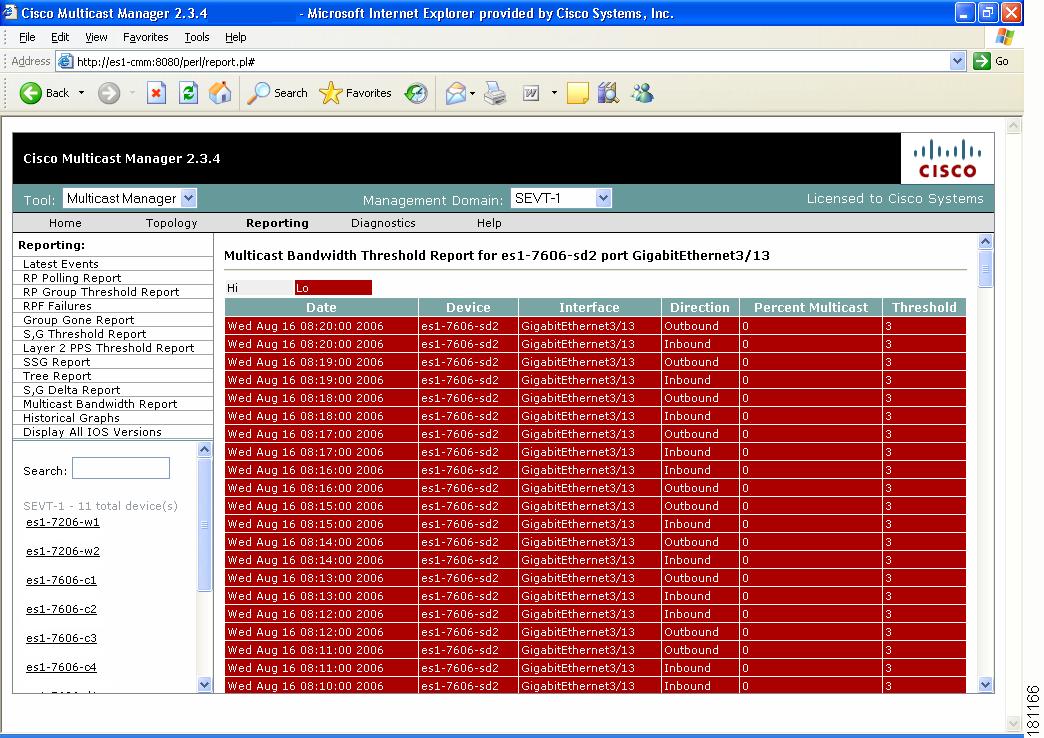
Multicast Bandwidth Report
To generate a report for a router interface that has exceeded its multicast bandwidth thresholds:
Step 1
Step 2
Step 3
Step 4
Figure 3-15 Multicast Bandwidth Threshold Report
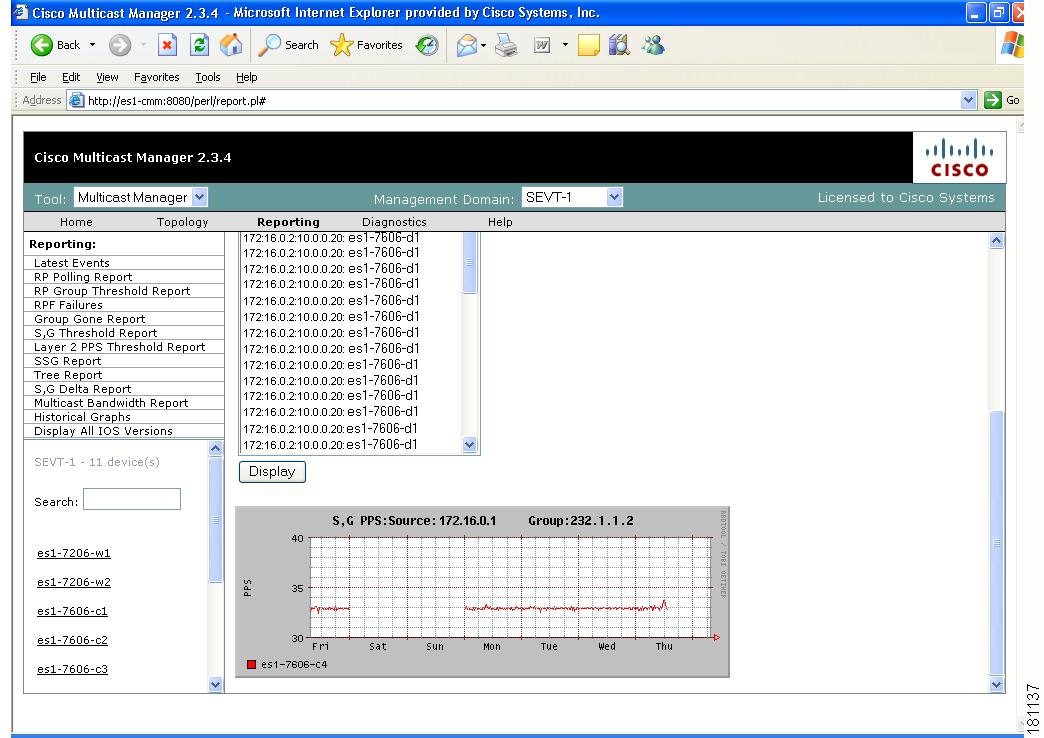
Historical Graphs
Using Historical Graphs, you can view historical data in a graph format. Historical data is collected when you start to monitor any of the following:
•
•
•
To view Historical Graphs:
Step 1
•
•
•
•
Step 2
•
•
•
•
•
Then select a Start and End range.
Step 3
Note
Figure 3-16 Historical Graphs
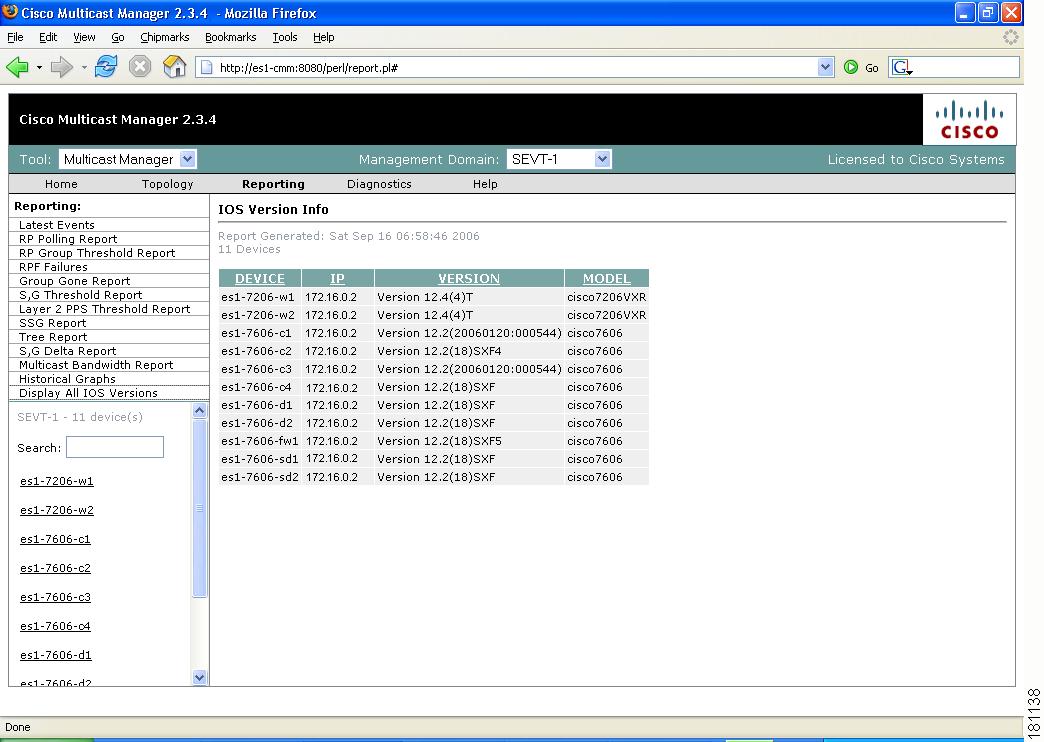
Display All IOS Versions
Using the IOS Version Info page, you can view the IOS version of all discovered routers in the current domain. You can sort the table by device, IP address, IOS version, or model by selecting the corresponding column heading.
Figure 3-17 IOS Version Info