Feedback
Table Of Contents
Configuring with the CMM Administration Tool
Using Administrative Utilities
Downloading Router Configurations
Validating Router Configurations
Configuring Domain-Specific Trap Receivers and Email Addresses
Configuring Specific Multicast Manager Polling
Current Source/Group Polling Configuration
Configuring with the CMM Administration Tool
System administrators can configure their network using the CMM Administration Tool.
This chapter covers:
•
Using Administrative Utilities
•
Performing Domain Management
For details on Domain Management, see the "Creating a Domain" section.
Using Administrative Utilities
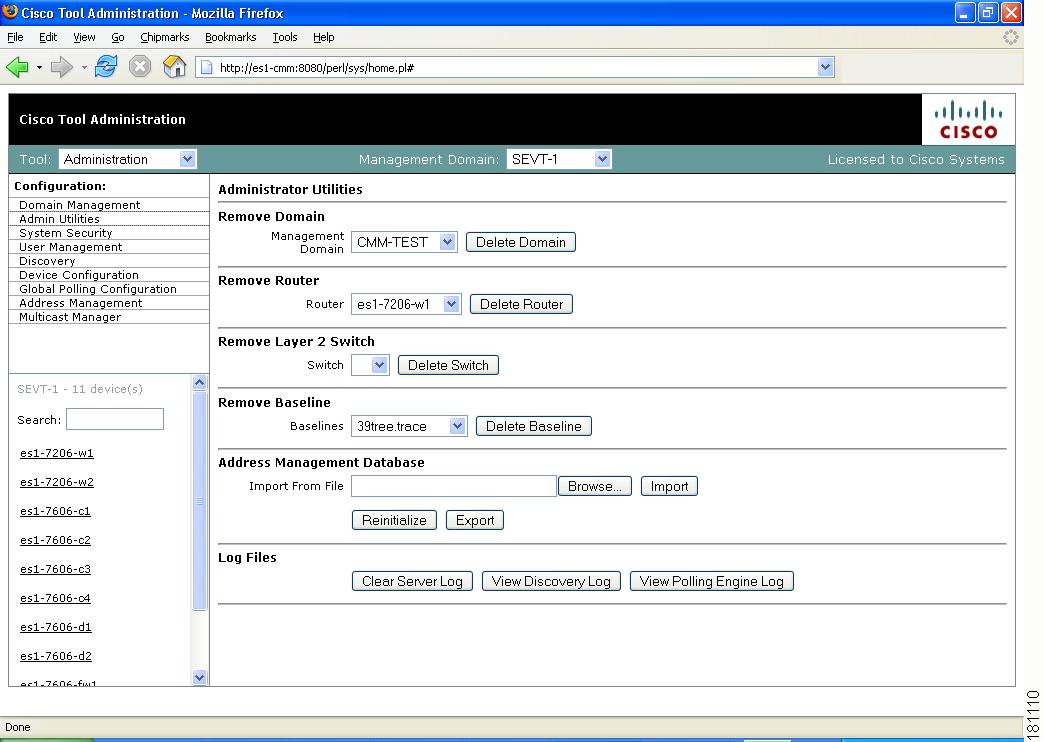
The Administrative Utilities page provides maintenance tools for the system administrator.
Figure 2-1 Administrative Utilities
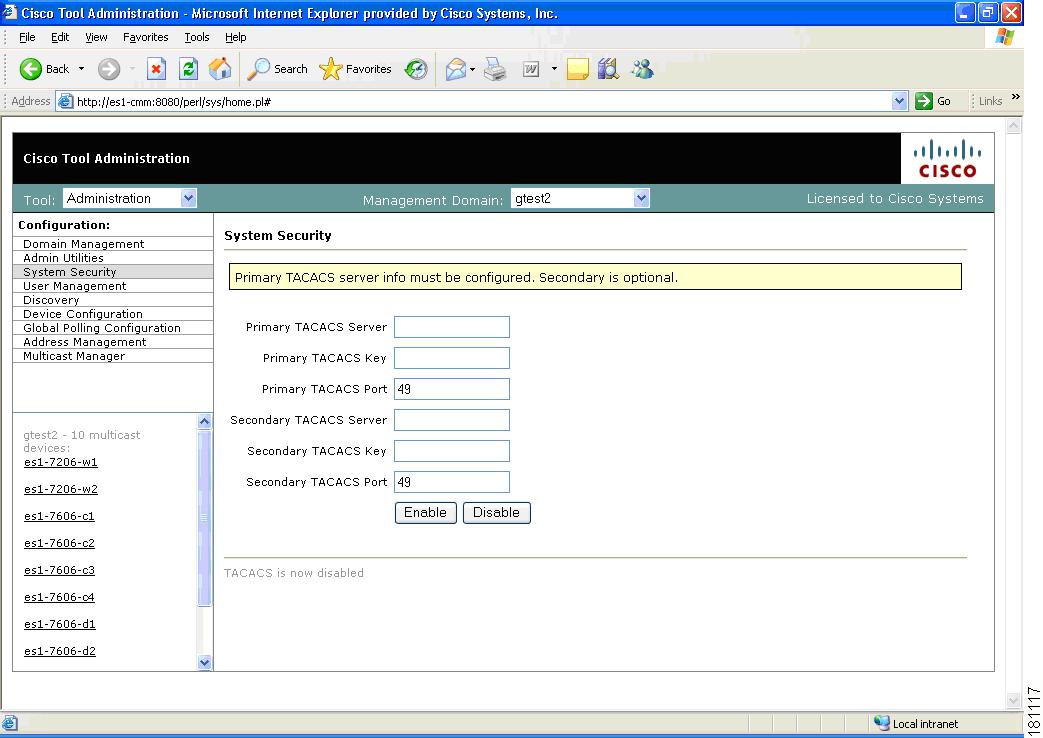
Configuring System Security
The System Security page provides TACACS login support for the CMM.
To configure TACACS login, enter the IP address of the TACACS server within the Primary TACACS Server field.
If the keys are configured incorrectly, they will have to be manually changed in the /opt/RMSMMT/httpd_perl/conf/httpd.conf file as follows:
Tacacs_Pri_Key tac_plus_keyTacacs_Sec_Key tac_plus_key<Sample AAA Server Config>group = admins {service = connection {priv-lvl=15}group = netop {service = connection {}}user = mike {member = netoplogin = des mRm6KucrBaoHY}user = admin {member = adminslogin = cleartext "ciscocmm"}</Sample AAA Server Config>Figure 2-2 System Security
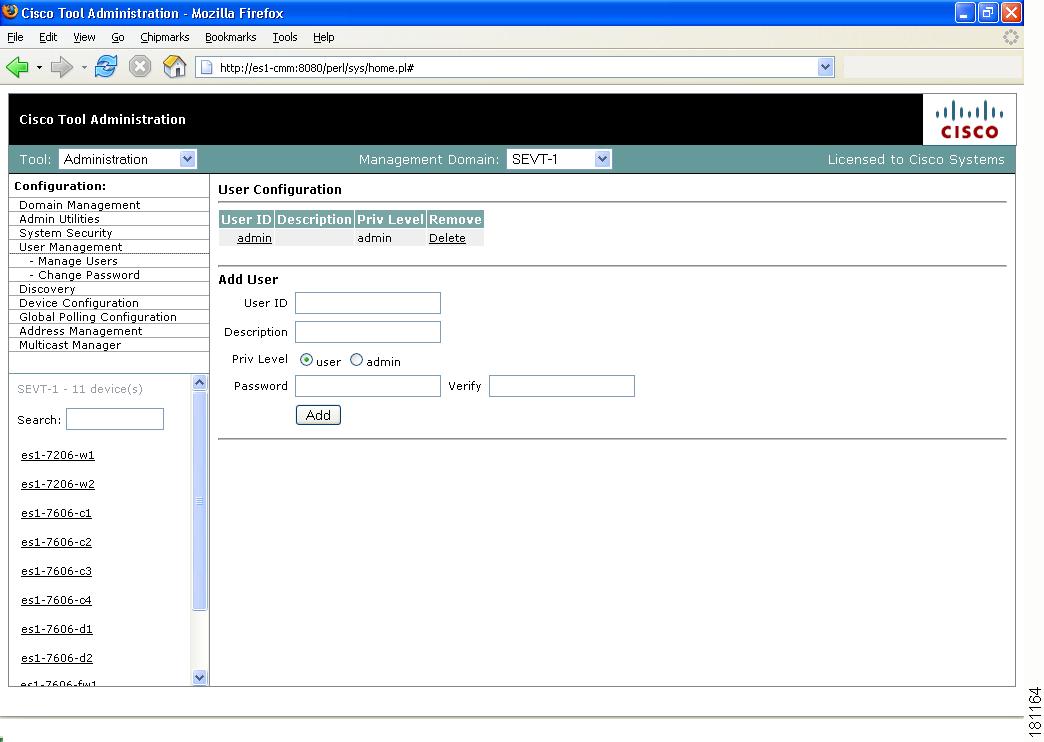
Managing Users and Passwords
The CMM provides two privilege levels: user and admin. You need an administrator account to configure multicast domains, run discovery, create users, create health checks, and use the Admin Utilities functions.
You can configure users and passwords using the User Management pages:
•
•
Figure 2-3 Manage Users—User Configuration
To add a new user:
Step 1
Step 2
Step 3
Step 4
Step 5
Selecting the User ID link in the table allows you to edit the user's description. Select Delete to delete a user (only an administrator can delete users).
Note
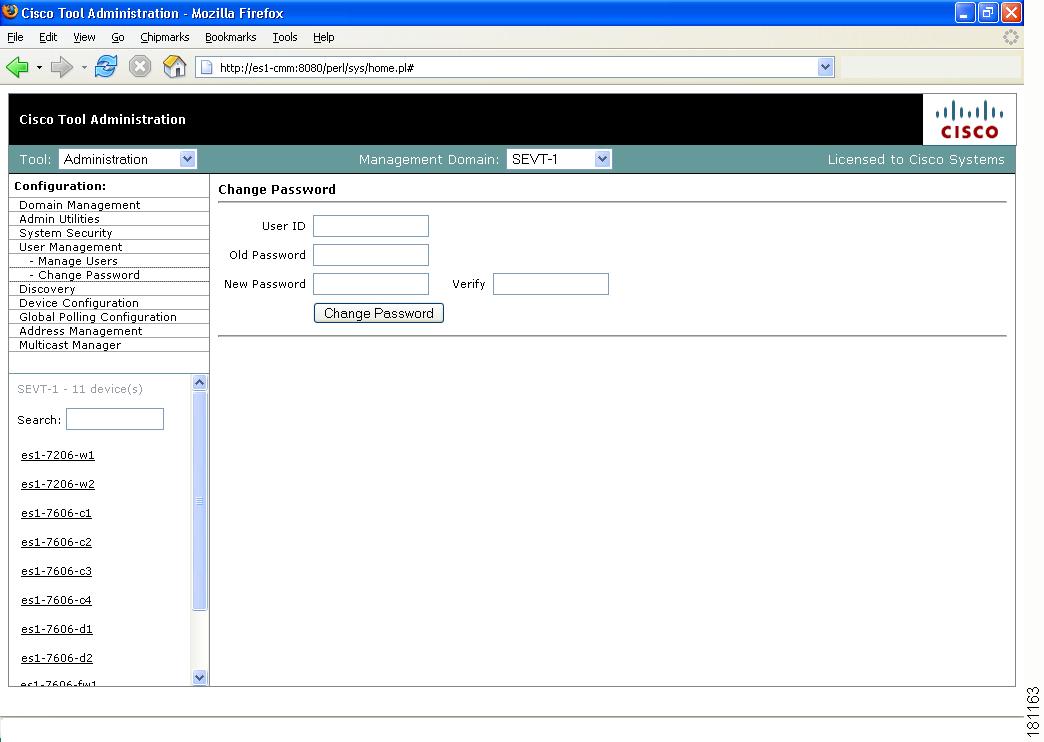
Users can change their passwords by clicking Change Password.
Figure 2-4 Manage Users—Change Password
To change your password:
Step 1
Step 2
Step 3
Step 4
Discovering Your Network
For details on Discovery, see Discovering Your Network.
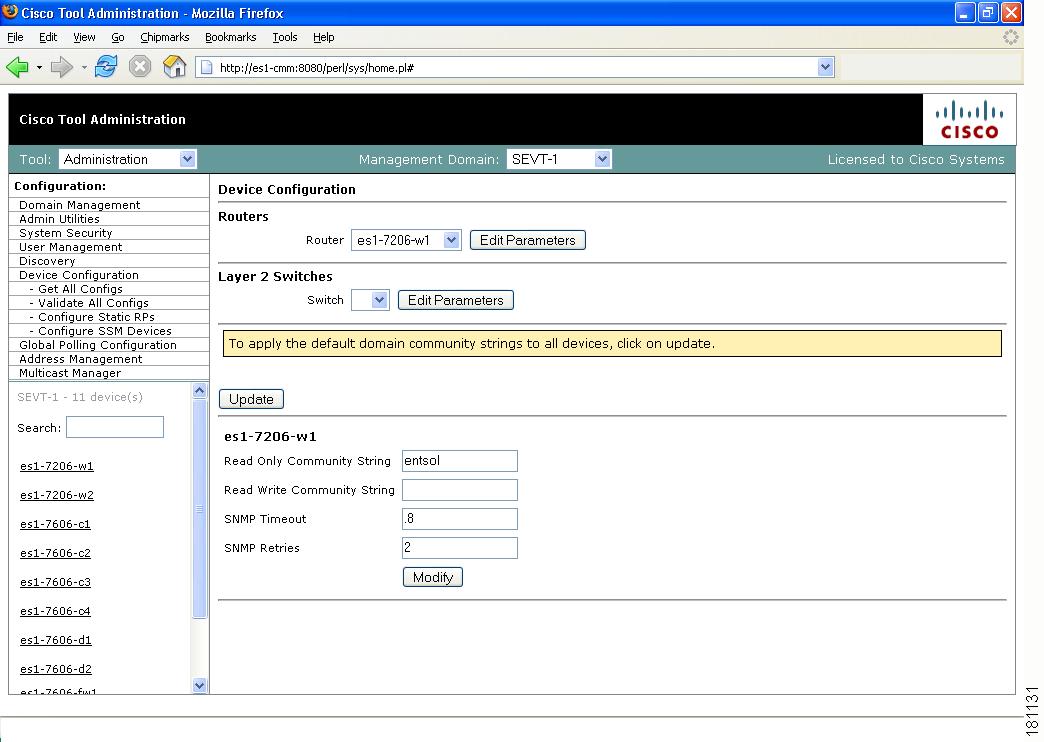
Configuring Devices
Using the Device Configuration page, you can change the SNMP read key of a single device. Select a Router or Switch, then click Edit Parameters.
Figure 2-5 Device Configuration—Edit Parameters
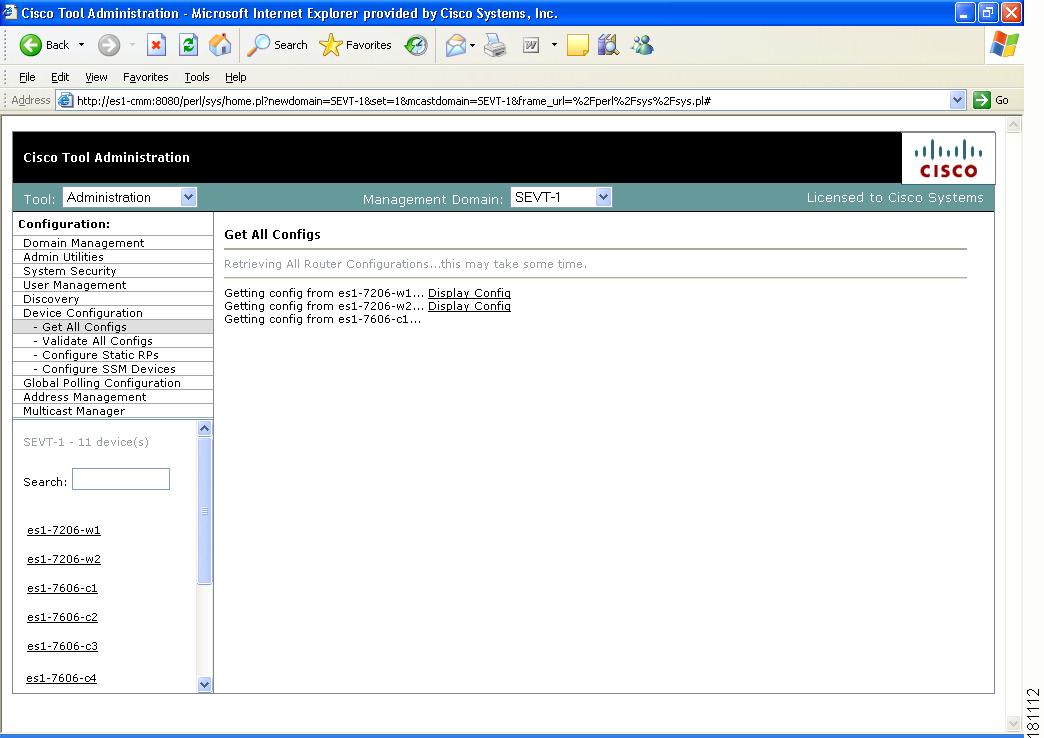
Downloading Router Configurations
You can download the router configurationto the CMM for each router in the database. Under the Device Configuration menu at left, select Get All Configs.
If you entered the SNMP write key for the router when you set up the domain, CMM can download and display configuration files for the router.
Note
Figure 2-6 Get All Configs
This process may take some time, depending on the number of routers in the current domain.
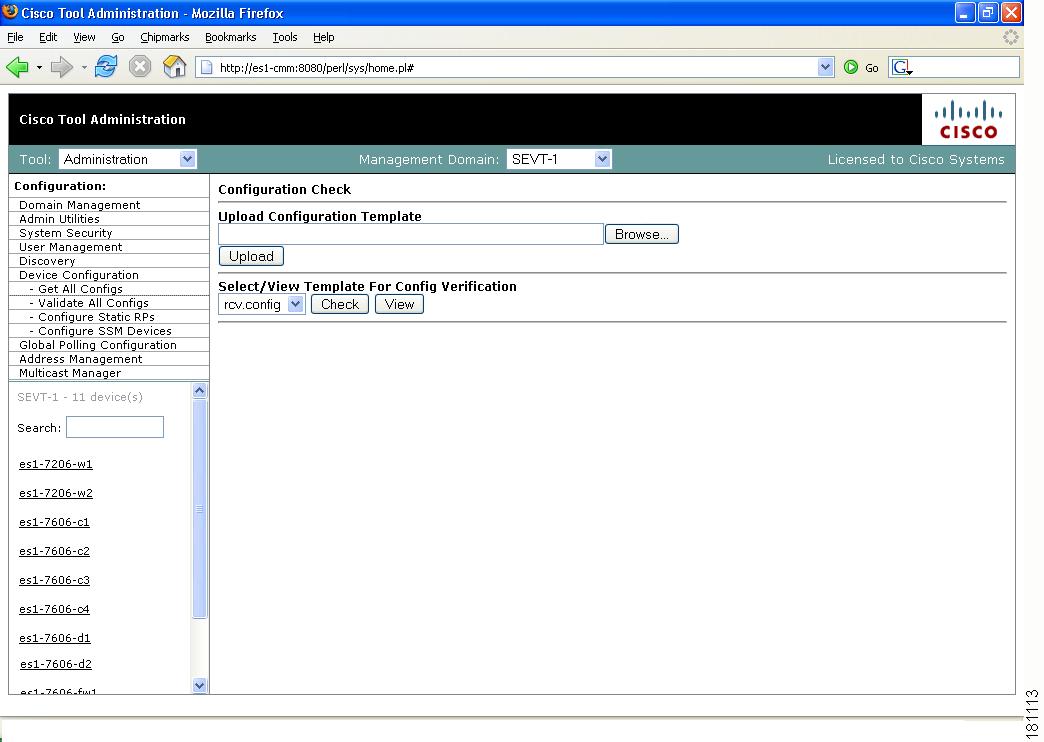
Validating Router Configurations
Using the CMM, you can verify if IOS commands exist on a router, either globally, or on a single interface. Router configurations for a domain are verified against a template. Several sample templates are included with the application, or you can create a user-defined template, which must be a text (.txt) file containing a list of IOS commands to check. For example, to check for global commands, start the text file with the word "global." To check interface commands, add the word "interface" and so on. You can check for global and interface at the same time, as in the example:
GLOBALservice timestamps log datetime msec localtime show-timezoneservice password-encryptionloggingno logging consoleno ip source-routeip subnet zeroip classlessINTERFACEip pim-sparse-modeTo select a template and initiate validation:
Note
Step 1
Step 2
Step 3
a.
b.
Step 4
Step 5
Step 6
Figure 2-7 Configuration Check
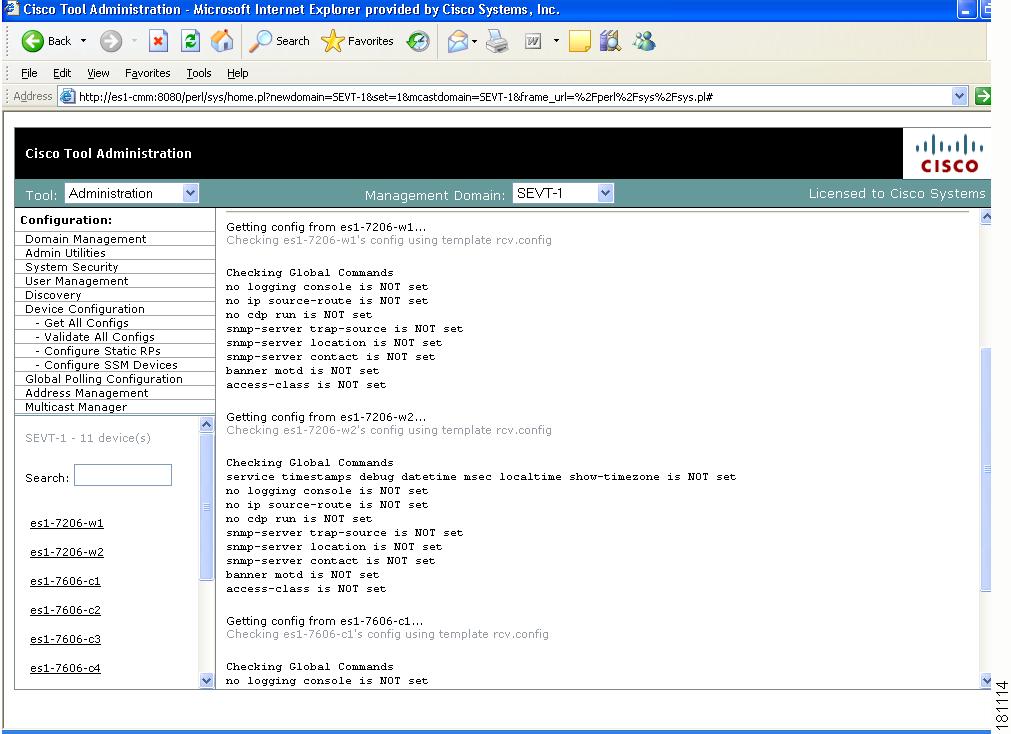
The CMM checks each router in the database for the existence of the commands in the template you specified. Output looks similar to Figure 2-8.
Figure 2-8 Configuration Check—Output
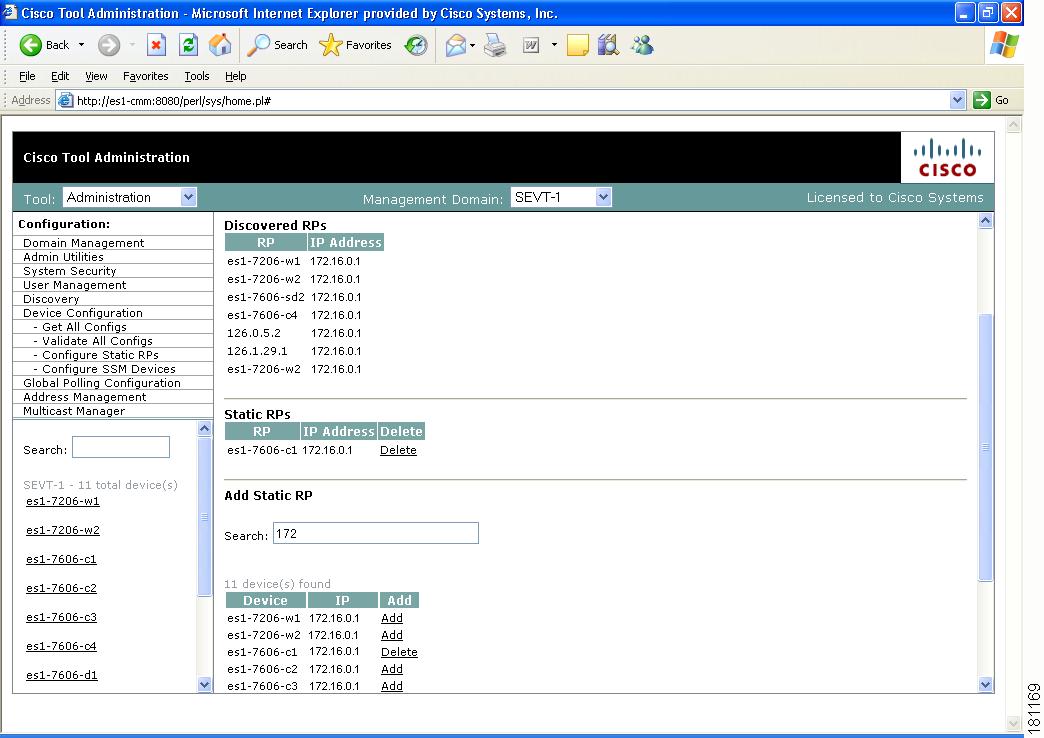
Configuring Static RPs
If you have static RPs configured, you must configure CMM to find these static RPs, which in turn populates the RP Summary within the Multicast Manager tool Diagnostics section.
To configure static RPs:
Step 1
Step 2
Step 3
Figure 2-9 Configure Static RPs
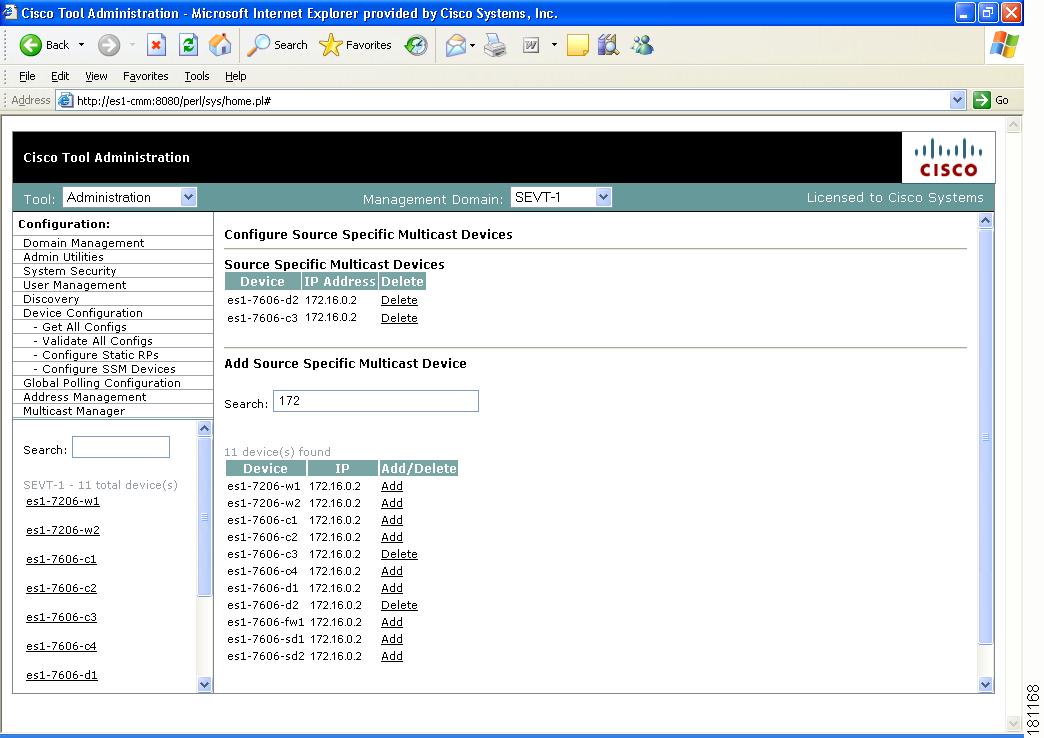
Configuring SSM Devices
The CMM currently supplies you with a list of all active sources and groups when requested (see the "Show All Groups" section). In a network containing RPs, the CMM visits each RP and collates a list to provide this information when requested. This is not possible in an SSM network that does not contain RPs. To provide you with a list of all active sources and groups in SSM networks, you can input routers to the CMM that it will visit when asked for this information. You can decide which routers are considered RP-type devices that contain most of the active sources and groups in the network, and then specify those routers. When you request to Show All Groups, the CMM visits the specified routers and builds the list from them.
Note
To configure SSM devices:
Step 1
Step 2
Step 3
Figure 2-10 Configure Source Specific Multicast Devices Page
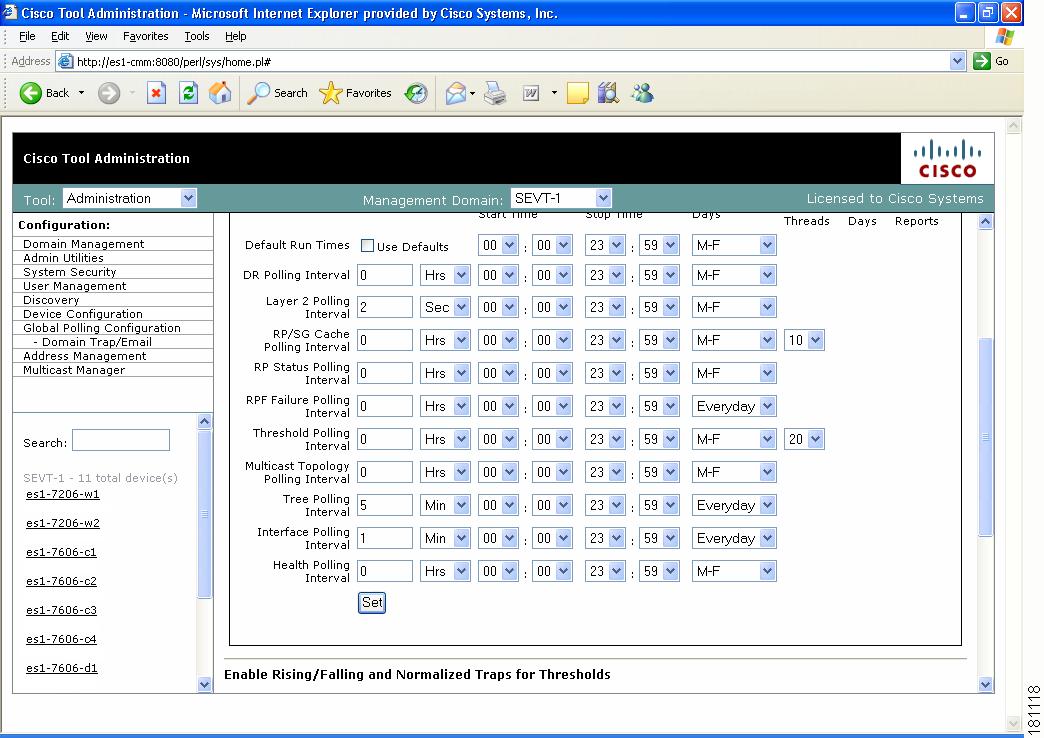
Configuring Global Polling
You can configure each polling element to start and stop at specific times. Each element also has its own polling interval. You can configure these values through the Global Polling Configuration page.
Note
Figure 2-11 Global Polling Configuration
Note
Refresh Status
The status line indicates how long the polling daemon has been running and how it was started. Click Refresh Status to update the status information.
Start
Starts the polling daemon globally.
Stop
Stops the polling daemon globally.
Restart
Restarts the polling daemon globally. Each time you change a polling interval, click Restart.
Default Run Times—Use Defaults
Selecting the Use Defaults checkbox sets all the start/stop times and days to the default values.
DR Polling Interval
Checks the status of all DRs in the network. If a user changes a DR, an SNMP trap is sent.
Layer 2 Polling Interval
Time between polling of the Layer 2 ports.
RP/SG Cache Polling Interval
For certain CMM data, such as the data within the Multicast Diagnostics page (see Show All Groups) the CMM queries each RP, collates a list of active sources, and groups and displays them. There are two ways the CMM can accomplish this: dynamically when the command is entered, or the CMM can build a cache of this information, and when the command is entered, the cache is queried. Caching is enabled on the System Configuration page (see Performing Domain Management) and the RP/SG Cache Polling Interval is the time period that this cache is refreshed.
Deciding whether caching should be turned on depends upon the number of RPs, sources, and groups. If the Multicast Diagnostics page takes a while to display all groups, you may want to turn caching on.
The Max Threads value controls how many devices are queried simultaneously. Values can be 1-10. Queries used for RP/SG Cache Polling are SNMP getbulk queries that can potentially return large amounts of data. To address timeouts, you can reduce the number of Max Threads and/or adjust the SNMP timeout and retry values on the System Configuration page (see Performing Domain Management).
RP Status Polling Interval
RP Status Polling queries the sysUpTime of the RPs configured on the RP Polling Configuration page (see RP Polling).
The purpose of this query is to report availability of the RPs. If the RP responds, an rpReachable trap is sent. If the RP does not respond, an rpUnreachable trap is sent. Since at least one of these traps is sent at each polling interval, you can also use them to ensure that the polling daemon is up and running.
RPF Failure Polling Interval
Time interval that each router will be polled for each source and group configured to check the number of RPF failures.
Threshold Polling Interval
Time interval that each router will be polled for the existence of each source and group configured, and CMM will ensure that no thresholds are exceeded.
Multicast Topology Polling Interval
Topology polling queries the sysUpTime of each router in the multicast domain to see if it has been reloaded. If it has, the polling daemon launches a Single Router Discovery of that device in the background, to ensure that the SNMP ifIndexes have not changed.
Tree Polling Interval
Time interval that the monitored trees are drawn and compared with their baselines.
Interface Polling Interval
Time interval where the percent of multicast bandwidth per interface is compared to the thresholds.
Health Polling Interval
Time interval at which the configured health checks are scheduled to run.
Set
Sets the values you enter.
You can enable or disable the continuous sending of PPS threshold traps using the Enable Rising/Falling and Normalized Traps for Thresholds section:
•
•
•
You can add or remove trap receivers using the Configure Global Default SNMP Trap Receivers section. The SNMP trap receivers specified here are only used if domain-specific SNMP trap receivers are not specified. Domain-specific trap receivers are specified from the Trap Receiver/Email Polling Configuration page (see Configuring Domain-Specific Trap Receivers and Email Addresses).
You can add or remove email addresses using the Configure Global Default Email Addresses for Event Notification section. Email addresses are notified of SSG exceptions and threshold and existence events. The email addresses specified here are used only if domain-specific email addresses are not specified. Domain-specific email addresses are specified from the Trap Receiver/Email Polling Configuration page (see Configuring Domain-Specific Trap Receivers and Email Addresses).
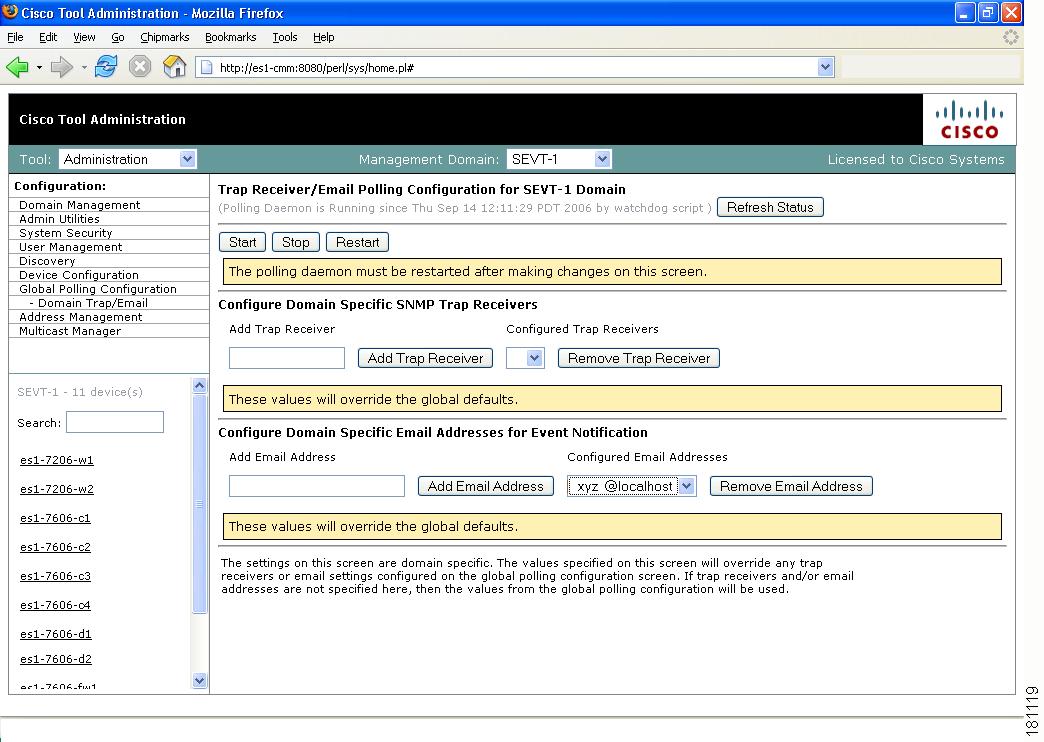
Configuring Domain-Specific Trap Receivers and Email Addresses
You can configure the CMM to send domain-specific SNMP trap receivers or emails. Under the Global Polling Configuration menu at left, click Domain Trap/Email. The Trap Receiver/Email Polling Configuration page appears.
Figure 2-12 Trap Receiver/Email Polling Configuration
You can add or remove trap receivers using the Configure Domain Specific SNMP Trap Receivers section. The SNMP trap receivers specified here are only used if global SNMP trap receivers are not specified. Global trap receivers are specified from the Configure Global Default SNMP Trap Receivers page (see Configuring Global Polling).
You can add or remove email addresses using the Configure Domain Specific Email Addresses for Event Notification section. Email addresses are notified of SSG exceptions and threshold and existence events. The email addresses specified here are only used if global email addresses are not specified. Global email addresses are specified from the Configure Global Default SNMP Trap Receivers page (see Configuring Global Polling).
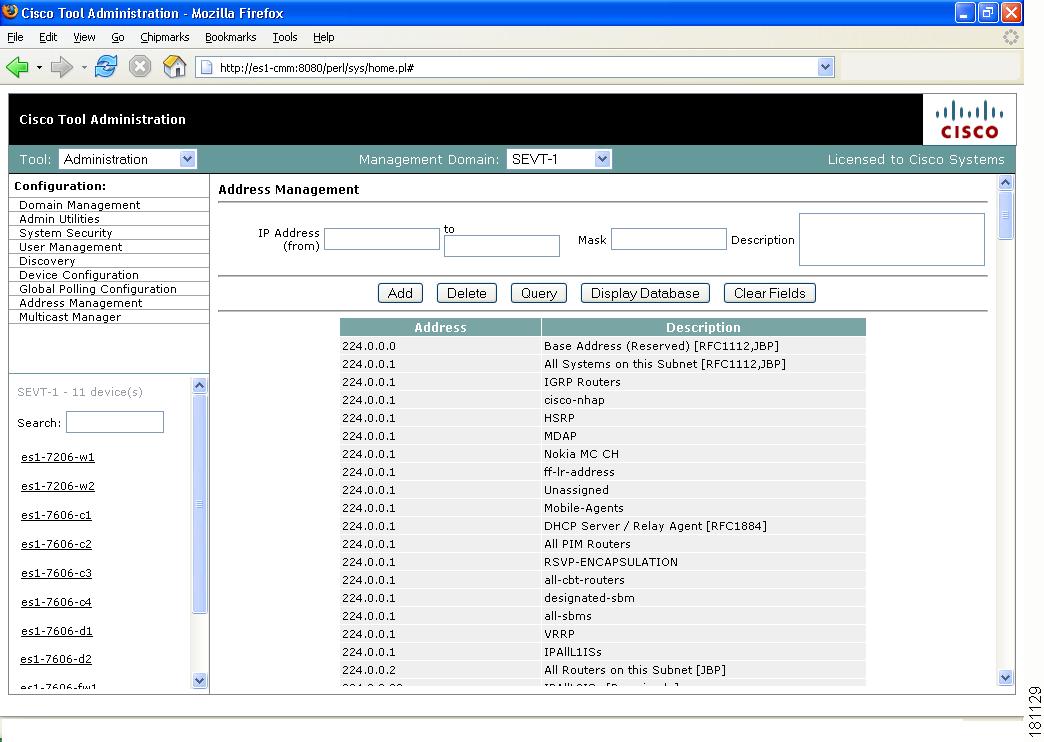
Managing IP Addresses
Using the Address Management page, you can enter multicast group and source addresses into the database with a description. When the CMM displays these sources and groups, the descriptions will be added for easy recognition.
The database is already populated with all the reserved address space.
Figure 2-13 Address Management
Configuring Specific Multicast Manager Polling
You can configure the following types of multicast polling:
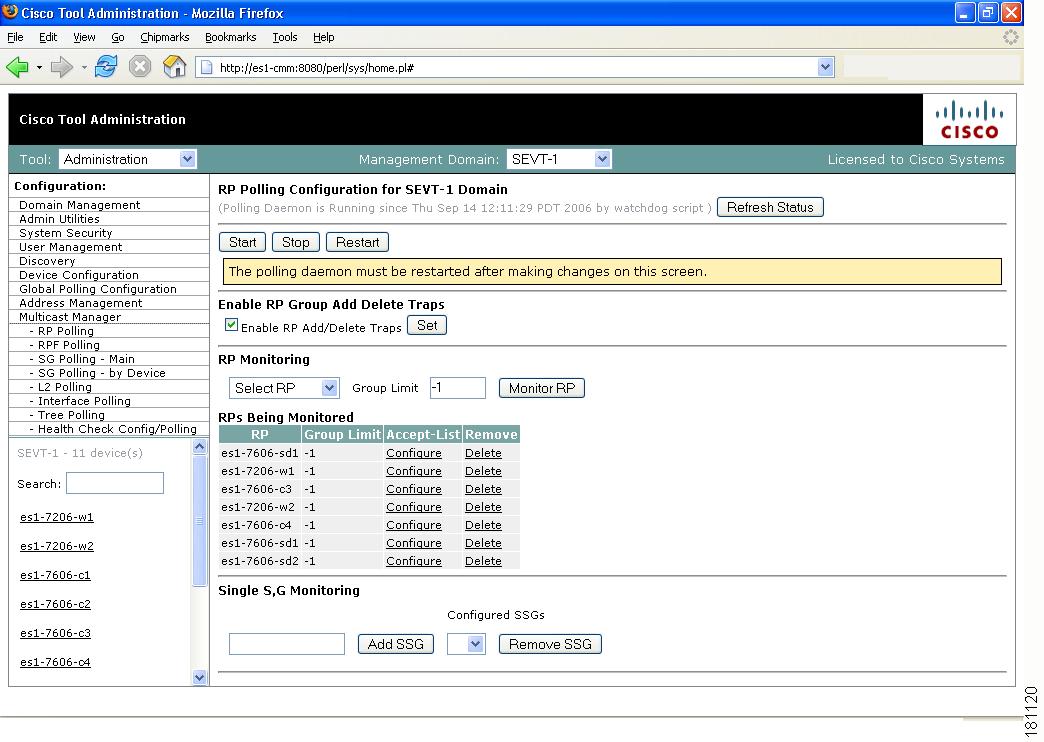
RP Polling
Using the RP Polling Configuration page, you can enable the CMM to:
1.
2.
3.
4.
Note
Figure 2-14 RP Polling Configuration
Refresh Status
The status line indicates how long the polling daemon has been running and how it was started. Click Refresh Status to update the status information.
Start
Starts the polling daemon globally.
Stop
Stops the polling daemon globally.
Restart
Restarts the polling daemon globally. Each time you change a polling interval, click Restart.
Enable RP Group Add Delete Traps
Click the checkbox to monitor all leaves and joins, which are then reported within the RP Polling Report page (see RP Polling Report, page 3-5).
RP Monitoring
To monitor an RP, select the RP from the box.
To monitor a specific number of groups, enter a number in the Group Limit box.
Click Monitor RP.
If the group limit is exceeded, a report is generated within the RP Group Threshold Report page (see the "RP Group Threshold Report" section on page 3-6).
RPs Being Monitored
Lists:
•
•
•
•
Single S, G Monitoring
Enter the group IP address. If more than one source becomes active for this group, a report is generated.
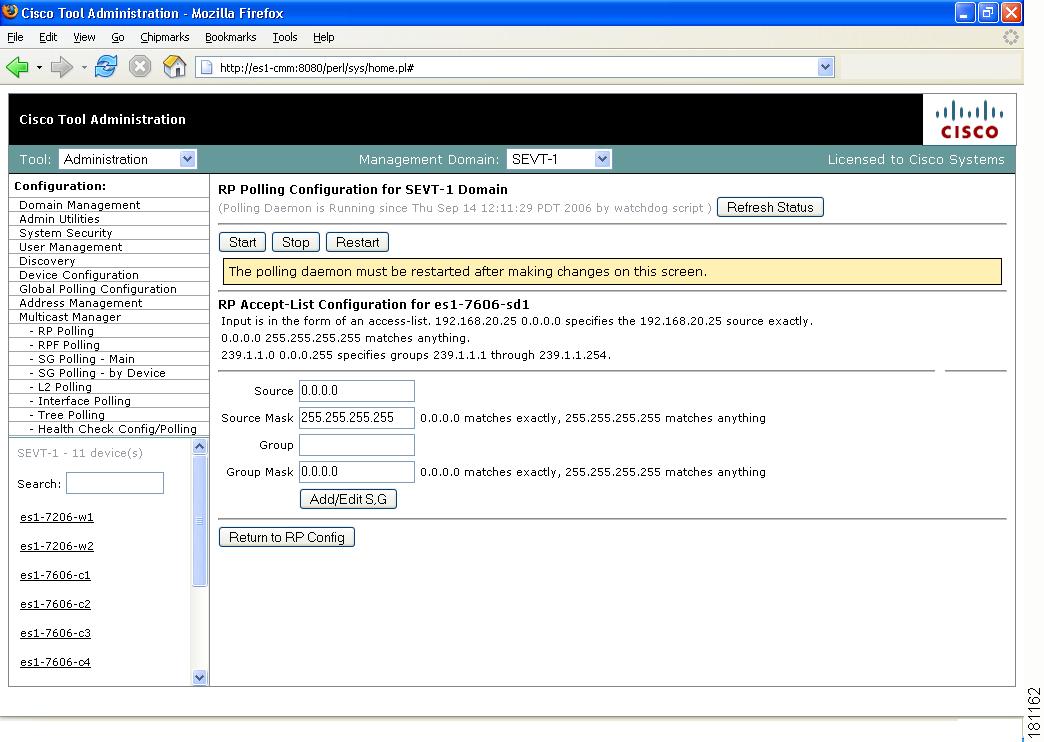
RP Accept List Configuration
The RP Accept List Configuration section lets you monitor the active sources and groups on a specific RP.
Figure 2-15 RP Accept List Configuration
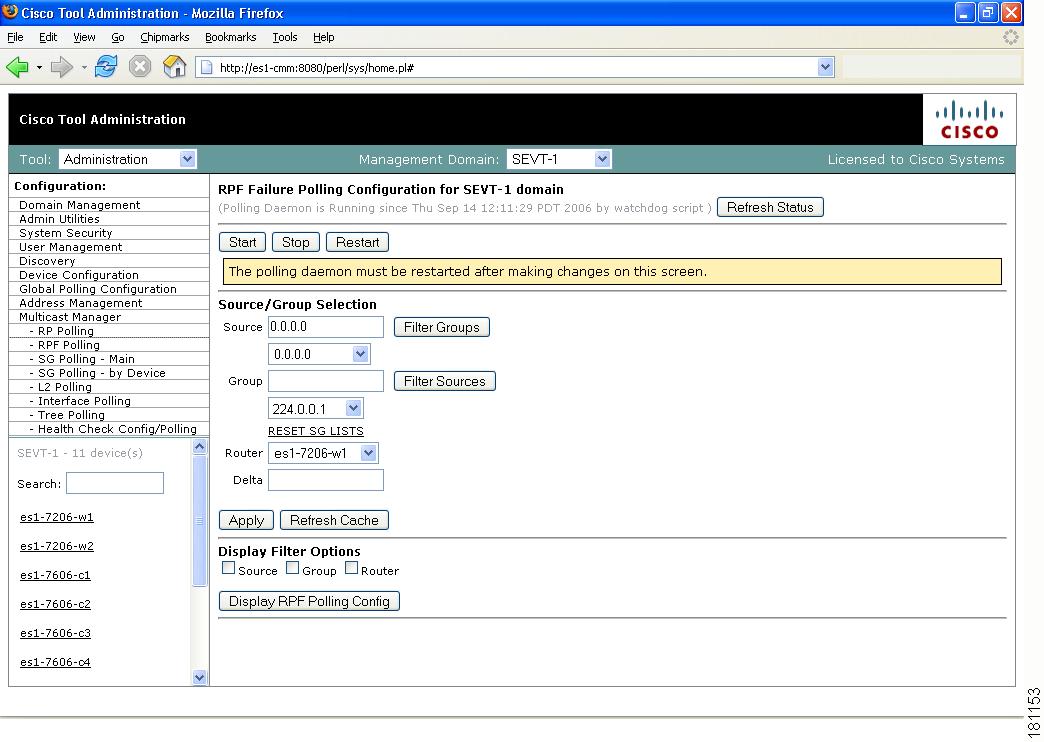
RPF Polling
Using the CMM, you can monitor RPF failures for a particular source and group on any selected router.
If any monitored source and group begins to experience RPF failures that rise above the delta, then SNMP traps can be sent, and a report generated, which you can view under RPF Failures (see RPF Failures, page 3-7).
You can select the source and group from the list, or you can enter them manually. If there are a lot of sources and/or groups, you can use the filter option to ensure that you are selecting an S,G that actually exists in the network. The filter option displays only the sources for a selected group or only the groups for a selected source. To reset the lists, click Reset S,G Lists.
Figure 2-16 RPF Failure Polling Configuration
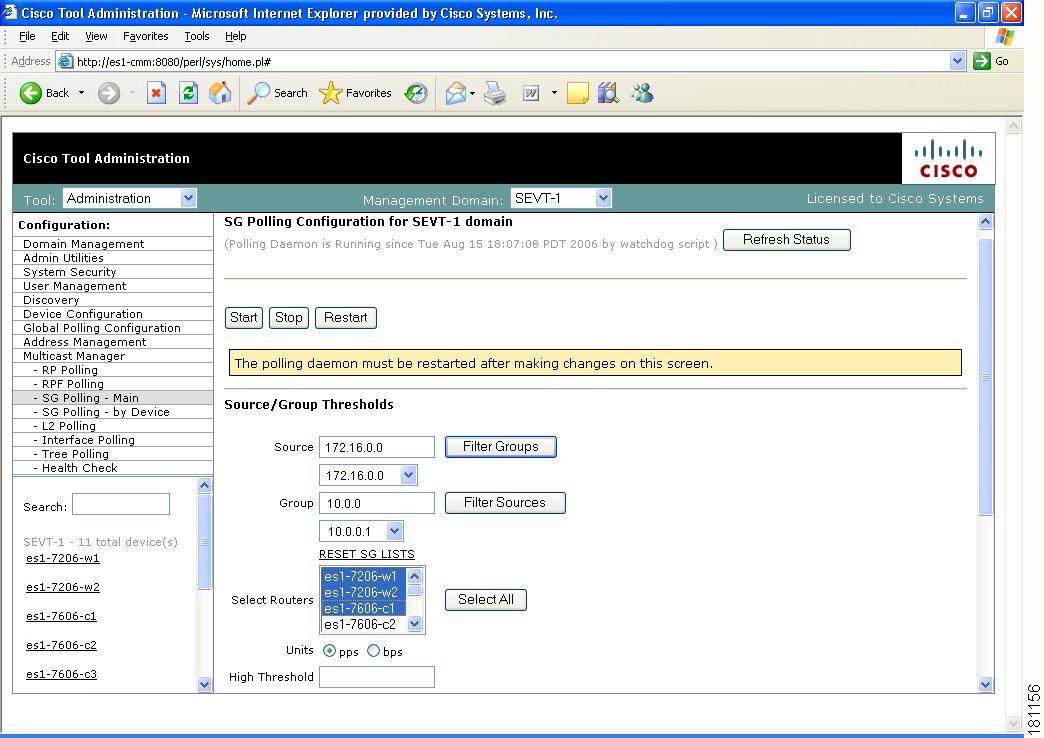
SG Polling—Main
Using the CMM, you can poll sources and groups with high and low thresholds.
You can select the source and group from the list, or you can enter them manually. If there are a lot of sources and/or groups, you can use the filter option to ensure that you are selecting an S,G that actually exists on the network. The filter option displays only the sources for a selected group, or only the groups for a selected source.
Figure 2-17 SG Polling Configuration
Refresh Status
The status line indicates how long the polling daemon has been running and how it was started. Click Refresh Status to update the status information.
Start
Starts the polling daemon globally.
Stop
Stops the polling daemon globally.
Restart
Restarts the polling daemon globally. Each time you change a polling interval, click Restart.
Source
Enter or select the IP address of the source to monitor.
Filter Groups
Filters the output to contain only the relevant groups.
Group
Enter or select the IP address of the group to monitor.
Filter Sources
Filters the output to contain only the relevant sources.
Reset SG Lists
Clears any entries and refreshes the source and group lists.
Select Routers
Enter the router name.
Units
Select either packets per sampling period (pps) or bits per sampling period (bps).
High Threshold
Enter the high threshold that, if exceeded, generates a report.
Low Threshold
Enter the low threshold that, if exceeded, generates a report.
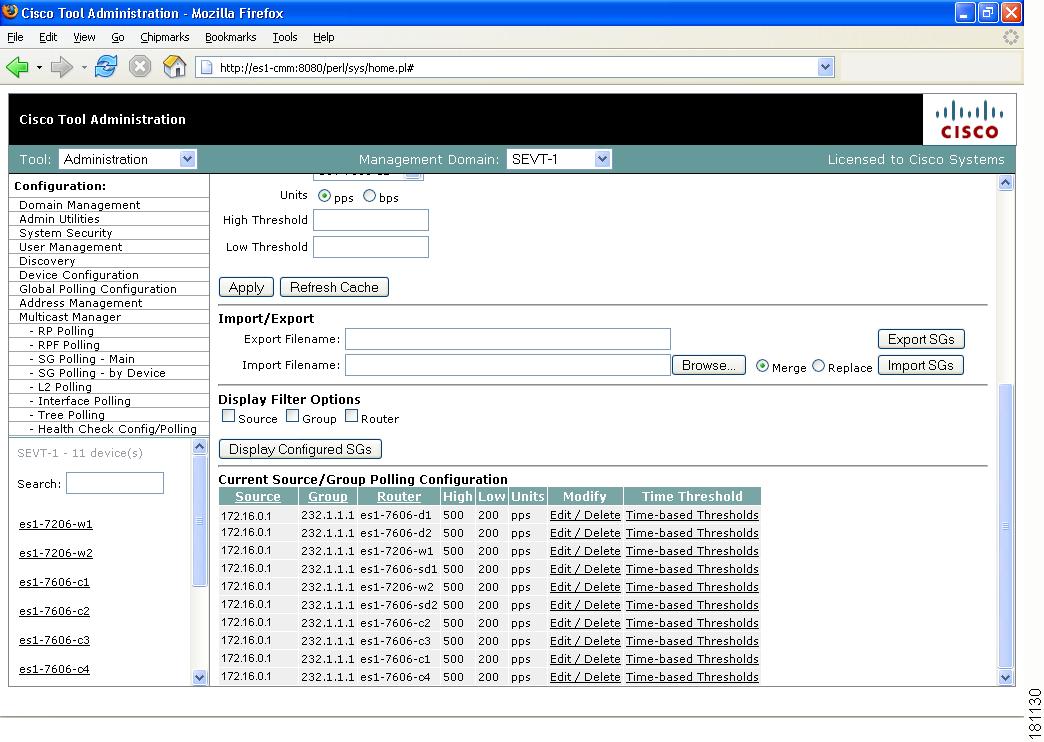
Apply
Applies and saves the changes.
Refresh Cache
If you are using S,G caching, the cache contents appear. Click Refresh Cache to refresh the table of sources and groups.
Display Filter Options
You can filter the list of monitored sources and groups by limiting to source, group, and/or router.
Display Configured SGs
Displays all the sources and groups you are currently monitoring (see Current Source/Group Polling Configuration).
Current Source/Group Polling Configuration
The Current Source/Group Polling Configuration section displays all the sources and groups you are currently monitoring.
Figure 2-18 Current Source/Group Polling Configuration
You can also export( in csv format) the list of monitored S,G's and use an editor of your choice to change, add, and delete, then import the list back, either replacing the current list, or merging it.
The Current Source/Group Polling Configuration section shows you all monitored sources and groups in a tabular format.
•
•
Each time a source and group exceeds a threshold, a trap is sent and a report is generated.
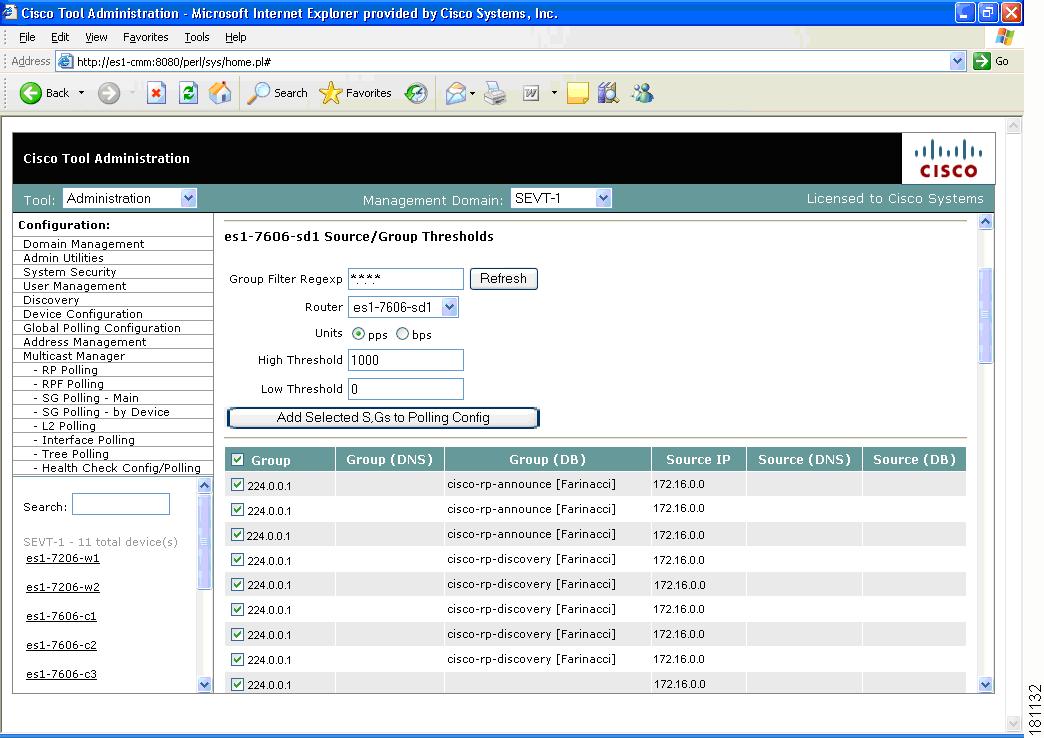
SG Polling—By Device
You can select a particular router using the The Device SG Polling Configuration page, and you can configure which sources and routers to monitor on the specific device:
Step 1
Step 2
Step 3
Figure 2-19 Device SG Polling Configuration
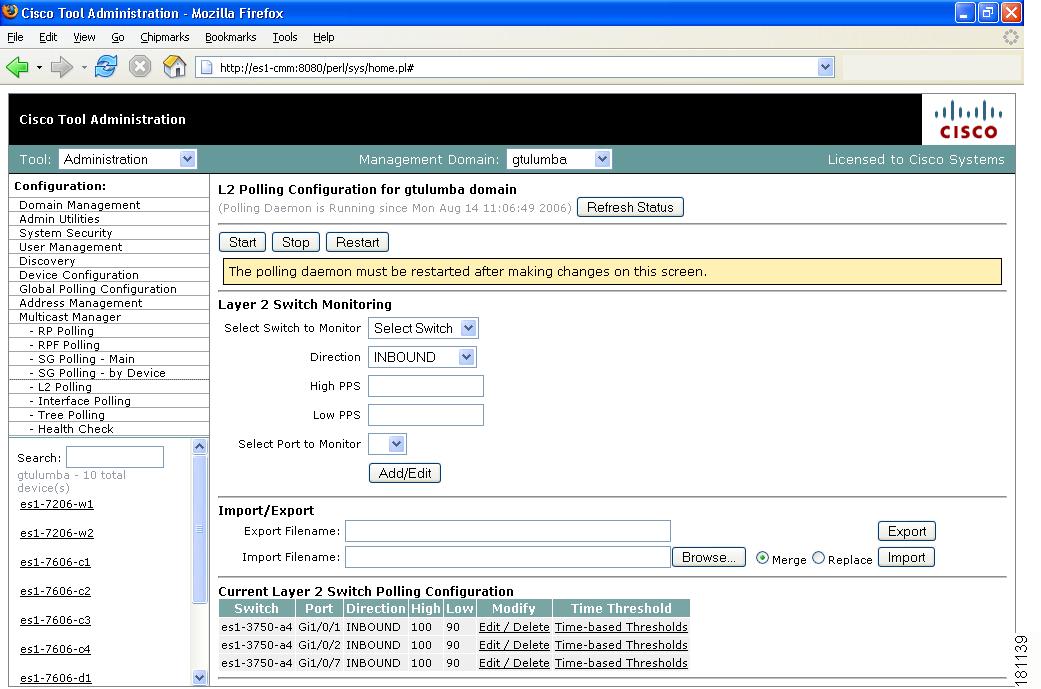
L2 Polling
You can add Layer 2 switches to the CMM individually, or you can import a list (see Adding Layer 2 Switches to Discovery). The CMM can monitor the total number of multicast packets inbound and/or outbound from any Layer 2 port.
You can also configure up to 50 different time of day thresholds for each port.
Figure 2-20 L2 Polling Configuration
The Current Layer 2 Switch Polling Configuration section shows you all monitored switches and ports in a tabular format.
•
•
Each time a port exceeds a threshold, a trap is sent and a report is generated.
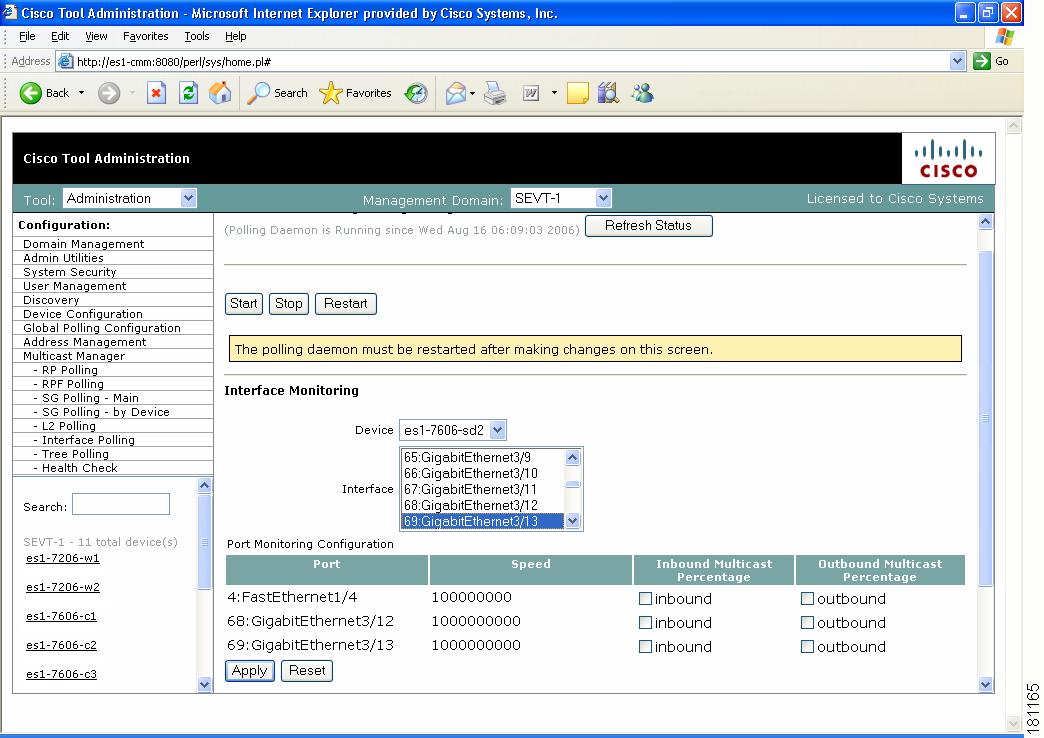
Interface Polling
The CMM can poll any interface on a router and calculate the percentage of bandwidth used by multicast traffic. You can then configure a high and low threshold, and if these are exceeded, a report is generated. This information is also kept for historical purposes.
To configure multicast bandwidth interface polling:
Step 1
Step 2
Step 3
Step 4
Figure 2-21 Interface Monitoring Polling Page
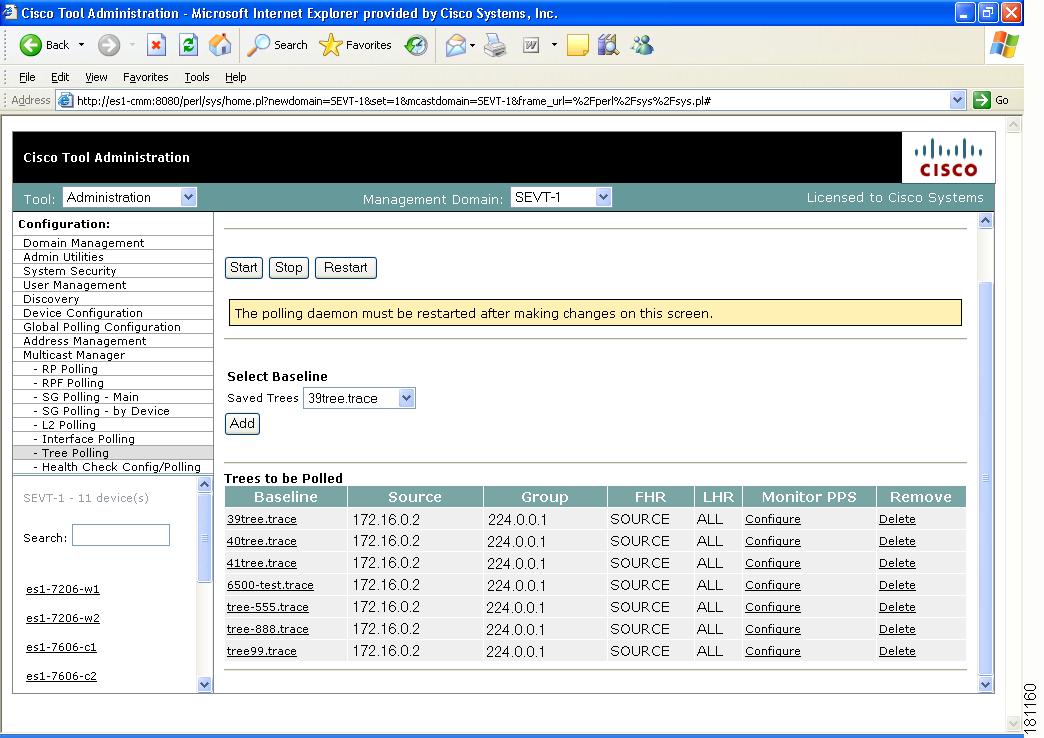
Tree Polling
Before you can monitor a tree using the Tree Polling Configuration page, you must build a multicast tree and save it to the database as a baseline (see Show All Groups).
Once saved, the trees appear in the Saved Trees list of the Tree Polling Configuration page. To monitor a tree, select the tree name, and click Add. The tree is drawn in the background for every interval that you set up for tree polling (see Configuring Global Polling). This tree is compared with the tree saved in the database. If it is different, a trap is sent, and a report generated.
Figure 2-22 Tree Polling Configuration
Trees To Be Polled
Using the Trees to be Polled table, you can:
•
•
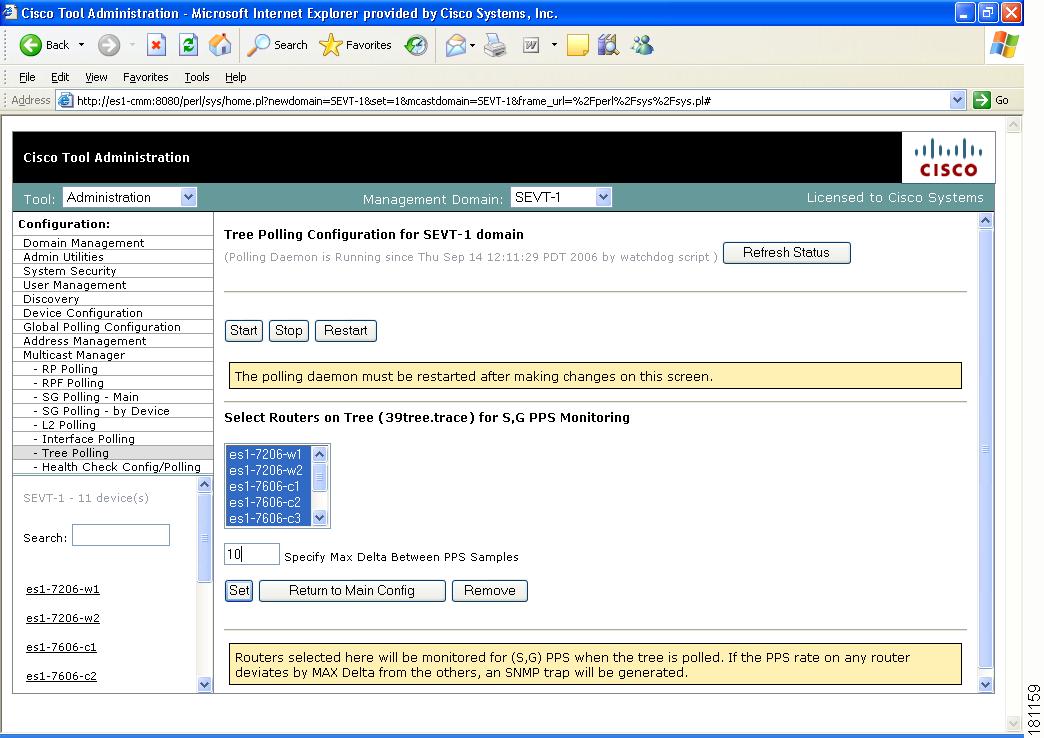
Figure 2-23 Tree Polling Configuration—Configure
•
Note
•
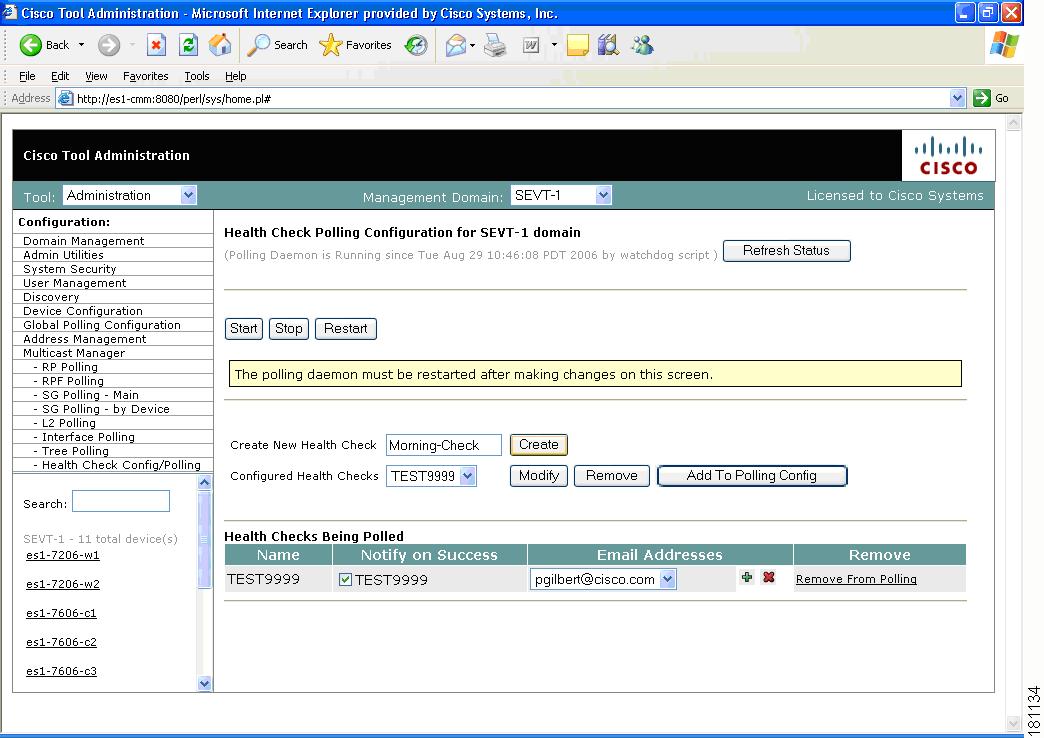
Health Check
Health checks give you an immediate status update on several key multicast network indicators, including:
•
•
•
•
You can create several health checks. Once you have created a health check, you can configure it to run at scheduled intervals, and add email alerts that summarize the results of the health check.
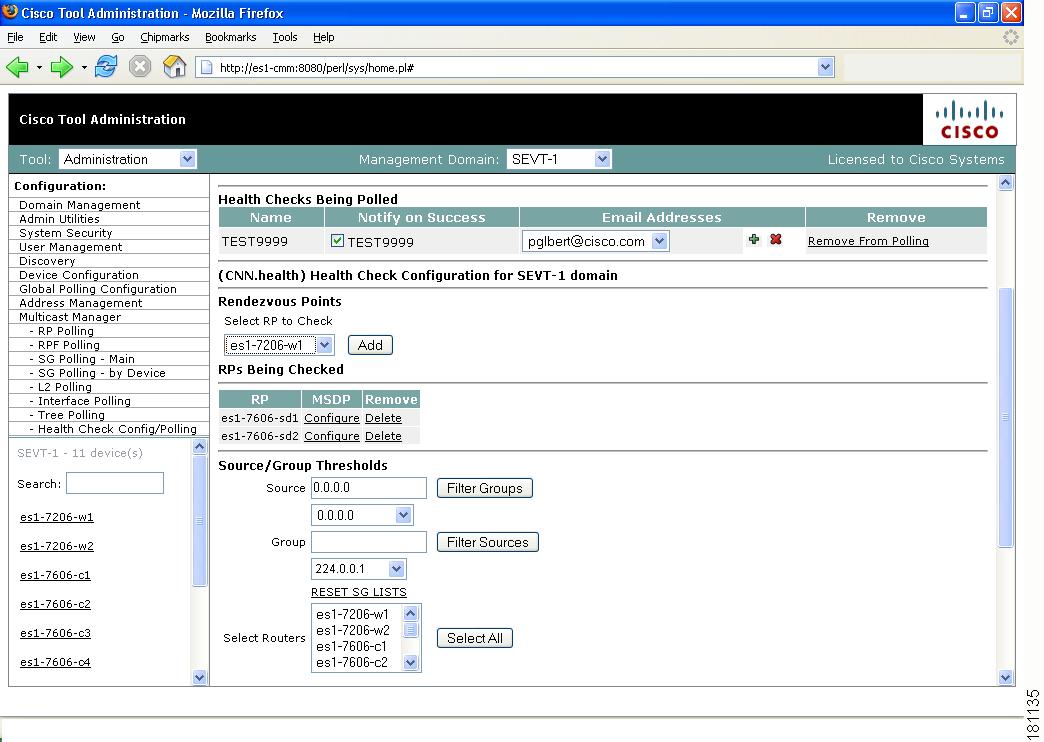
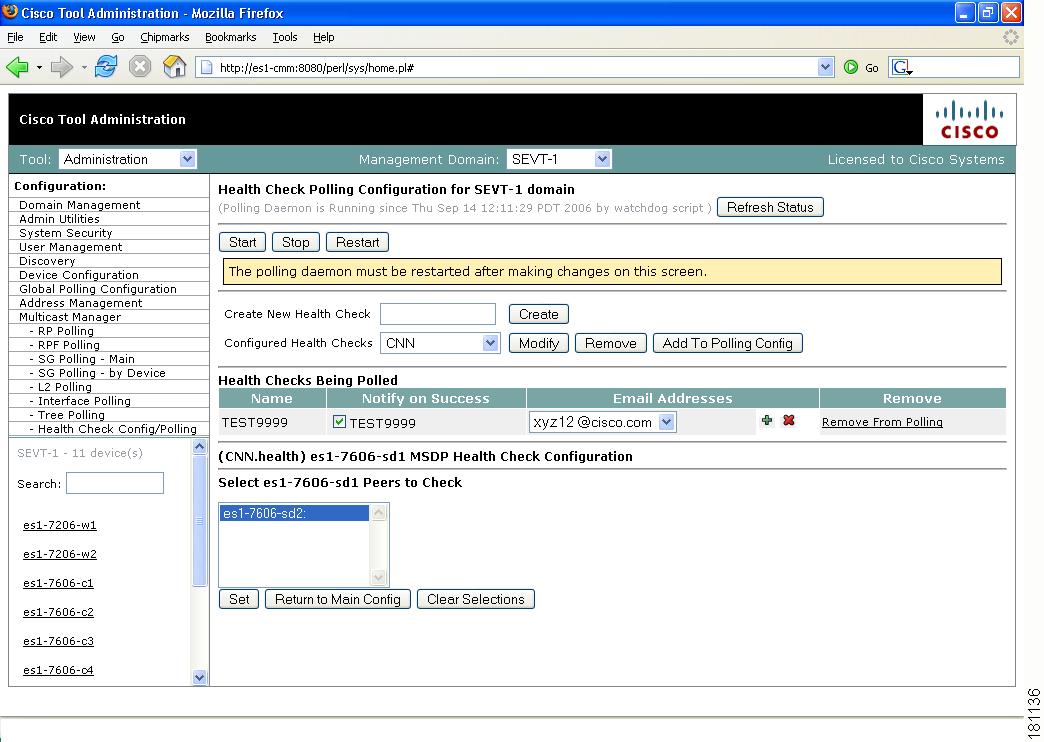
Figure 2-24 Health Check Configuration
Create New Health Check
Type a name for the health check.
Create
Creates the new health check.
Configured Health Checks
Select the health check you want to modify.
Modify
Updates the selected health check (see Modifying Health Checks).
Remove
Removes the existing health check.
Add To Polling Config
Schedules this health check to run automatically.
Name
Name of the health check.
Notify on Success
Generates an email report if the health check completes successfully.
Email Addresses
Enter the email addresses to be notified. Click + to add an email address. Click - to remove an email address.
Remove
Click Remove From Polling to stop the health check from running at scheduled intervals.
Modifying Health Checks
The Health Check Configuration—Modification section lets you modify a selected health check:
Step 1
Step 2
Step 3
Step 4
Note
Figure 2-25 Health Check Configuration—Modification
Figure 2-26 Health Check Configuration—Peers
Select the peers you want to check, then click Set. You are returned to the Health Check Configuration Modification page. Select the sources, groups and routers to check. To check the status of multicast trees, select the baseline under Forwarding Trees and click Add.