-
Cisco IOS Debug Command Reference, Release 12.2
-
About the Cisco IOS Software Documentation
-
Using Cisco IOS Software
-
Using Debug Commands
-
Conditionally Triggered Debugging
-
Commands: debug aaa accounting through debug appn trs
-
Commands: debug arap through debug clns events
-
Commands: debug clns igrp packets through debug dmsp doc-to-fax
-
Commands: debug dmsp fax-to-doc through debug ip drp
-
Commands: debug ip dvmrp through debug ip pim
-
Commands: debug ip pim atm through debug ip wccp packets
-
Commands: debug ipx ipxwan through debug lane client
-
Commands: debug lane config through debug mmoip aaa
-
Commands: debug modem through debug ppp
-
Commands: debug ppp bap through debug sdllc
-
Commands: debug serial interface through debug tacacs events
-
Commands: debug tag-switching adjacency through debug tag-switching xtagatm vc
-
Commands: debug tarp events through debug voip settlement transaction
-
Commands: debug vpdn through debug xns routing
-
Appendix A: X.25 Cause and Diagnostic Codes
-
Appendix B: ISDN Switch Types, Codes, and Values
-
 Feedback
Table Of Contents
debug ppp bap
To display general BACP transactions, use the debug ppp bap privileged EXEC command. The no form of this command disables debugging output.
debug ppp bap [error | event | negotiation]
no debug ppp bap [error | event | negotiation]
Syntax Description
Usage Guidelines
Do not use this command when memory is scarce or in very high traffic situations.
Examples
The following types of events generate the debug messages displayed in the figures in this section:
•
A dial attempt failed.
•
•
•
•
•
•
•
•
•
•
•
•
•
•
The following is sample output from the debug ppp bap command:
Router# debug ppp bapBAP Virtual-Access1: group "laudrup" (2) (multilink) without precedence createdBAP laudrup: sending CallReq, id 2, len 38 on BRI3:1 to remoteBAP Virtual-Access1: received CallRsp, id 2, len 13BAP laudrup: CallRsp, id 2, ACKBAP laudrup: attempt1 to dial 19995776677 on BRI3---> reason BAP - Multilink bundle overloadedBAP laudrup: sending StatusInd, id 2, len 44 on Virtual-Access1 to remoteBAP Virtual-Access1: received StatusRsp, id 2, len 1BAP laudrup: StatusRsp, id 2, ACKTable 154 describes some basic information about the group, the events, and the sent-message details.
The debug ppp bap event command might show state transitions and protocol actions, in addition to the basic debug ppp bap command.
The following is sample output from the debug ppp bap event command:
Router# debug ppp bap eventBAP laudrup: Idle --> AddWaitBAP laudrup: AddWait --> AddPendingBAP laudrup: AddPending --> IdleThe following is sample output from the debug ppp bap event command:
Router# debug ppp bap eventPeer does not support a message typeNo response to a particular requestNo response to all request retransmissionsNot configured to initiate link additionExpected action by peer has not occurredExceeded number of retriesNo links available to call outUnable to provide phone numbers for callbackMaximum number of links in the groupMinimum number of links in the groupUnable to process link addition at presentUnable to process link removal at presentNot configured/unable to initiate link removalLink addition completed notificationLink addition failed notificationDetermination of location of the group configLink with specified discriminator not in groupLink removal failedCall failure with statusFailed to dial specified numberDiscarding retransmissionUnable to find received identifierReceived StatusInd when no call pendingDiscarding message with no phone deltaUnable to send message in particular stateReceived a zero identifierRequest has precedenceThe error messages displayed might be added to the basic output when the debug ppp bap error command is used. Because the errors are very rare, you might never see these messages.
Router# debug ppp bap errorUnable to find appropriate request for received responseInvalid message type of queueReceived request is not part of the groupAdd link attempt failed to locate groupRemove link attempt failed to locate groupUnable to inform peer of link additionChanging of precedence cannot locate groupReceived short header/illegal length/short packetInvalid configuration information lengthUnable to NAK incomplete optionsUnable to determine current number of linksNo interface list to dial onAttempt to send invalid dataLocal link discriminator is not in groupReceived response type is incorrect for identifierThe messages displayed might be added to the basic output when the debug ppp bap negotiation command is used:
Router# debug ppp bap negotiationBAP laudrup: adding link speed 64 kbps for type 0x1 len 5BAP laudrup: adding reason "User initiated addition", len 25BAP laudrup: CallRsp, id 4, ACKBAP laudrup: link speed 64 kbps for types 0x1, len 5 (ACK)BAP laudrup: phone number "1: 0 2: ", len 7 (ACK)BAP laudrup: adding call status 0, action 0 len 4BAP laudrup: adding 1 phone numbers "1: 0 2: " len 7BAP laudrup: adding reason "Successfully added link", len 25BAP laudrup: StatusRsp, id 4, ACKAdditional negotiation messages might also be displayed for the following:
Received BAP messageSending messageDecode individual options for send/receiveNotification of invalid optionsThe following shows additional reasons for a particular BAP action that might be displayed in an "adding reason" line of the debug ppp bap negotiation command output:
"Outgoing add request has precedence""Outgoing remove request has precedence""Unable to change request precedence""Unable to determine valid phone delta""Attempting to add link""Link addition is pending""Attempting to remove link""Link removal is pending""Precedence of peer marked CallReq for no action""Callback request rejected due to configuration""Call request rejected due to configuration""No links of specified type(s) available""Drop request disallowed due to configuration""Discriminator is invalid""No response to call requests""Successfully added link""Attempt to dial destination failed""No interfaces present to dial out""No dial string present to dial out""Mandatory options incomplete""Load has not exceeded threshold""Load is above threshold""Currently attempting to dial destination""No response to CallReq from race condition"Table 155 describes the reasons for a BACP Negotiation Action.
debug ppp multilink fragments
To display information about individual multilink fragments and important multilink events, use the debug ppp multilink fragments privileged EXEC command. The no form of this command disables debugging output.
debug ppp multilink fragments
no debug ppp multilink fragments
Syntax Description
This command has no arguments or keywords.
Usage Guidelines
Caution
Examples
The following is sample output from the debug ppp multilink fragments command when used with the ping EXEC command. The debug output indicates that a multilink PPP packet on interface BRI 0 (on the B channel) is an input (I) or output (O) packet. The output also identifies the sequence number of the packet and the size of the fragment.
Router# debug ppp multilink fragmentsRouter# ping 7.1.1.7Type escape sequence to abort.Sending 5, 100-byte ICMP Echos to 7.1.1.7, timeout is 2 seconds:!!!!!Success rate is 100 percent (5/5), round-trip min/avg/max = 32/34/36 msRouter#2:00:28: MLP BRI0: B-Channel 1: O seq 80000000: size 582:00:28: MLP BRI0: B-Channel 2: O seq 40000001: size 592:00:28: MLP BRI0: B-Channel 2: I seq 40000001: size 592:00:28: MLP BRI0: B-Channel 1: I seq 80000000: size 582:00:28: MLP BRI0: B-Channel 1: O seq 80000002: size 582:00:28: MLP BRI0: B-Channel 2: O seq 40000003: size 592:00:28: MLP BRI0: B-Channel 2: I seq 40000003: size 592:00:28: MLP BRI0: B-Channel 1: I seq 80000002: size 582:00:28: MLP BRI0: B-Channel 1: O seq 80000004: size 582:00:28: MLP BRI0: B-Channel 2: O seq 40000005: size 592:00:28: MLP BRI0: B-Channel 2: I seq 40000005: size 592:00:28: MLP BRI0: B-Channel 1: I seq 80000004: size 582:00:28: MLP BRI0: B-Channel 1: O seq 80000006: size 582:00:28: MLP BRI0: B-Channel 2: O seq 40000007: size 592:00:28: MLP BRI0: B-Channel 2: I seq 40000007: size 592:00:28: MLP BRI0: B-Channel 1: I seq 80000006: size 582:00:28: MLP BRI0: B-Channel 1: O seq 80000008: size 582:00:28: MLP BRI0: B-Channel 2: O seq 40000009: size 592:00:28: MLP BRI0: B-Channel 2: I seq 40000009: size 592:00:28: MLP BRI0: B-Channel 1: I seq 80000008: size 58debug ppp multilink events
To display information about events affecting multilink groups established for BACP, use the debug ppp multilink events privileged EXEC command. The no form of this command disables debugging output.
debug ppp multilink events
no debug ppp multilink events
Syntax Description
This command has no arguments or keywords.
Usage Guidelines
Caution
Examples
The following is sample output from the debug ppp multilink events command:
Router# debug ppp multilink eventsMLP laudrup: established BAP group 4 on Virtual-Access1, physical BRI3:1MLP laudrup: removed BAP group 4Other event messages include the following:
Unable to find bundle for BAP group identifierUnable to find physical interface to start BAPUnable to create BAP groupAttempt to start BACP when inactive or runningAttempt to start BACP on non-MLP interfaceLink protocol has gone down, removing BAP groupLink protocol has gone down, BAP not running or presentTable 156 describes the significant fields shown in the display.
debug priority
To display priority queueing output, use the debug priority privileged EXEC command. Use the no form of this command to disable debugging output.
debug priority
no debug priority
Syntax Description
This command has no arguments or keywords.
Examples
The following example shows how to enable priority queueing output:
Router# debug priorityPriority output queueing debugging is onThe following is sample output from the debug priority command when the Frame Relay PVC Interface Priority Queueing (FR PIPQ) feature is configured on serial interface 0:
Router# debug priority00:49:05:PQ:Serial0 dlci 100 -> high00:49:05:PQ:Serial0 output (Pk size/Q 24/0)00:49:05:PQ:Serial0 dlci 100 -> high00:49:05:PQ:Serial0 output (Pk size/Q 24/0)00:49:05:PQ:Serial0 dlci 100 -> high00:49:05:PQ:Serial0 output (Pk size/Q 24/0)00:49:05:PQ:Serial0 dlci 200 -> medium00:49:05:PQ:Serial0 output (Pk size/Q 24/1)00:49:05:PQ:Serial0 dlci 300 -> normal00:49:05:PQ:Serial0 output (Pk size/Q 24/2)00:49:05:PQ:Serial0 dlci 400 -> low00:49:05:PQ:Serial0 output (Pk size/Q 24/3)Related Commands
debug proxy h323 statistics
To enable proxy RTP statistics, use the debug proxy h323 statistics privileged EXEC command. The no form of this command disables the proxy RTP statistics.
debug proxy h323 statistics
no debug proxy h323 statistics
Syntax Description
This command has no arguments or keywords.
Command History
Usage Guidelines
Enter the show proxy h323 detail-call EXEC command to see the statistics.
debug pvcd
To display the PVC Discovery events and ILMI MIB traffic used when discovering PVCs, use the debug pvcd privileged EXEC command. The no form of this command disables debugging output.
debug pvcd
no debug pvcd
Syntax Description
This command has no arguments or keywords.
Usage Guidelines
This command is primarily used by Cisco technical support representatives.
Examples
The following is sample output from the debug pvcd command:
Router# debug pvcdPVCD: PVCD enabled w/ SubifPVCD(2/0): clearing event queuePVCD: 2/0 Forgetting discovered PVCs...PVCD: Removing all dynamic PVCs on 2/0PVCD: Restoring MIXED PVCs w/ default parms on 2/0PVCD: Marking static PVCs as UNKNWN on 2/0PVCD: Marking static PVC 0/50 as UNKNWN on 2/0 ...PVCD: Trying to discover PVCs on 2/0...PVCD: pvcd_discoverPVCsPVCD: pvcd_pingPVCD: fPortEntry.5.0 = 2PVCD: pvcd_getPeerVccTableSizePVCD: fLayerEntry.5.0 = 13PVCD:end allocating VccTable size 13PVCD: pvcd_getPeerVccTablePVCD:******* 2/0: getNext on fVccEntry = NULL TYPE/VALUE numFileds = 19 numVccs = 13PVCD: Creating Dynamic PVC 0/33 on 2/0PVCD(2/0): Before _update_inheritance() and _create_pvc() VC 0/33: DYNAMICPVCD: After _create_pvc() VC 0/33: DYNAMIC0/33 on 2/0 : UBR PCR = -1PVCD: Creating Dynamic PVC 0/34 on 2/0PVCD(2/0): Before _update_inheritance() and _create_pvc() VC 0/34: DYNAMICPVCD: After _create_pvc() VC 0/34: DYNAMIC0/34 on 2/0 : UBR PCR -1PVCD: Creating Dynamic PVC 0/44 on 2/0PVCD(2/0): Before _update_inheritance() and _create_pvc() VC 0/44: DYNAMICPVCD: After _create_pvc() VC 0/44: DYNAMIC0/44 on 2/0 : UBR PCR = -1PVCD: PVC 0/50 with INHERITED_QOSTYPEPVCD: _oi_state_change ( 0/50, 1 = ILMI_VC_UP )PVCD: Creating Dynamic PVC 0/60 on 2/0PVCD(2/0): Before _update_inheritance() and _create_pvc() VC 0/60: DYNAMICPVCD: After _create_pvc() VC 0/60: DYNAMIC0/60 on 2/0 : UBR PCR = -1PVCD: Creating Dynamic PVC 0/80 on 2/0PVCD(2/0): Before _update_inheritance() and _create_pvc() VC 0/80: DYNAMICPVCD: After _create_pvc() VC 0/80: DYNAMIC0/80 on 2/0 : UBR PCR = -1PVCD: Creating Dynamic PVC 0/99 on 2/0debug qllc error
To display quality link line control (QLLC) errors, use the debug qllc error privileged EXEC command. The no form of this command disables debugging output.
debug qllc error
no debug qllc error
Syntax Description
This command has no arguments or keywords.
Usage Guidelines
This command helps you track down errors in the QLLC interactions with X.25 networks. Use the debug qllc error command in conjunction with the debug x25 all command to see the connection. The data shown by this command only flows through the router on the X.25 connection. Some forms of this command can generate a substantial amount of output and network traffic.
Examples
The following is sample output from the debug qllc error command:
Router# debug qllc error%QLLC-3-GENERRMSG: qllc_close - bad qllc pointer Caller 00407116 Caller 00400BD2QLLC 4000.1111.0002: NO X.25 connection. Discarding XID and calling outThe following line indicates that the QLLC connection was closed:
%QLLC-3-GENERRMSG: qllc_close - bad qllc pointer Caller 00407116 Caller 00400BD2The following line shows the virtual MAC address of the failed connection:
QLLC 4000.1111.0002: NO X.25 connection. Discarding XID and calling outdebug qllc event
To enable debugging of QLLC events, use the debug qllc event privileged EXEC command. The no form of this command disables debugging output.
debug qllc event
no debug qllc event
Syntax Description
This command has no arguments or keywords.
Usage Guidelines
Use the debug qllc event command to display primitives that might affect the state of a QLLC connection. An example of these events is the allocation of a QLLC structure for a logical channel indicator when an X.25 call has been accepted with the QLLC call user data. Other examples are the receipt and transmission of LAN explorer and XID frames.
Examples
The following is sample output from the debug qllc event command:
Router# debug qllc eventQLLC: allocating new qllc lci 9QLLC: tx POLLING TEST, da 4001.3745.1088, sa 4000.1111.0001QLLC: rx explorer response, da 4000.1111.0001, sa c001.3745.1088, rif 08B0.1A91.1901.A040QLLC: gen NULL XID, da c001.3745.1088, sa 4000.1111.0001, rif 0830.1A91.1901.A040, dsap 4, ssap 4QLLC: rx XID response, da 4000.1111.0001, sa c001.3745.1088, rif 08B0.1A91.1901.A040The following line indicates that a new QLLC data structure has been allocated:
QLLC: allocating new qllc lci 9The following lines show transmission and receipt of LAN explorer or test frames:
QLLC: tx POLLING TEST, da 4001.3745.1088, sa 4000.1111.0001QLLC: rx explorer response, da 4000.1111.0001, sa c001.3745.1088, rif 08B0.1A91.1901.A040The following lines show XID events:
QLLC: gen NULL XID, da c001.3745.1088, sa 4000.1111.0001, rif 0830.1A91.1901.A040, dsap 4,
ssap 4
QLLC: rx XID response, da 4000.1111.0001, sa c001.3745.1088, rif 08B0.1A91.1901.A040debug qllc packet
To display QLLC events and QLLC data packets, use the debug qllc packet privileged EXEC command. The no form of this command disables debugging output.
debug qllc packet
no debug qllc packet
Syntax Description
This command has no arguments or keywords.
Usage Guidelines
This command helps you to track down errors in the QLLC interactions with X.25 networks. The data shown by this command only flows through the router on the X25 connection. Use the debug qllc packet command in conjunction with the debug x25 all command to see the connection and the data that flows through the router.
Examples
The following is sample output from the debug qllc packet command:
Router# debug qllc packet14:38:05: Serial2/5 QLLC I: Data Packet.-RSP 9 bytes.14:38:07: Serial2/6 QLLC I: Data Packet.-RSP 112 bytes.14:38:07: Serial2/6 QLLC O: Data Packet. 128 bytes.14:38:08: Serial2/6 QLLC I: Data Packet.-RSP 9 bytes.14:38:08: Serial2/6 QLLC I: Data Packet.-RSP 112 bytes.14:38:08: Serial2/6 QLLC O: Data Packet. 128 bytes.14:38:08: Serial2/6 QLLC I: Data Packet.-RSP 9 bytes.14:38:12: Serial2/5 QLLC I: Data Packet.-RSP 112 bytes.14:38:12: Serial2/5 QLLC O: Data Packet. 128 bytes.The following lines indicate that a packet was received on the interfaces:
14:38:05: Serial2/5 QLLC I: Data Packet.-RSP 9 bytes.14:38:07: Serial2/6 QLLC I: Data Packet.-RSP 112 bytes.The following lines show that a packet was sent on the interfaces:
14:38:07: Serial2/6 QLLC O: Data Packet. 128 bytes.14:38:12: Serial2/5 QLLC O: Data Packet. 128 bytes.debug qllc state
To enable debugging of QLLC events, use the debug qllc state privileged EXEC command. The no form of this command disables debugging output.
debug qllc state
no debug qllc state
Syntax Description
This command has no arguments or keywords.
Usage Guidelines
Use the debug qllc state command to show when the state of a QLLC connection has changed. The typical QLLC connection goes from states ADM to SETUP to NORMAL. The NORMAL state indicates that a QLLC connection exists and is ready for data transfer.
Examples
The following is sample output from the debug qllc state command:
Router# debug qllc stateSerial2 QLLC O: QSM-CMDSerial2: X25 O D1 DATA (5) Q 8 lci 9 PS 4 PR 3QLLC: state ADM -> SETUPSerial2: X25 I D1 RR (3) 8 lci 9 PR 5Serial2: X25 I D1 DATA (5) Q 8 lci 9 PS 3 PR 5Serial2 QLLC I: QUA-RSPQLLC: addr 00, ctl 73QLLC: qsetupstate: recvd qua rspQLLC: state SETUP -> NORMALThe following line indicates that a QLLC connection attempt is changing state from ADM to SETUP:
QLLC: state ADM -> SETUPThe following line indicates that a QLLC connection attempt is changing state from SETUP to NORMAL:
QLLC: state SETUP -> NORMALdebug qllc timer
To display QLLC timer events, use the debug qllc timer privileged EXEC command. The no form of this command disables debugging output.
debug qllc timer
no debug qllc timer
Syntax Description
This command has no arguments or keywords.
Usage Guidelines
The QLLC process periodically cycles and checks status of itself and its partner. If the partner is not found in the desired state, a LAPB primitive command is re-sent until the partner is in the desired state or the timer expires.
Examples
The following is sample output from the debug qllc timer command:
Router# debug qllc timer14:27:24: Qllc timer lci 257, state ADM retry count 0 Caller 00407116 Caller 00400BD214:27:34: Qllc timer lci 257, state NORMAL retry count 014:27:44: Qllc timer lci 257, state NORMAL retry count 114:27:54: Qllc timer lci 257, state NORMAL retry count 1The following line of output shows the state of a QLLC partner on a given X.25 logical channel identifier:
14:27:24: Qllc timer lci 257, state ADM retry count 0 Caller 00407116 Caller 00400BD2Other messages are informational and appear every ten seconds.
debug qllc x25
To display X.25 packets that affect a QLLC connection, use the debug qllc x25 privileged EXEC command. The no form of this command disables debugging output.
debug qllc x25
no debug qllc x25
Syntax Description
This command has no arguments or keywords.
Usage Guidelines
This command is helpful to track down errors in the QLLC interactions with X.25 networks. Use the debug qllc x25 command in conjunction with the debug x25 events or debug x25 all commands to see the X.25 events between the router and its partner.
Examples
The following is sample output from the debug qllc x25 command:
Router# debug qllc x2515:07:23: QLLC X25 notify lci 257 event 115:07:23: QLLC X25 notify lci 257 event 515:07:34: QLLC X25 notify lci 257 event 3 Caller 00407116 Caller 00400BD215:07:35: QLLC X25 notify lci 257 event 4Table 157 describes fields of output.
debug radius
To display information associated with RADIUS, use the debug radius privileged EXEC command. The no form of this command disables debugging output.
debug radius
no debug radius
Syntax Description
This command has no arguments or keywords.
Usage Guidelines
RADIUS is a distributed security system that secures networks against unauthorized access. Cisco supports RADIUS under the authentication, authorization, and accounting (AAA) security system.
Use the debug aaa authentication command to get a high-level view of login activity. When RADIUS is used on the router, you can use the debug radius command for more detailed debugging information.
Examples
The following is sample output from the debug aaa authentication command for a RADIUS login attempt that failed. The information indicates that RADIUS is the authentication method used.
Router# debug aaa authentication14:02:55: AAA/AUTHEN (164826761): Method=RADIUS14:02:55: AAA/AUTHEN (164826761): status = GETPASS14:03:01: AAA/AUTHEN/CONT (164826761): continue_login14:03:01: AAA/AUTHEN (164826761): status = GETPASS14:03:01: AAA/AUTHEN (164826761): Method=RADIUS14:03:04: AAA/AUTHEN (164826761): status = FAILThe following is partial sample output from the debug radius command that shows a login attempt that failed because of a key mismatch (that is, a configuration problem):
Router# debug radius13:55:19: Radius: IPC Send 0.0.0.0:1645, Access-Request, id 0x7, len 5713:55:19: Attribute 4 6 AC150E5A13:55:19: Attribute 5 6 0000000A13:55:19: Attribute 1 7 62696C6C13:55:19: Attribute 2 18 19D6648313:55:22: Radius: Received from 171.69.1.152:1645, Access-Reject, id 0x7, len 2013:55:22: Radius: Reply for 7 fails decryptThe following is partial sample output from the debug radius command that shows a successful login attempt as indicated by an Access-Accept message:
Router# debug radius13:59:02: Radius: IPC Send 0.0.0.0:1645, Access-Request, id 0xB, len 5613:59:02: Attribute 4 6 AC150E5A13:59:02: Attribute 5 6 0000000A13:59:02: Attribute 1 6 62696C6C13:59:02: Attribute 2 18 0531FEA313:59:04: Radius: Received from 171.69.1.152:1645, Access-Accept, id 0xB, len 2613:59:04: Attribute 6 6 00000001The following is partial sample output from the debug radius command that shows an unsuccessful login attempt as indicated by the Access-Reject message:
Router# debug radius13:57:56: Radius: IPC Send 0.0.0.0:1645, Access-Request, id 0xA, len 5713:57:56: Attribute 4 6 AC150E5A13:57:56: Attribute 5 6 0000000A13:57:56: Attribute 1 7 62696C6C13:57:56: Attribute 2 18 49C28F6C13:57:59: Radius: Received from 171.69.1.152:1645, Access-Reject, id 0xA, len 20Related Commands
Displays information on accountable events as they occur.
Displays information on AAA/TACACS+ authentication.
debug ras
To display RAS events, use the debug ras privileged EXEC command. The no form of this command disables debugging output.
debug ras
no debug ras
Syntax Description
This command has no arguments or keywords.
Command History
Examples
The following examples are sample output from the debug ras command.
Proxy Details Trace with RAS Trace Enabled
In the following reports, the proxy registers with the gatekeeper and the trace is collected on the proxy with RAS trace enabled. A report is taken from a proxy and a gatekeeper.
Router# debug rasH.323 RAS Messages debugging is onRouter#RASlib::ras_sendto: msg length 34 sent to 40.0.0.33RASLib::RASSendGRQ: GRQ sent to 40.0.0.33RASLib::RASRecvData: successfully rcvd message of length 45 from 40.0.0.33:1719RASLib::RASRecvData: GCF rcvd from [40.0.0.33:1719] on sock[0x67E570]RASlib::ras_sendto: msg length 76 sent to 40.0.0.33RASLib::RASSendRRQ: RRQ sent to 40.0.0.33RASLib::RASRecvData: successfully rcvd message of length 81 from 40.0.0.33:1719RASLib::RASRecvData: RCF rcvd from [40.0.0.33:1719] on sock [0x67E570]Router# debug rasH.323 RAS Messages debugging is onRouter#RASLib::RASRecvData: successfully rcvd message of length 34 from 101. 0.0.1:24999RASLib::RASRecvData: GRQ rcvd from [101.0.0.1:24999] on sock[5C8D28]RASlib::ras_sendto: msg length 45 sent to 40.0.0.31RASLib::RASSendGCF: GCF sent to 40.0.0.31RASLib::RASRecvData: successfully rcvd message of length 76 from 101.0.0.1:24999RASLib::RASRecvData: RRQ rcvd from [101.0.0.1:24999] on sock [0x5C8D28]RASlib::ras_sendto: msg length 81 sent to 40.0.0.31RASLib::RASSendRCF: RCF sent to 40.0.0.31Gatekeeper Trace with RAS Turned On, Call Being Established
This report shows a proxy call scenario. A trace is collected on a gatekeeper with RAS turned on. The call is being established.
Router# debug rasH.323 RAS Messages debugging is onRouter# RASLib::RASRecvData: successfully rcvd message of length 116 from 50.0.0.12:1700RASLib::RASRecvData: ARQ rcvd from [50.0.0.12:1700] on sock [0x5C8D28]RASLib::RAS_WK_TInit: ipsock [0x68BD30] setup successfulRASlib::ras_sendto: msg length 80 sent to 102.0.0.1RASLib::RASSendLRQ: LRQ sent to 102.0.0.1RASLib::RASRecvData: successfully rcvd message of length 111 from 102.0.0.1:1719RASLib::RASRecvData: LCF rcvd from [102.0.0.1:1719] on sock [0x68BD30]RASLib::parse_lcf_nonstd: LCF Nonstd decode succeeded, remlen = 0RASlib::ras_sendto: msg length 16 sent to 50.0.0.12RASLib::RASSendACF: ACF sent to 50.0.0.12RASLib::RASRecvData: successfully rcvd message of length 112 from 101.0.0.1:24999RASLib::RASRecvData: ARQ rcvd from [101.0.0.1:24999] on sock [0x5C8D28]RASlib::ras_sendto: msg length 93 sent to 40.0.0.31RASLib::RASSendACF: ACF sent to 40.0.0.31RASLib::RASRecvData: successfully rcvd message of length 123 from 101.0.0.1:24999RASLib::RASRecvData: ARQ rcvd from [101.0.0.1:24999] on sock [0x5C8D28]RASlib::ras_sendto: msg length 16 sent to 40.0.0.31RASLib::RASSendACF: ACF sent to 40.0.0.31Gatekeeper Trace with RAS Turned On, Call Being Torn Down
This report shows two proxy call scenarios. A trace is collected on the gatekeeper with RAS turned on. The call is being torn down.
Router# debug rasH.323 RAS Messages debugging is onRouter#RASlib::ras_sendto: msg length 3 sent to 40.0.0.31RASLib::RASSendDCF: DCF sent to 40.0.0.31RASLib::RASRecvData: successfully rcvd message of length 55 from 101.0.0.1:24999RASLib::RASRecvData: DRQ rcvd from [101.0.0.1:24999] on sock [0x5C8D28]RASlib::ras_sendto: msg length 3 sent to 40.0.0.31RASLib::RASSendDCF: DCF sent to 40.0.0.31RASLib::RASRecvData: successfully rcvd message of length 55 from 50.0.0.12:1700RASLib::RASRecvData: DRQ rcvd from [50.0.0.12:1700] on sock [0x5C8D28]RASlib::ras_sendto: msg length 3 sent to 50.0.0.12RASLib::RASSendDCF: DCF sent to 50.0.0.12Source Proxy Trace with RAS Turned On, Call Being Established
This report shows two proxy call scenarios. A trace is collected on the source proxy with RAS turned on. The call is being established.
Router# debug rasH.323 RAS Messages debugging is onRouter# RASlib::ras_sendto: msg length 112 sent to 40.0.0.33RASLib::RASSendARQ: ARQ sent to 40.0.0.33RASLib::RASRecvData: successfully rcvd message of length 93 from 40.0.0.33:1719RASLib::RASRecvData: ACF rcvd from [40.0.0.33:1719] on sock [0x67E570]RASLib::parse_acf_nonstd: ACF Nonstd decode succeeded, remlen = 0RASlib::ras_sendto: msg length 123 sent to 40.0.0.33RASLib::RASSendARQ: ARQ sent to 40.0.0.33RASLib::RASRecvData: successfully rcvd message of length 16 from 40.0.0.33:1719RASLib::RASRecvData: ACF rcvd from [40.0.0.33:1719] on sock [0x67E570]Source Proxy Trace with RAS Turned On, Call Being Torn Down
This report shows two proxy call scenarios. A trace is collected on the source proxy with RAS turned on. The call is being torn down.
Router# debug rasH.323 RAS Messages debugging is onRouter# RASLib::RASSendDRQ: DRQ sent to 40.0.0.33RASlib::ras_sendto: msg length 55 sent to 40.0.0.33RASLib::RASSendDRQ: DRQ sent to 40.0.0.33RASLib::RASRecvData: successfully rcvd message of length 3 from 40.0.0.33:1719RASLib::RASRecvData: DCF rcvd from [40.0.0.33:1719] on sock [0x67E570]RASLib::RASRecvData: successfully rcvd message of length 3 from 40.0.0.33:1719RASLib::RASRecvData: DCF rcvd from [40.0.0.33:1719] on sock [0x67E570]debug redundancy
To enable the display of events for troubleshooting redundant DSCs, use the debug redundancy privileged EXEC command. Use the no form of this command to turn off the command.
debug redundancy {all | ui | clk | hub}
no debug redundancy {all | ui | clk | hub}
Syntax Description
Defaults
The command is disabled by default.
Command History
Usage Guidelines
This command is issued from the router shelf console.
Examples
The output from this command consists of event announcements that can be used by authorized troubleshooting personnel.
debug resource-pool
To see and trace resource pool management activity, use the debug resource-pool privileged EXEC command. Use the no form of this command to disable this function.
debug resource-pool
no debug resource-pool
Syntax Description
This command has no arguments or keywords.
Defaults
Disabled
Command History
Usage Guidelines
Enter the debug resource-pool command to see and trace resource pool management activity.
You can use the resource pool state to isolate problems. For example, if a call fails authorization in the RM_RES_AUTHOR state, investigate further with AAA authorization debugs to determine whether the problem lies in the resource-pool manager, AAA, or dispatcher.
Examples
The following example shows different instances where you can use the debug resource-pool command:
Router# debug resource-poolRM general debugging is onRouter# show debugGeneral OS:AAA Authorization debugging is onResource Pool:resource-pool general debugging is onRouter #Router #ping 21.1.1.10Type escape sequence to abort.Sending 5, 100-byte ICMP Echos to 21.1.1.10, timeout is 2 seconds:*Jan 8 00:10:30.358: RM state:RM_IDLE event:DIALER_INCALL DS0:0:0:0:1*Jan 8 00:10:30.358: RM: event incoming call/* An incoming call is received by RM */*Jan 8 00:10:30.358: RM state:RM_DNIS_AUTHOR event:RM_DNIS_RPM_REQUESTDS0:0:0:0:1/* Receives an event notifying to proceed with RPM authorization whilein DNIS authorization state */*Jan 8 00:10:30.358: RM:RPM event incoming call*Jan 8 00:10:30.358: RPM profile cp1 found/* A customer profile "cp1" is found matching for the incoming call, inthe local database */*Jan 8 00:10:30.358: RM state:RM_RPM_RES_AUTHORevent:RM_RPM_RES_AUTHOR_SUCCESS DS0:0:0:0:1/* Resource authorization success event received while in resourceauthorization state*/*Jan 8 00:10:30.358: Allocated resource from res_group isdn1*Jan 8 00:10:30.358: RM:RPM profile "cp1", allocated resource "isdn1"successfully*Jan 8 00:10:30.358: RM state:RM_RPM_RES_ALLOCATINGevent:RM_RPM_RES_ALLOC_SUCCESS DS0:0:0:0:1/* Resource allocation sucess event received while attempting toallocate a resource */*Jan 8 00:10:30.358: Se0:1 AAA/ACCT/RM: doing resource-allocated(local) (nothing to do)*Jan 8 00:10:30.366: %LINK-3-UPDOWN: Interface Serial0:1, changed stateto up*Jan 8 00:10:30.370: %LINK-3-UPDOWN: Interface Serial0:1, changed stateto down*Jan 8 00:10:30.570: Se0:1 AAA/ACCT/RM: doing resource-update (local)cp1 (nothing to do)*Jan 8 00:10:30.578: %LINK-3-UPDOWN: I.nterface Serial0:0, changedstate to up*Jan 8 00:10:30.582: %DIALER-6-BIND: Interface Serial0:0 bound toprofile Dialer0...Success rate is 0 percent (0/5)Router #*Jan 8 00:10:36.662: %ISDN-6-CONNECT: Interface Serial0:0 is nowconnected to 71017*Jan 8 00:10:52.990: %DIALER-6-UNBIND: Interface Serial0:0 unbound fromprofile Dialer0*Jan 8 00:10:52.990: %ISDN-6-DISCONNECT: Interface Serial0:0disconnected from 71017 , call lasted 22 seconds*Jan 8 00:10:53.206: %LINK-3-UPDOWN: Interface Serial0:0, changed stateto down*Jan 8 00:10:53.206: %ISDN-6-DISCONNECT: Interface Serial0:1disconnected from unknown , call lasted 22 seconds*Jan 8 00:10:53.626: RM state:RM_RPM_RES_ALLOCATED event:DIALER_DISCONDS0:0:0:0:1/* Received Disconnect event from signalling stack for a call whichhas a resource allocated. */*Jan 8 00:10:53.626: RM:RPM event call drop/* RM processing the disconnect event */*Jan 8 00:10:53.626: Deallocated resource from res_group isdn1*Jan 8 00:10:53.626: RM state:RM_RPM_DISCONNECTINGevent:RM_RPM_DISC_ACK DS0:0:0:0:1/* An intermediate state while the DISCONNECT event is being processedby external servers, before RM goes back into IDLE state.*/
debug rif
To display information on entries entering and leaving the routing information field (RIF) cache, use the debug rif privileged EXEC command. The no form of this command disables debugging output.
debug rif
no debug rif
Syntax Description
This command has no arguments or keywords.
Usage Guidelines
In order to use the debug rif command to display traffic source-routed through an interface, fast switching of source route bridging (SRB) frames must first be disabled with the no source-bridge route-cache interface configuration command.
Examples
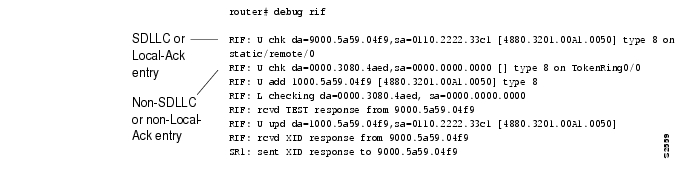
The following is sample output from the debug rif command:
The first line of output is an example of a RIF entry for an interface configured for SDLLC or Local-Ack. Table 160 describes significant fields shown in the display.
The following line of output is an example of a RIF entry for an interface that is not configured for SDLLC or Local-Ack:
RIF: U chk da=0000.3080.4aed,sa=0000.0000.0000 [] type 8 on TokenRing0/0Notice that the source address contains only zero values (0000.0000.0000), and that the RIF string is null ([ ]). The last element in the entry indicates that this route was learned from a virtual ring, rather than a real Token Ring port.
The following line shows that a new entry has been added to the RIF cache:
RIF: U add 1000.5a59.04f9 [4880.3201.00A1.0050] type 8The following line shows that a RIF cache lookup operation has taken place:
RIF: L checking da=0000.3080.4aed, sa=0000.0000.0000The following line shows that a TEST response from address 9000.5a59.04f9 was inserted into the RIF cache:
RIF: rcvd TEST response from 9000.5a59.04f9The following line shows that the RIF entry for this route has been found and updated:
RIF: U upd da=1000.5a59.04f9,sa=0110.2222.33c1 [4880.3201.00A1.0050]The following line shows that an XID response from this address was inserted into the RIF cache:
RIF: rcvd XID response from 9000.5a59.04f9The following line shows that the router sent an XID response to this address:
SR1: sent XID response to 9000.5a59.04f9Table 160, Part 1 explains the other possible lines of debug rif Command output.
Related Commands
debug route-map ipc
To display a summary of the one-way IPC messages set from the RP to the VIP about NetFlow policy routing when distributed Cisco Express Forwarding (dCEF) is enabled, use the debug route-map ipc privileged EXEC command. The no form of this command disables debugging output.
debug route-map ipc
no debug route-map ipc
Syntax Description
This command has no arguments or keywords.
Command History
Usage Guidelines
This command is especially helpful for policy routing with dCEF switching.
This command displays a summary of one-way IPC messages from the RP to the VIP about NetFlow policy routing. If you execute this command on the RP, the messages are shown as "Sent." If you execute this command on the VIP console, the IPC messages are shown as "Received."
Examples
The following is sample output of the debug route-map ipc command executed at the RP:
Router# debug route-map ipcRoutemap related IPC debugging is onRouter# configure terminalEnter configuration commands, one per line. End with CNTL/Z.Router(config)#ip cef distributedRouter(config)#^ZRouter#RM-IPC: Clean routemap config in slot 0RM-IPC: Sent clean-all-routemaps; len 12RM-IPC: Download all policy-routing related routemap config to slot 0RM-IPC: Sent add routemap test(seq:10); n_len 5; len 17RM-IPC: Sent add acl 1 of routemap test(seq:10); len 21RM-IPC: Sent add min 10 max 300 of routemap test(seq:10); len 24RM-IPC: Sent add preced 1 of routemap test(seq:10); len 17RM-IPC: Sent add tos 4 of routemap test(seq:10); len 17RM-IPC: Sent add nexthop 50.0.0.8 of routemap test(seq:10); len 20RM-IPC: Sent add default nexthop 50.0.0.9 of routemap test(seq:10); len 20RM-IPC: Sent add interface Ethernet0/0/3(5) of routemap test(seq:10); len 20RM-IPC: Sent add default interface Ethernet0/0/2(4) of routemap test(seq:10); len 20The following is sample output of the debug route-map ipc command executed at the VIP:
VIP-Slot0# debug route-map ipcRoutemap related IPC debugging is onVIP-Slot0#RM-IPC: Rcvd clean-all-routemaps; len 12RM-IPC: Rcvd add routemap test(seq:10); n_len 5; len 17RM-IPC: Rcvd add acl 1 of routemap test(seq:10); len 21RM-IPC: Rcvd add min 10 max 300 of routemap test(seq:10); len 24RM-IPC: Rcvd add preced 1 of routemap test(seq:10); len 17RM-IPC: Rcvd add tos 4 of routemap test(seq:10); len 17RP-IPC: Rcvd add nexthop 50.0.0.8 of routemap test(seq:10); len 20RP-IPC: Rcvd add default nexthop 50.0.0.9 of routemap test(seq:10); len 20RM-IPC: Rcvd add interface Ethernet0/3 of routemap tes; len 20RM-IPC: Rcvd add default interface Ethernet0/2 of routemap test(seq:10); len 20debug rtr error
To enable logging of SA Agent run-time errors, use the debug rtr error privileged EXEC command. To disable debugging output, use the no form of this command.
debug rtr error [probe]
no debug rtr error [probe]
Syntax Description:
Defaults
Logging is off.
Command History
Usage Guidelines
The debug rtr error command displays run-time errors. When a probe number other than 0 is specified, all run-time errors for that probe are displayed when the probe is active. When the probe number is 0 all run-time errors relating to the Response Time Reporter scheduler process are displayed. When no probe number is specified, all run-time errors for all active probes configured on the router and probe control are displayed.
Note
Examples
The following example shows output from the debug rtr error command. The output indicates failure because the target is not there or because the responder is not enabled on the target. All debug output for the Response Time Reporter (including the debug rtr trace command) has the format shown in Table 161.
Router# debug rtr errorMay 5 05:00:35.483: control message failure:1May 5 05:01:35.003: control message failure:1May 5 05:02:34.527: control message failure:1May 5 05:03:34.039: control message failure:1May 5 05:04:33.563: control message failure:1May 5 05:05:33.099: control message failure:1May 5 05:06:32.596: control message failure:1May 5 05:07:32.119: control message failure:1May 5 05:08:31.643: control message failure:1May 5 05:09:31.167: control message failure:1May 5 05:10:30.683: control message failure:1Table 161 describes the significant fields shown in the display.
Related Commands
debug rtr trace
To trace the execution of an SA Agent operation, use the debug rtr trace privileged EXEC command. To disable trace debugging output (but not debug rtr error output), use the no form of this command.
debug rtr trace [probe]
no debug rtr trace [probe]
Syntax Description:
Command History
Usage Guidelines
When a probe number other than 0 is specified, execution for that probe is traced. When the probe number is 0, the Response Time Reporter scheduler process is traced. When no probe number is specified, all active probes and every probe control is traced.
The debug rtr trace command also enables debug rtr error command for the specified probe. However, the no debug rtr trace command does not disable the debug rtr error command. You must manually disable the command by using the no debug rtr error command.
All debug output (including debug rtr error command output) has the format shown in the debug rtr error command output example.
Note
Examples
The following output is from the debug rtr trace command. In this example, a probe is traced through a single operation attempt: the setup of a connection to the target, and the attempt at an echo to calculate UDP packet response time.
Router# debug rtr traceRouter# RTR 1:Starting An Echo Operation - IP RTR Probe 1May 5 05:25:08.584:rtt hash insert :3.0.0.3 3383May 5 05:25:08.584: source=3.0.0.3(3383) dest-ip=5.0.0.1(9)May 5 05:25:08.588:sending control msg:May 5 05:25:08.588: Ver:1 ID:51 Len:52May 5 05:25:08.592:cmd:command:RTT_CMD_UDP_PORT_ENABLE, ip:5.0.0.1, port:9, duration:5000May 5 05:25:08.607:receiving replyMay 5 05:25:08.607: Ver:1 ID:51 Len:8May 5 05:25:08.623: local delta:8May 5 05:25:08.627: delta from responder:1May 5 05:25:08.627: received <16> bytes and responseTime = 3 (ms)May 5 05:25:08.631:rtt hash remove:3.0.0.3 3383RTR 1:Starting An Echo Operation - IP RTR Probe 1May 5 05:26:08.104:rtt hash insert :3.0.0.3 2974May 5 05:26:08.104: source=3.0.0.3(2974) dest-ip=5.0.0.1(9)May 5 05:26:08.108:sending control msg:May 5 05:26:08.108: Ver:1 ID:52 Len:52May 5 05:26:08.112:cmd:command:RTT_CMD_UDP_PORT_ENABLE, ip:5.0.0.1, port:9, duration:5000May 5 05:26:08.127:receiving replyMay 5 05:26:08.127: Ver:1 ID:52 Len:8May 5 05:26:08.143: local delta:8May 5 05:26:08.147: delta from responder:1May 5 05:26:08.147: received <16> bytes and responseTime = 3 (ms)May 5 05:26:08.151:rtt hash remove:3.0.0.3 2974RTR 1:Starting An Echo Operation - IP RTR Probe 1Related Commands
debug rtsp
To show the status of the Real Time Streaming Protocol (RTSP) client/server, use the debug rstp command. To disables the display of output use the no form of this command.
debug rstp type [all | api | pmh | session | socket]
[no] debug rstp type [all | api | pmh | session | socket]
Syntax Description
Defaults
Debug is not enabled.
Command History
Related Commands
Displays debug output for the RTSP client API.
Displays debug output for the RTSP client data.
Displays debug output for the RTSP client socket data.
debug rtsp api
To display information about the Real Time Streaming Protocol (RTSP) API messages passed down to the RTSP client, use the debug rtsp api command. To disable the output, use the no form of this command.
debug rtsp api
[no] debug rtsp api
Syntax Description
This command has no arguments or keywords.
Defaults
Debug is not enabled.
Command History
Examples
The following example displays output from the debug rtsp api command:
router# debug rtsp apiRTSP client API debugging is onrouter#Jan 1 00:23:15.775:rtsp_api_create_session:sess_id=0x61A07C78,evh=0x60D6E62C context=0x61A07B28Jan 1 00:23:15.775:rtsp_api_request:msg=0x61C2B10CJan 1 00:23:15.775:rtsp_api_handle_req_set_params:msg=0x61C2B10CJan 1 00:23:15.775:rtsp_api_free_msg_buffer:msg=0x61C2B10CJan 1 00:23:15.775:rtsp_api_request:msg=0x61C293CCJan 1 00:23:15.775:rtsp_api_handle_req_set_params:msg=0x61C293CCJan 1 00:23:15.775:rtsp_api_free_msg_buffer:msg=0x61C293CCJan 1 00:23:15.775:rtsp_api_request:msg=0x61C2970CJan 1 00:23:15.775:rtsp_api_handle_req_set_params:msg=0x61C2970CJan 1 00:23:15.775:rtsp_api_free_msg_buffer:msg=0x61C2970Crouter#Jan 1 00:23:15.775:rtsp_api_request:msg=0x61C29A4Crouter#Jan 1 00:23:22.099:rtsp_api_free_msg_buffer:msg=0x61C29A4CJan 1 00:23:22.115:rtsp_api_request:msg=0x61C2A40CJan 1 00:23:22.115:rtsp_api_free_msg_buffer:msg=0x61C2A40CRouter#Related Commands
Displays debug output for the RTSP client data.
debug rtsp pmh
Displays debug messages for the PMH.
Displays debug output for the RTSP client socket data.
debug rtsp client session
To display debug messages about the Real Time Streaming Protocol (RTSP) client or the current session, use the debug rtsp command. To disable the output, use the no form of this command.
debug rtsp [client | session]
no debug rtsp [client | session]
Syntax Description
Defaults
Debug is not enabled.
Command History
Examples
The following example displays the debug messages of the RTSP session:
Router# debug rtsp sessionRTSP client session debugging is onrouter#Jan 1 00:08:36.099:rtsp_get_new_scb:Jan 1 00:08:36.099:rtsp_initialize_scb:Jan 1 00:08:36.099:rtsp_control_process_msg:Jan 1 00:08:36.099:rtsp_control_process_msg:received MSG request of TYPE 0Jan 1 00:08:36.099:rtsp_set_event:Jan 1 00:08:36.099:rtsp_set_event:api_req_msg_type=RTSP_API_REQ_PLAYJan 1 00:08:36.103:rtsp_set_event:url:[rtsp://rtsp-cisco.cisco.com:554/en_welcome.au]Jan 1 00:08:36.103:rtsp_process_async_event:SCB=0x62128F08Jan 1 00:08:36.103:rtsp_process_async_event:rtsp_state = RTSP_SES_STATE_IDLErtsp_event = RTSP_EV_PLAY_OR_RECJan 1 00:08:36.103:act_idle_event_play_or_rec_req:Jan 1 00:08:36.103:rtsp_resolve_dns:Jan 1 00:08:36.103:rtsp_resolve_dns:IP Addr = 1.13.79.6:Jan 1 00:08:36.103:rtsp_connect_to_svr:Jan 1 00:08:36.103:rtsp_connect_to_svr:socket=0, connection_state = 2Jan 1 00:08:36.103:rtsp_start_timer:timer (0x62128FD0)starts - delay (10000)Jan 1 00:08:36.107:rtsp_control_main:SOCK= 0 Event=0x1Jan 1 00:08:36.107:rtsp_stop_timer:timer(0x62128FD0) stopsJan 1 00:08:36.107:rtsp_process_async_event:SCB=0x62128F08Jan 1 00:08:36.107:rtsp_process_async_event:rtsp_state = RTSP_SES_STATE_IDLErtsp_event = RTSP_EV_SVR_CONNECTEDJan 1 00:08:36.107:act_idle_event_svr_connected:Jan 1 00:08:36.107:rtsp_control_main:SOCK= 0 Event=0x1Jan 1 00:08:36.783:rtsp_control_main:SOCK= 0 Event=0x1Jan 1 00:08:36.783:rtsp_process_async_event:SCB=0x62128F08Jan 1 00:08:36.783:rtsp_process_async_event:rtsp_state = RTSP_SES_STATE_READYrtsp_event = RTSP_EV_SVR_DESC_OR_ANNOUNCE_RESPJan 1 00:08:36.783:act_ready_event_desc_or_announce_resp:Jan 1 00:08:36.783:act_ready_event_desc_or_announce_resp:RTSP_STATUS_DESC_OR_ANNOUNCE_RESP_OKJan 1 00:08:37.287:rtsp_control_main:SOCK= 0 Event=0x1Jan 1 00:08:37.287:rtsp_process_async_event:SCB=0x62128F08Jan 1 00:08:37.287:rtsp_process_async_event:rtsp_state = RTSP_SES_STATE_READYrtsp_event = RTSP_EV_SVR_SETUP_RESPJan 1 00:08:37.287:act_ready_event_setup_resp:Jan 1 00:08:37.287:act_ready_event_setup_resp:Remote RTP Port=13344Jan 1 00:08:37.287:rtsp_rtp_stream_setup:scb=0x62128F08, callID=0x7 record=0Jan 1 00:08:37.287:rtsp_rtp_stream_setup:Starting RTCP session.Local IP addr = 1.13.79.45, Remote IP addr = 1.13.79.6,Local RTP port = 18748, Remote RTP port = 13344 CallID=8Jan 1 00:08:37.291:xmit_func = 0x0 vdbptr = 0x61A0FC98Jan 1 00:08:37.291:rtsp_control_main:CCAPI Queue EventJan 1 00:08:37.291:rtsp_rtp_associate_done:ev=0x62070E08, callID=0x7Jan 1 00:08:37.291:rtsp_rtp_associate_done:scb=0x62128F08Jan 1 00:08:37.291:rtsp_rtp_associate_done:callID=0x7, pVdb=0x61F4FBC8,Jan 1 00:08:37.291: spi_context=0x6214145CJan 1 00:08:37.291: disposition=0, playFunc=0x60CA2238,Jan 1 00:08:37.291: codec=0x5, vad=0, mediaType=6,Jan 1 00:08:37.291: stream_assoc_id=1Jan 1 00:08:37.291:rtsp_rtp_modify_session:scb=0x62128F08, callID=0x7Jan 1 00:08:37.291:rtsp_process_async_event:SCB=0x62128F08Jan 1 00:08:37.291:rtsp_process_async_event:rtsp_state = RTSP_SES_STATE_READYrtsp_event = RTSP_EV_ASSOCIATE_DONEJan 1 00:08:37.291:act_ready_event_associate_done:Jan 1 00:08:37.291:rtsp_get_stream:Jan 1 00:08:37.783:rtsp_control_main:SOCK= 0 Event=0x1Jan 1 00:08:37.783:rtsp_process_async_event:SCB=0x62128F08Jan 1 00:08:37.783:rtsp_process_async_event:rtsp_state = RTSP_SES_STATE_READYrtsp_event = RTSP_EV_SVR_PLAY_OR_REC_RESPJan 1 00:08:37.783:act_ready_event_play_or_rec_resp:Jan 1 00:08:37.783:rtsp_start_timer:timer (0x62128FB0)starts - delay (4249)rtsp-5#Jan 1 00:08:42.035:rtsp_process_timer_events:Jan 1 00:08:42.035:rtsp_process_timer_events:PLAY OR RECORD completedJan 1 00:08:42.035:rtsp_process_async_event:SCB=0x62128F08Jan 1 00:08:42.035:rtsp_process_async_event:rtsp_state = RTSP_SES_STATE_PLAY_OR_RECrtsp_event = RTSP_EV_PLAY_OR_REC_TIMER_EXPIREDJan 1 00:08:42.035:act_play_event_play_done:Jan 1 00:08:42.035:act_play_event_play_done:elapsed play time = 4249 total play time = 4249Jan 1 00:08:42.035:rtsp_send_teardown_to_svr:Jan 1 00:08:42.487:rtsp_control_main:SOCK= 0 Event=0x1Jan 1 00:08:42.487:rtsp_process_async_event:SCB=0x62128F08Jan 1 00:08:42.487:rtsp_process_async_event:rtsp_state = RTSP_SES_STATE_PLAY_OR_RECrtsp_event = RTSP_EV_SVR_TEARDOWN_RESPJan 1 00:08:42.487:act_play_event_teardown_resp:Jan 1 00:08:42.487:rtsp_server_closed:Jan 1 00:08:42.487:rtsp_send_resp_to_api:Jan 1 00:08:42.487:rtsp_send_resp_to_api:sending RESP=RTSP_STATUS_PLAY_COMPLETEJan 1 00:08:42.491:rtsp_rtp_teardown_stream:scb=0x62128F08, callID=0x7Jan 1 00:08:42.491:rtsp_rtp_stream_cleanup:scb=0x62128F08, callID=0x7Jan 1 00:08:42.491:rtsp_update_stream_stats:scb=0x62128F08, stream=0x61A43350,Jan 1 00:08:42.491:call_info=0x6214C67C, callID=0x7Jan 1 00:08:42.491:rtsp_update_stream_stats:rx_bytes = 25992Jan 1 00:08:42.491:rtsp_update_stream_stats:rx_packetes = 82Jan 1 00:08:42.491:rtsp_reinitialize_scb:Jan 1 00:08:42.503:rtsp_control_process_msg:Jan 1 00:08:42.503:rtsp_control_process_msg:received MSG request of TYPE 0Jan 1 00:08:42.503:rtsp_set_event:Jan 1 00:08:42.503:rtsp_set_event:api_req_msg_type=RTSP_API_REQ_DESTROYJan 1 00:08:42.503:rtsp_session_cleanup:Jan 1 00:08:42.503:rtsp_create_session_history:scb=0x62128F08, callID=0x7Jan 1 00:08:42.503:rtsp_insert_session_history_record:current=0x6214BDC8, callID=0x7Jan 1 00:08:42.503:rtsp_insert_session_history_record:count = 3Jan 1 00:08:42.503:rtsp_insert_session_history_record:starting history record deletion_timer of10 minutesJan 1 00:08:42.503:rtsp_session_cleanup:deleting session:scb=0x62128F08Router#Related Commands
debug rtsp pmh
To display debug information about the Protocol Message Handler (PMH), use the debug rtsp pmh command. To disable the output, use the no form of this command.
debug rtsp pmh
no debug rtsp pmh
Syntax Description
This command has no arguments or keywords.
Defaults
Debug is not enabled.
Command History
Usage Guidelines
Use the debug rtsp pmh debug command for the following instances:
•
Mar 1 02:25:11.447:SendBuf:DESCRIBE rtsp://rtsp-cisco.cisco.com/en_welcome.au RTSP/1.0CSeq:0•
Mar 1 02:25:11.947:########################################Mar 1 02:25:11.947:Mesg_line :RTSP/1.0 200 OKMar 1 02:25:11.951:Content_length :459Mar 1 02:25:11.951:Header listMar 1 02:25:11.951:Content-length:459Mar 1 02:25:11.951:Content-type:application/sdpMar 1 02:25:11.951:Content-base:rtsp://rtsp-cisco.cisco.com/en_welcome.au/Mar 1 02:25:11.951:X-TSPort:7802Mar 1 02:25:11.951:Last-Modified:Thu, 07 Oct 1999 13:51:28 GMTMar 1 02:25:11.951:Date:Mon, 10 Jan 2000 16:40:59 GMTMar 1 02:25:11.951:CSeq:0Examples
The following example output displays the result from entering the debug rtsp pmh command:
Router# debug rtsp pmhRTSP client Protocol Message Handler debugging is onRouter#Jan 1 00:22:34.087:rtsp_pmh_update_play_req_url:Jan 1 00:22:34.087:rtsp_pmh_parse_url:Jan 1 00:22:34.087:Input-Url:rtsp://rtsp-cisco.cisco.com:554/en_welcome.auJan 1 00:22:34.087:Hostname:rtsp-cisco.cisco.comJan 1 00:22:34.087:Port :554Jan 1 00:22:34.087:Path :en_welcome.auJan 1 00:22:34.091:rtsp_pmh_build_desc_req:Jan 1 00:22:34.091:rtsp_pmh_add_req_line:Jan 1 00:22:34.091:RequestLine:(DESCRIBE rtsp://rtsp-cisco.cisco.com:554/en_welcome.au RTSP/1.0)Jan 1 00:22:34.091:SendBuf:DESCRIBE rtsp://rtsp-cisco.cisco.com:554/en_welcome.au RTSP/1.0CSeq:0Jan 1 00:22:34.091:last_req = 0Jan 1 00:22:34.739:rtsp_pmh_parse_svr_response:Jan 1 00:22:34.739:rtsp_pmh_create_mesg:Jan 1 00:22:34.739:########################################Jan 1 00:22:34.739:Mesg_line :RTSP/1.0 200 OKJan 1 00:22:34.739:Content_length :482Jan 1 00:22:34.739:Header listJan 1 00:22:34.739:Content-length:482Jan 1 00:22:34.739:Content-type:application/sdpJan 1 00:22:34.739:Content-base:rtsp://rtsp-cisco.cisco.com:554/en_welcome.au/Jan 1 00:22:34.739:Last-Modified:Thu, 07 Oct 1999 13:51:28 GMTJan 1 00:22:34.739:X-TSPort:7802Jan 1 00:22:34.739:vsrc:http://rtsp-cisco.cisco.com:8080/viewsource/template.html?nuyhtgywkgz6mc 9AbhC4gn5gBsqp4eA1v1yeC3d4ngEt5o5gwuw4t6x05jbhcv66ngE8xg8fJan 1 00:22:34.739:Set-Cookie:cbid=ekeghhiljgekgihheoqohpptrrjrktlufkegkioihgjfdlplrnqogpoqlrpsk qnuffgjcmcl;path=/;expires=Thu,31-Dec-2037 23:59:59 GMTJan 1 00:22:34.739:Date:Mon, 10 Apr 2000 15:39:17 GMTJan 1 00:22:34.739:CSeq:0Jan 1 00:22:34.739:Message BodyJan 1 00:22:34.739:v=0o=- 939300688 939300688 IN IP4 1.13.79.6s=<No title>i=<No author> <No copyright>a=StreamCount:integer;1t=0 0m=audio 0 RTP/AVP 0a=control:streamid=0a=rtpmap:0 L8/8000/1a=length:npt=3.249000a=range:npt=0-3.249000a=mimetype:string;"audio/x-pn-au"a=StartTime:integer;0a=AvgBitRate:integer;64000a=AvgPacketSize:integer;320a=Preroll:integer;0a=MaxPacketSize:integer;320a=MaxBitRate:integer;64000a=OpaqueData:buffer;"AQABAEAfAAA="a=StreamName:string;"audio/x-pn-au"Jan 1 00:22:34.739:########################################Jan 1 00:22:34.739:rtsp_pmh_process_resp_headers:Jan 1 00:22:34.739:rtsp_pmh_get_header_value:Jan 1 00:22:34.739:rtsp_pmh_process_resp_headers:Cseq=1Jan 1 00:22:34.739:rtsp_pmh_get_resp_line:Jan 1 00:22:34.739:rtsp_pmh_process_resp_headers:Response StatusJan 1 00:22:34.739:rtsp_pmh_process_resp_headers:Status Code:200Jan 1 00:22:34.739:rtsp_pmh_process_resp_headers:Reason Phrase:OKJan 1 00:22:34.743:rtsp_pmh_parse_mesg_body:Jan 1 00:22:34.743:rtsp_pmh_process_resp_headers:Response URL:rtsp://rtsp-cisco.cisco.com:554/en_welcome.au/streamid=0Jan 1 00:22:34.743:rtsp_pmh_process_resp_headers:RealServer DurationJan 1 00:22:34.743:rtsp_pmh_process_resp_headers:IP/TV DurationJan 1 00:22:34.743:rtsp_pmh_get_range_from_npt:Jan 1 00:22:34.743:rtsp_pmh_get_range_from_npt:Duration:3249 msecsJan 1 00:22:34.743:rtsp_pmh_update_resp_status:Jan 1 00:22:34.743:rtsp_pmh_update_resp_status:Control Not activeJan 1 00:22:34.743:########################################Jan 1 00:22:34.743:Mesg_line :RTSP/1.0 200 OKJan 1 00:22:34.743:Content_length :482Jan 1 00:22:34.743:Header listJan 1 00:22:34.743:Content-length:482Jan 1 00:22:34.743:Content-type:application/sdpJan 1 00:22:34.743:Content-base:rtsp://rtsp-cisco.cisco.com:554/en_welcome.au/Jan 1 00:22:34.743:Last-Modified:Thu, 07 Oct 1999 13:51:28 GMTJan 1 00:22:34.743:X-TSPort:7802Jan 1 00:22:34.743:vsrc:http://rtsp-cisco.cisco.com:8080/viewsource/template.html?nuyhtgywkgz6mc 9AbhC4gn5gBsqp4eA1v1yeC3d4ngEt5o5gwuw4t6x05jbhcv66ngE8xg8fJan 1 00:22:34.743:Set-Cookie:cbid=ekeghhiljgekgihheoqohpptrrjrktlufkegkioihgjfdlplrnqogpoqlrpsk qnuffgjcmcl;path=/;expires=Thu,31-Dec-2037 23:59:59 GMTJan 1 00:22:34.743:Date:Mon, 10 Apr 2000 15:39:17 GMTJan 1 00:22:34.743:CSeq:0Jan 1 00:22:34.743:Message BodyJan 1 00:22:34.743:v=0o=- 939300688 939300688 IN IP4 1.13.79.6s=<No title>i=<No author> <No copyright>a=StreamCount:integer;1t=0 0m=audio 0 RTP/AVP 0a=control:streamid=0a=rtpmap:0 L8/8000/1a=length:npt=3.249000a=range:npt=0-3.249000a=mimetype:string;"audio/x-pn-au"a=StartTime:integer;0a=AvgBitRate:integer;64000a=AvgPacketSize:integer;320a=Preroll:integer;0a=MaxPacketSize:integer;320a=MaxBitRate:integer;64000a=OpaqueData:buffer;"AQABAEAfAAA="a=StreamName:string;"audio/x-pn-au"Jan 1 00:22:34.743:########################################Jan 1 00:22:34.743:rtsp_pmh_free_mesg:Jan 1 00:22:34.743:rtsp_pmh_build_setup_req:Jan 1 00:22:34.743:rtsp_pmh_add_req_line:Jan 1 00:22:34.743:RequestLine:(SETUP rtsp://rtsp-cisco.cisco.com:554/en_welcome.au/streamid=0 RTSP/1.0)Jan 1 00:22:34.747:rtsp_pmh_build_setup_req:SendBuf:SETUP rtsp://rtsp-cisco.cisco.com:554/en_welcome.au/streamid=0 RTSP/1.0CSeq:1Transport:rtp/avp;unicast;client_port=18084Jan 1 00:22:35.243:rtsp_pmh_parse_svr_response:Jan 1 00:22:35.243:rtsp_pmh_create_mesg:Jan 1 00:22:35.243:########################################Jan 1 00:22:35.243:Mesg_line :RTSP/1.0 200 OKJan 1 00:22:35.243:Content_length :0Jan 1 00:22:35.243:Header listJan 1 00:22:35.243:Transport:rtp/avp;unicast;client_port=18084-18085;server_port=23192-23193Jan 1 00:22:35.243:Session:24457-1Jan 1 00:22:35.243:Date:Mon, 10 Apr 2000 15:39:17 GMTJan 1 00:22:35.243:CSeq:1Jan 1 00:22:35.243:Message BodyJan 1 00:22:35.243:########################################Jan 1 00:22:35.243:rtsp_pmh_process_resp_headers:Jan 1 00:22:35.243:rtsp_pmh_get_header_value:Jan 1 00:22:35.243:rtsp_pmh_process_resp_headers:Cseq=2Jan 1 00:22:35.243:rtsp_pmh_get_resp_line:Jan 1 00:22:35.243:rtsp_pmh_process_resp_headers:Response StatusJan 1 00:22:35.243:rtsp_pmh_process_resp_headers:Status Code:200Jan 1 00:22:35.243:rtsp_pmh_process_resp_headers:Reason Phrase:OKJan 1 00:22:35.243:rtsp_pmh_get_header_value:Jan 1 00:22:35.247:rtsp_pmh_get_header_value:Jan 1 00:22:35.247:rtsp_pmh_process_resp_headers:RTP PORT= 23192Jan 1 00:22:35.247:rtsp_pmh_process_resp_headers:RTP PORT= 23192Jan 1 00:22:35.247:rtsp_pmh_update_resp_status:Jan 1 00:22:35.247:rtsp_pmh_update_resp_status:Control Not activeJan 1 00:22:35.247:########################################Jan 1 00:22:35.247:Mesg_line :RTSP/1.0 200 OKJan 1 00:22:35.247:Content_length :0Jan 1 00:22:35.247:Header listJan 1 00:22:35.247:Transport:rtp/avp;unicast;client_port=18084-18085;server_port=23192-23193Jan 1 00:22:35.247:Session:24457-1Jan 1 00:22:35.247:Date:Mon, 10 Apr 2000 15:39:17 GMTJan 1 00:22:35.247:CSeq:1Jan 1 00:22:35.247:Message BodyJan 1 00:22:35.247:########################################Jan 1 00:22:35.247:rtsp_pmh_free_mesg:Jan 1 00:22:35.247:rtsp_pmh_build_play_req:Jan 1 00:22:35.247:rtsp_pmh_add_req_line:Jan 1 00:22:35.247:RequestLine:(PLAY rtsp://rtsp-cisco.cisco.com:554/en_welcome.au/streamid=0 RTSP/1.0)Jan 1 00:22:35.247:rtsp_pmh_build_play_req:SendBuf:PLAY rtsp://rtsp-cisco.cisco.com:554/en_welcome.au/streamid=0 RTSP/1.0Session:24457-1CSeq:2Jan 1 00:22:35.735:rtsp_pmh_parse_svr_response:Jan 1 00:22:35.735:rtsp_pmh_create_mesg:Jan 1 00:22:35.739:########################################Jan 1 00:22:35.739:Mesg_line :RTSP/1.0 200 OKJan 1 00:22:35.739:Content_length :0Jan 1 00:22:35.739:Header listJan 1 00:22:35.739:Date:Mon, 10 Apr 2000 15:39:18 GMTJan 1 00:22:35.739:CSeq:2Jan 1 00:22:35.739:Message BodyJan 1 00:22:35.739:########################################Jan 1 00:22:35.739:rtsp_pmh_process_resp_headers:Jan 1 00:22:35.739:rtsp_pmh_get_header_value:Jan 1 00:22:35.739:rtsp_pmh_process_resp_headers:Cseq=3Jan 1 00:22:35.739:rtsp_pmh_get_resp_line:Jan 1 00:22:35.739:rtsp_pmh_process_resp_headers:Response StatusJan 1 00:22:35.739:rtsp_pmh_process_resp_headers:Status Code:200Jan 1 00:22:35.739:rtsp_pmh_process_resp_headers:Reason Phrase:OKJan 1 00:22:35.739:rtsp_pmh_update_resp_status:Jan 1 00:22:35.739:rtsp_pmh_update_resp_status:Control Not activeJan 1 00:22:35.739:########################################Jan 1 00:22:35.739:Mesg_line :RTSP/1.0 200 OKJan 1 00:22:35.739:Content_length :0Jan 1 00:22:35.739:Header listJan 1 00:22:35.739:Date:Mon, 10 Apr 2000 15:39:18 GMTJan 1 00:22:35.739:CSeq:2Jan 1 00:22:35.739:Message BodyJan 1 00:22:35.739:########################################Jan 1 00:22:35.739:rtsp_pmh_free_mesg:Jan 1 00:22:40.011:rtsp_pmh_build_teardown_req:Jan 1 00:22:40.011:rtsp_pmh_add_req_line:Jan 1 00:22:40.011:RequestLine:(TEARDOWN rtsp://rtsp-cisco.cisco.com:554/en_welcome.au/streamid=0 RTSP/1.0)Jan 1 00:22:40.011:SendBuf:TEARDOWN rtsp://rtsp-cisco.cisco.com:554/en_welcome.au/streamid=0 RTSP/1.0Session:24457-1CSeq:3Jan 1 00:22:40.443:rtsp_pmh_parse_svr_response:Jan 1 00:22:40.443:rtsp_pmh_create_mesg:Jan 1 00:22:40.443:########################################Jan 1 00:22:40.443:Mesg_line :RTSP/1.0 200 OKJan 1 00:22:40.443:Content_length :0Jan 1 00:22:40.443:Header listJan 1 00:22:40.443:Date:Mon, 10 Apr 2000 15:39:23 GMTJan 1 00:22:40.443:CSeq:3Jan 1 00:22:40.443:Message BodyJan 1 00:22:40.443:########################################Jan 1 00:22:40.443:rtsp_pmh_process_resp_headers:Jan 1 00:22:40.443:rtsp_pmh_get_header_value:Jan 1 00:22:40.443:rtsp_pmh_process_resp_headers:Cseq=4Jan 1 00:22:40.443:rtsp_pmh_get_resp_line:Jan 1 00:22:40.443:rtsp_pmh_process_resp_headers:Response StatusJan 1 00:22:40.443:rtsp_pmh_process_resp_headers:Status Code:200Jan 1 00:22:40.443:rtsp_pmh_process_resp_headers:Reason Phrase:OKJan 1 00:22:40.443:rtsp_pmh_update_resp_status:Jan 1 00:22:40.443:rtsp_pmh_update_resp_status:Control Not activeJan 1 00:22:40.443:########################################Jan 1 00:22:40.447:Mesg_line :RTSP/1.0 200 OKJan 1 00:22:40.447:Content_length :0Jan 1 00:22:40.447:Header listJan 1 00:22:40.447:Date:Mon, 10 Apr 2000 15:39:23 GMTJan 1 00:22:40.447:CSeq:3Jan 1 00:22:40.447:Message BodyJan 1 00:22:40.447:########################################Jan 1 00:22:40.447:rtsp_pmh_free_mesg:Router#Jan 1 00:14:20.483:rtsp_tcp_socket_connect:Jan 1 00:14:20.483:rtsp_tcp_socket_connect:Socket = 0Jan 1 00:14:20.483: Dest_addr = 1.13.79.6 Dest_Port=554Jan 1 00:14:20.487:rtsp_send_req_to_svr:Socket = 0 send_buf = DESCRIBE rtsp://rtsp-cisco.cisco.com:554/en_welcome.au RTSP/1.0CSeq:0len = 76Jan 1 00:14:20.491:rtsp_send_req_to_svr:bytes_sent = 76Jan 1 00:14:20.491:rtsp_read_svr_resp:Socket = 0Jan 1 00:14:20.491:rtsp_read_svr_resp:NBYTES = -1Jan 1 00:14:21.155:rtsp_read_svr_resp:Socket = 0Jan 1 00:14:21.159:rtsp_read_svr_resp:NBYTES = 996Jan 1 00:14:21.223:rtsp_read_svr_resp:rtsp_pmh_parse_svr_response completeJan 1 00:14:21.227:rtsp_read_svr_resp:RESP received OKJan 1 00:14:21.227:rtsp_send_req_to_svr:Socket = 0 send_buf = SETUP rtsp://rtsp-cisco.cisco.com:554/en_welcome.au/streamid=0 RTSP/1.0CSeq:1Transport:rtp/avp;unicast;client_port=18074len = 130Jan 1 00:14:21.227:rtsp_send_req_to_svr:bytes_sent = 130Jan 1 00:14:21.663:rtsp_read_svr_resp:Socket = 0Jan 1 00:14:21.663:rtsp_read_svr_resp:NBYTES = 159Jan 1 00:14:21.663:rtsp_read_svr_resp:rcv_buf = RTSP/1.0 200 OKCSeq:1Date:Mon, 10 Apr 2000 15:31:04 GMTSession:24455-1Transport:rtp/avp;unicast;client_port=18074-18075;server_port=15562-15563Jan 1 00:14:21.663:rtsp_read_svr_resp:rtsp_pmh_parse_svr_response completeJan 1 00:14:21.663:rtsp_read_svr_resp:RESP received OKJan 1 00:14:21.663:rtsp_send_req_to_svr:Socket = 0 send_buf = PLAY rtsp://rtsp-cisco.cisco.com:554/en_welcome.au/streamid=0 RTSP/1.0Session:24455-1CSeq:2len = 101Jan 1 00:14:21.667:rtsp_send_req_to_svr:bytes_sent = 101Jan 1 00:14:22.155:rtsp_read_svr_resp:Socket = 0Jan 1 00:14:22.155:rtsp_read_svr_resp:NBYTES = 65Jan 1 00:14:22.155:rtsp_read_svr_resp:rcv_buf = RTSP/1.0 200 OKCSeq:2Date:Mon, 10 Apr 2000 15:31:04 GMTJan 1 00:14:22.155:rtsp_read_svr_resp:rtsp_pmh_parse_svr_response completeJan 1 00:14:22.155:rtsp_read_svr_resp:RESP received OKrtsp-5#Jan 1 00:14:26.411:rtsp_send_req_to_svr:Socket = 0 send_buf = TEARDOWN rtsp://rtsp-cisco.cisco.com:554/en_welcome.au/streamid=0 RTSP/1.0Session:24455-1CSeq:3len = 105Jan 1 00:14:26.411:rtsp_send_req_to_svr:bytes_sent = 105Jan 1 00:14:26.863:rtsp_read_svr_resp:Socket = 0Jan 1 00:14:26.863:rtsp_read_svr_resp:NBYTES = 65Jan 1 00:14:26.863:rtsp_read_svr_resp:rcv_buf = RTSP/1.0 200 OKCSeq:3Date:Mon, 10 Apr 2000 15:31:09 GMTJan 1 00:14:26.863:rtsp_read_svr_resp:rtsp_pmh_parse_svr_response completeJan 1 00:14:26.863:rtsp_read_svr_resp:RESP received OKJan 1 00:14:26.863:rtsp_close_svr_connection:closing socket 0Router#Related Commands
Displays debug output for the RTSP client API.
Displays debug output for the RTSP client data.
Displays debug output for the RTSP client socket data.
debug rtsp socket
To display debug messages about the packets received or sent on the TCP or User Datagram Protocol (UDP) sockets, use the debug rtsp socket command. To disable the output, use the no form of this command.
debug rtsp socket
no debug rtsp socket
Syntax Description
This command has no arguments or keywords.
Defaults
Debug is not enabled.
Command History
Usage Guidelines
Each RTSP session has a TCP port for control and a UDP (RTP) port for delivery of data. The control connection (TCP socket) is used to exchange a set of messages (request from the RTSP client and the response from the server) for displaying a prompt. The debug rtsp socket command enables the user to debug the message exchanges being done on the TCP control connection.
Examples
The following example displays output from the debug rtsp socket command:
Router# show debug rtsp socketJan 1 00:14:20.483:rtsp_tcp_socket_connect:Jan 1 00:14:20.483:rtsp_tcp_socket_connect:Socket = 0Jan 1 00:14:20.483: Dest_addr = 1.13.79.6 Dest_Port=554Jan 1 00:14:20.487:rtsp_send_req_to_svr:Socket = 0 send_buf = DESCRIBE rtsp://rtsp-cisco.cisco.com:554/en_welcome.au RTSP/1.0CSeq:0len = 76Jan 1 00:14:20.491:rtsp_send_req_to_svr:bytes_sent = 76Jan 1 00:14:20.491:rtsp_read_svr_resp:Socket = 0Jan 1 00:14:20.491:rtsp_read_svr_resp:NBYTES = -1Jan 1 00:14:21.155:rtsp_read_svr_resp:Socket = 0Jan 1 00:14:21.159:rtsp_read_svr_resp:NBYTES = 996Jan 1 00:14:21.223:rtsp_read_svr_resp:rtsp_pmh_parse_svr_response completeJan 1 00:14:21.227:rtsp_read_svr_resp:RESP received OKJan 1 00:14:21.227:rtsp_send_req_to_svr:Socket = 0 send_buf = SETUP rtsp://rtsp-cisco.cisco.com:554/en_welcome.au/streamid=0 RTSP/1.0CSeq:1Transport:rtp/avp;unicast;client_port=18074len = 130Jan 1 00:14:21.227:rtsp_send_req_to_svr:bytes_sent = 130Jan 1 00:14:21.663:rtsp_read_svr_resp:Socket = 0Jan 1 00:14:21.663:rtsp_read_svr_resp:NBYTES = 159Jan 1 00:14:21.663:rtsp_read_svr_resp:rcv_buf = RTSP/1.0 200 OKCSeq:1Date:Mon, 10 Apr 2000 15:31:04 GMTSession:24455-1Transport:rtp/avp;unicast;client_port=18074-18075;server_port=15562-15563Jan 1 00:14:21.663:rtsp_read_svr_resp:rtsp_pmh_parse_svr_response completeJan 1 00:14:21.663:rtsp_read_svr_resp:RESP received OKJan 1 00:14:21.663:rtsp_send_req_to_svr:Socket = 0 send_buf = PLAY rtsp://rtsp-cisco.cisco.com:554/en_welcome.au/streamid=0 RTSP/1.0Session:24455-1CSeq:2len = 101Jan 1 00:14:21.667:rtsp_send_req_to_svr:bytes_sent = 101Jan 1 00:14:22.155:rtsp_read_svr_resp:Socket = 0Jan 1 00:14:22.155:rtsp_read_svr_resp:NBYTES = 65Jan 1 00:14:22.155:rtsp_read_svr_resp:rcv_buf = RTSP/1.0 200 OKCSeq:2Date:Mon, 10 Apr 2000 15:31:04 GMTJan 1 00:14:22.155:rtsp_read_svr_resp:rtsp_pmh_parse_svr_response completeJan 1 00:14:22.155:rtsp_read_svr_resp:RESP received OKrtsp-5#Jan 1 00:14:26.411:rtsp_send_req_to_svr:Socket = 0 send_buf = TEARDOWN rtsp://rtsp-cisco.cisco.com:554/en_welcome.au/streamid=0 RTSP/1.0Session:24455-1CSeq:3len = 105Jan 1 00:14:26.411:rtsp_send_req_to_svr:bytes_sent = 105Jan 1 00:14:26.863:rtsp_read_svr_resp:Socket = 0Jan 1 00:14:26.863:rtsp_read_svr_resp:NBYTES = 65Jan 1 00:14:26.863:rtsp_read_svr_resp:rcv_buf = RTSP/1.0 200 OKCSeq:3Date:Mon, 10 Apr 2000 15:31:09 GMTJan 1 00:14:26.863:rtsp_read_svr_resp:rtsp_pmh_parse_svr_response completeJan 1 00:14:26.863:rtsp_read_svr_resp:RESP received OKJan 1 00:14:26.863:rtsp_close_svr_connection:closing socket 0Router#Related Commands
Displays debug output for the RTSP client API.
Displays debug output for the RTSP client data.
debug rtsp pmh
Displays debug messages for the PMH.
debug rtpspi all
To debug all RTP SPI errors, sessions, and in/out functions, use the debug rtpspi all EXEC command. Use the no debug rtpspi all command to turn off debugging.
debug rtpspi all
no debug rtpspi all
Syntax Description
This command has no arguments or keywords.
Defaults
No default behavior or values.
Command Modes
EXEC
Command History
12.0(7)XK
This command was introduced on the Cisco MC3810 and Cisco 3600 series routers (except the Cisco 3620) in a private release that was not generally available.
Usage Guidelines
Caution
Examples
The following example shows a debug trace for RTP SPI errors, sessions, and in/out functions on a gateway:
router# debug rtpspi allRTP SPI Error, Session and function in/out tracings are enabled.*Mar 1 00:38:59.381:rtpspi_allocate_rtp_port:Entered.*Mar 1 00:38:59.381:rtpspi_allocate_rtp_port:allocated RTP port 16544*Mar 1 00:38:59.381:rtpspi_allocate_rtp_port:Success. port = 16544. Leaving.*Mar 1 00:38:59.381:rtpspi_call_setup_request:entered.Call Id = 5, dest = 0.0.0.0; callInfo:final dest flag = 0,rtp_session_mode = 0x2,local_ip_addrs = 0x5000001,remote_ip_addrs = 0x0,local rtp port = 16544, remote rtp port = 0*Mar 1 00:38:59.381:rtpspi_call_setup_request:spi_info copied for rtpspi_app_data_t.*Mar 1 00:38:59.385:rtpspi_call_setup_request:leaving*Mar 1 00:38:59.385:rtpspi_call_setup() entered*Mar 1 00:38:59.385:rtpspi_initialize_ccb:Entered*Mar 1 00:38:59.385:rtpspi_initialize_ccb:leaving*Mar 1 00:38:59.385:rtpspi_call_setup:rtp_session_mode = 0x2*Mar 1 00:38:59.385:rtpspi_call_setup:mode = CC_CALL_NORMAL.destianation number = 0.0.0.0*Mar 1 00:38:59.385:rtpspi_call_setup:Passed local_ip_addrs=0x5000001*Mar 1 00:38:59.385:rtpspi_call_setup:Passed local_rtp_port = 16544*Mar 1 00:38:59.385:rtpspi_call_setup:Saved RTCP Session = 0x1AF57E0*Mar 1 00:38:59.385:rtpspi_call_setup:Passed remote rtp port = 0.*Mar 1 00:38:59.389:rtpspi_start_rtcp_session:entered. rtp session mode=0x2, rem rtp=0, rem ip=0x0*Mar 1 00:38:59.389:rtpspi_get_rtcp_mode:entered. rtp_mode = 0x2*Mar 1 00:38:59.389:rtpspi_start_rtcp_session:Starting RTCP session.Local IP addr = 0x5000001, Remote IP addr = 0x0,Local RTP port = 16544, Remote RTP port = 0, mode = 0x2*Mar 1 00:38:59.389:rtpspi_start_rtcp_session:RTP Session creation Success.*Mar 1 00:38:59.389:rtpspi_call_setup:RTP Session creation Success.*Mar 1 00:38:59.389:rtpspi_call_setup:calling cc_api_call_connected()*Mar 1 00:38:59.389:rtpspi_call_setup:Leaving.*Mar 1 00:38:59.393:rtpspi_bridge:entered. conf id = 1, src i/f = 0x1859E88,dest i/f = 0x1964EEC, src call id = 5, dest call id = 4call info = 0x1919140, xmit fn = 0xDA7494, tag = 0*Mar 1 00:38:59.393:rtpspi_get_rtcp_mode:entered. rtp_mode = 0x2*Mar 1 00:38:59.393:rtpspi_modify_rtcp_session_parameters():xmit fn=0xDA7494,dstIF=0x1964EEC, dstCallID=4, voip_mode=0x2, rtp_mode=0x2, ssrc_status=0*Mar 1 00:38:59.393:rtpspi_bridge:Calling cc_api_bridge_done() for 5(0x1AF5400) and 4(0x0).*Mar 1 00:38:59.393:rtpspi_bridge:leaving.*Mar 1 00:38:59.397:rtpspi_caps_ind:Entered. vdb = 0x1859E88 call id = 5, srcCallId = 4*Mar 1 00:38:59.397:rtpspi_caps_ind:caps from VTSP:codec=0x83FB, codec_bytes=0x50,fax rate=0x7F, vad=0x3 modem=0x0*Mar 1 00:38:59.397:rtpspi_get_rtcp_session_parameters():CURRENT VALUES:dstIF=0x1964EEC, dstCallID=4, current_seq_num=0x0*Mar 1 00:38:59.397:rtpspi_get_rtcp_session_parameters():NEW VALUES:dstIF=0x1964EEC, dstCallID=4, current_seq_num=0x261C*Mar 1 00:38:59.397:rtpspi_caps_ind:Caps Used:codec=0x1, codec bytes=80,fax rate=0x1, vad=0x1, modem=0x1, dtmf_relay=0x1, seq_num_start=0x261D*Mar 1 00:38:59.397:rtpspi_caps_ind:calling cc_api_caps_ind().*Mar 1 00:38:59.397:rtpspi_caps_ind:Returning success*Mar 1 00:38:59.397:rtpspi_caps_ack:Entered. call id = 5, srcCallId = 4*Mar 1 00:38:59.397:rtpspi_caps_ack:leaving.*Mar 1 00:38:59.618:rtpspi_call_modify:entered. call-id=5, nominator=0x7, params=0x18DD440*Mar 1 00:38:59.618:rtpspi_call_modify:leaving*Mar 1 00:38:59.618:rtpspi_do_call_modify:Entered. call-id = 5*Mar 1 00:38:59.622:rtpspi_do_call_modify:Remote RTP port changed. New port=16432*Mar 1 00:38:59.622:rtpspi_do_call_modify:Remote IP addrs changed. New IP addrs=0x6000001*Mar 1 00:38:59.622:rtpspi_do_call_modify:new mode 2 is the same as the current mode*Mar 1 00:38:59.622:rtpspi_do_call_modify:Starting new RTCP session.*Mar 1 00:38:59.622:rtpspi_start_rtcp_session:entered. rtp session mode=0x2, rem rtp=16432, rem ip=0x6000001*Mar 1 00:38:59.622:rtpspi_get_rtcp_mode:entered. rtp_mode = 0x2*Mar 1 00:38:59.622:rtpspi_start_rtcp_session:Removing old RTCP session.*Mar 1 00:38:59.622:rtpspi_start_rtcp_session:Starting RTCP session.Local IP addr = 0x5000001, Remote IP addr = 0x6000001,Local RTP port = 16544, Remote RTP port = 16432, mode = 0x2*Mar 1 00:38:59.622:rtpspi_start_rtcp_session:RTCP Timer creation Success. (5)*(5000)*Mar 1 00:38:59.622:rtpspi_start_rtcp_session:RTP Session creation Success.*Mar 1 00:38:59.622:rtpspi_do_call_modify:RTP Session creation Success.*Mar 1 00:38:59.622:rtpspi_do_call_modify:Calling cc_api_call_modify(), result=0x0*Mar 1 00:38:59.626:rtpspi_do_call_modify:success. leaving*Mar 1 00:39:05.019:rtpspi_call_modify:entered. call-id=5, nominator=0x7, params=0x18DD440*Mar 1 00:39:05.019:rtpspi_call_modify:leaving*Mar 1 00:39:05.019:rtpspi_do_call_modify:Entered. call-id = 5*Mar 1 00:39:05.019:rtpspi_do_call_modify:New remote RTP port = old rtp port = 16432*Mar 1 00:39:05.019:rtpspi_do_call_modify:New remote IP addrs = old IP addrs = 0x6000001*Mar 1 00:39:05.019:rtpspi_do_call_modify:Mode changed. new = 3, old = 2*Mar 1 00:39:05.019:rtpspi_get_rtcp_mode:entered. rtp_mode = 0x3*Mar 1 00:39:05.023:rtpspi_modify_rtcp_session_parameters():xmit fn=0xDA7494,dstIF=0x1964EEC, dstCallID=4, voip_mode=0x3, rtp_mode=0x3, ssrc_status=2*Mar 1 00:39:05.023:rtpspi_do_call_modify:RTCP Timer start.*Mar 1 00:39:05.023:rtpspi_do_call_modify:Calling cc_api_call_modify(), result=0x0*Mar 1 00:39:05.023:rtpspi_do_call_modify:success. leaving*Mar 1 00:40:13.786:rtpspi_bridge_drop:entered. src call-id=5, dest call-id=4, tag=0*Mar 1 00:40:13.786:rtpspi_get_rtcp_mode:entered. rtp_mode = 0x3*Mar 1 00:40:13.786:rtpspi_modify_rtcp_session_parameters():xmit fn=0x0,dstIF=0x0, dstCallID=0, voip_mode=0x3, rtp_mode=0x3, ssrc_status=2*Mar 1 00:40:13.786:rtpspi_bridge_drop:leaving*Mar 1 00:40:13.790:rtpspi_call_disconnect:entered. call-id=5, cause=16, tag=0*Mar 1 00:40:13.790:rtpspi_call_disconnect:leaving.*Mar 1 00:40:13.790:rtpspi_do_call_disconnect:Entered. call-id = 5*Mar 1 00:40:13.790:rtpspi_do_call_disconnect:calling rtpspi_call_cleanup(). call-id=5*Mar 1 00:40:13.794:rtpspi_call_cleanup:entered. ccb = 0x1AF5400, call-id=5, rtp port = 16544*Mar 1 00:40:13.794:rtpspi_call_cleanup:releasing ccb cache. RTP port=16544*Mar 1 00:40:13.794:rtpspi_store_call_history_entry():Entered.*Mar 1 00:40:13.794:rtpspi_store_call_history_entry():Leaving.*Mar 1 00:40:13.794:rtpspi_call_cleanup:RTCP Timer Stop.*Mar 1 00:40:13.794:rtpspi_call_cleanup:deallocating RTP port 16544.*Mar 1 00:40:13.794:rtpspi_free_rtcp_session:Entered.*Mar 1 00:40:13.794:rtpspi_free_rtcp_session:Success. Leaving*Mar 1 00:40:13.794::rtpspi_call_cleanup freeing ccb (0x1AF5400)*Mar 1 00:40:13.794:rtpspi_call_cleanup:leaving*Mar 1 00:40:13.794:rtpspi_do_call_disconnect:leavingRelated Commands
debug rtpspi errors
To debug RTP SPI errors, use the debug rtpspi errors EXEC command. Use the no debug rtpspi errors command to turn off debugging.
debug rtpspi errors
no debug rtpspi errors
Syntax Description
This command has no arguments or keywords.
Defaults
No default behavior or values.
Command Modes
EXEC
Command History
12.0(7)XK
This command was introduced on the Cisco MC3810 device and Cisco 3600 series routers (except the Cisco 3620) in a private release that was not generally available.
Usage Guidelines
Caution
Examples
This example shows a debug trace for RTP SPI errors on two gateways. The following example shows the debug trace on the first gateway:
router# debug rtpspi errors00:54:13.272:rtpspi_do_call_modify:new mode 2 is the same as the current mode00:54:18.738:rtpspi_do_call_modify:New remote RTP port = old rtp port = 1645200:54:18.738:rtpspi_do_call_modify:New remote IP addrs = old IP addrs = 0x6000001The following example shows the debug trace on the second gateway:
router# debug rtpspi errors00:54:08:rtpspi_process_timers:00:54:08:rtpspi_process_timers:Timer 0x1A5AF9C expired.00:54:08:rtpspi_process_timers:Timer expired for callID 0x300:54:08:rtpspi_process_timers:00:54:08:rtpspi_process_timers:Timer 0x1A5AF9C expired.00:54:08:rtpspi_process_timers:Timer expired for callID 0x300:54:08:rtpspi_process_timers:00:54:08:rtpspi_process_timers:Timer 0x1A5AF9C expired.00:54:08:rtpspi_process_timers:Timer expired for callID 0x300:54:09:rtpspi_process_timers:00:54:09:rtpspi_process_timers:Timer 0x1A5AFBC expired.00:54:09:rtpspi_process_timers:Timer expired for callID 0x300:54:09:rtpspi_process_timers:00:54:09:rtpspi_process_timers:Timer 0x1A5B364 expired.00:54:09:rtpspi_process_timers:Timer expired for callID 0x3Related Commands
debug rtpspi inout
To debug RTP SPI in/out functions, use the debug rtpspi inout EXEC command. Use the no debug rtpspi inout command to turn off debugging.
debug rtpspi inout
no debug rtpspi inout
Syntax Description
This command has no arguments or keywords.
Defaults
No default behavior or values.
Command Modes
EXEC
Command History
Usage Guidelines
Caution
Examples
The following example shows a debug trace for RTP SPI in/out functions on a gateway:
router# debug rtpspi inout*Mar 1 00:57:24.565:rtpspi_allocate_rtp_port:Entered.*Mar 1 00:57:24.565:rtpspi_allocate_rtp_port:Success. port = 16520. Leaving.*Mar 1 00:57:24.565:rtpspi_call_setup_request:entered.Call Id = 9, dest = 0.0.0.0; callInfo:final dest flag = 0,rtp_session_mode = 0x2,local_ip_addrs = 0x5000001,remote_ip_addrs = 0x0,local rtp port = 16520, remote rtp port = 0*Mar 1 00:57:24.565:rtpspi_call_setup_request:spi_info copied for rtpspi_app_data_t.*Mar 1 00:57:24.565:rtpspi_call_setup_request:leaving*Mar 1 00:57:24.569:rtpspi_call_setup() entered*Mar 1 00:57:24.569:rtpspi_initialize_ccb:Entered*Mar 1 00:57:24.569:rtpspi_initialize_ccb:leaving*Mar 1 00:57:24.569:rtpspi_start_rtcp_session:entered. rtp session mode=0x2, rem rtp=0, rem ip=0x0*Mar 1 00:57:24.569:rtpspi_get_rtcp_mode:entered. rtp_mode = 0x2*Mar 1 00:57:24.569:rtpspi_call_setup:Leaving.*Mar 1 00:57:24.573:rtpspi_bridge:entered. conf id = 3, src i/f = 0x1859E88,dest i/f = 0x1964EEC, src call id = 9, dest call id = 8call info = 0x1919140, xmit fn = 0xDA7494, tag = 0*Mar 1 00:57:24.573:rtpspi_get_rtcp_mode:entered. rtp_mode = 0x2*Mar 1 00:57:24.573:rtpspi_bridge:leaving.*Mar 1 00:57:24.573:rtpspi_caps_ind:Entered. vdb = 0x1859E88 call id = 9, srcCallId = 8*Mar 1 00:57:24.577:rtpspi_caps_ind:Returning success*Mar 1 00:57:24.577:rtpspi_caps_ack:Entered. call id = 9, srcCallId = 8*Mar 1 00:57:24.577:rtpspi_caps_ack:leaving.*Mar 1 00:57:24.818:rtpspi_call_modify:entered. call-id=9, nominator=0x7, params=0x18DD440*Mar 1 00:57:24.818:rtpspi_call_modify:leaving*Mar 1 00:57:24.818:rtpspi_do_call_modify:Entered. call-id = 9*Mar 1 00:57:24.818:rtpspi_start_rtcp_session:entered. rtp session mode=0x2, rem rtp=16396, rem ip=0x6000001*Mar 1 00:57:24.822:rtpspi_get_rtcp_mode:entered. rtp_mode = 0x2*Mar 1 00:57:24.822:rtpspi_do_call_modify:success. leaving*Mar 1 00:57:30.296:rtpspi_call_modify:entered. call-id=9, nominator=0x7, params=0x18DD440*Mar 1 00:57:30.296:rtpspi_call_modify:leaving*Mar 1 00:57:30.300:rtpspi_do_call_modify:Entered. call-id = 9*Mar 1 00:57:30.300:rtpspi_get_rtcp_mode:entered. rtp_mode = 0x3*Mar 1 00:57:30.300:rtpspi_do_call_modify:success. leaving*Mar 1 00:58:39.055:rtpspi_bridge_drop:entered. src call-id=9, dest call-id=8, tag=0*Mar 1 00:58:39.055:rtpspi_get_rtcp_mode:entered. rtp_mode = 0x3*Mar 1 00:58:39.055:rtpspi_bridge_drop:leaving*Mar 1 00:58:39.059:rtpspi_call_disconnect:entered. call-id=9, cause=16, tag=0*Mar 1 00:58:39.059:rtpspi_call_disconnect:leaving.*Mar 1 00:58:39.059:rtpspi_do_call_disconnect:Entered. call-id = 9*Mar 1 00:58:39.059:rtpspi_call_cleanup:entered. ccb = 0x1AF5400, call-id=9, rtp port = 16520*Mar 1 00:58:39.059:rtpspi_store_call_history_entry():Entered.*Mar 1 00:58:39.059:rtpspi_store_call_history_entry():Leaving.*Mar 1 00:58:39.059:rtpspi_free_rtcp_session:Entered.*Mar 1 00:58:39.059:rtpspi_free_rtcp_session:Success. Leaving*Mar 1 00:58:39.063:rtpspi_call_cleanup:leaving*Mar 1 00:58:39.063:rtpspi_do_call_disconnect:leavingRelated Commands
debug rtpspi send-nse
To trigger the RTP SPI software module to send a triple redundant NSE, use the debug rtpspi send-nse EXEC command. Use the no debug rtpspi send-nse to disable this action.
debug rtpspi send-nse call-ID NSE-event-ID
no debug rtpspi send-nse call-ID NSE-event-ID
Syntax Description
call-ID
Specifies the call ID of the active call. The valid range is from 0 to 65535.
NSE-event-ID
Specifies the NSE Event ID. The valid range is from 0 to 255.
Defaults
No default behavior or values.
Command Modes
EXEC
Command History
Examples
The following example shows the RTP SPI software module set to send an NSE:
router# debug rtpspi send-nseRelated Commands
debug rtpspi session
To debug all RTP SPI sessions, use the debug rtpspi session EXEC command. Use the no debug rtpspi session command to turn off debugging.
debug rtpspi session
no debug rtpspi session
Syntax Description
This command has no arguments or keywords.
Defaults
No default behavior or values.
Command Modes
EXEC
Command History
Examples
The following example shows a debug trace for RTP SPI sessions on a gateway:
router# debug rtpspi session*Mar 1 01:01:51.593:rtpspi_allocate_rtp_port:allocated RTP port 16406*Mar 1 01:01:51.593:rtpspi_call_setup:rtp_session_mode = 0x2*Mar 1 01:01:51.593:rtpspi_call_setup:mode = CC_CALL_NORMAL.destianation number = 0.0.0.0*Mar 1 01:01:51.593:rtpspi_call_setup:Passed local_ip_addrs=0x5000001*Mar 1 01:01:51.593:rtpspi_call_setup:Passed local_rtp_port = 16406*Mar 1 01:01:51.593:rtpspi_call_setup:Saved RTCP Session = 0x1AFDFBC*Mar 1 01:01:51.593:rtpspi_call_setup:Passed remote rtp port = 0.*Mar 1 01:01:51.598:rtpspi_start_rtcp_session:Starting RTCP session.Local IP addr = 0x5000001, Remote IP addr = 0x0,Local RTP port = 16406, Remote RTP port = 0, mode = 0x2*Mar 1 01:01:51.598:rtpspi_start_rtcp_session:RTP Session creation Success.*Mar 1 01:01:51.598:rtpspi_call_setup:RTP Session creation Success.*Mar 1 01:01:51.598:rtpspi_call_setup:calling cc_api_call_connected()*Mar 1 01:01:51.598:rtpspi_modify_rtcp_session_parameters():xmit fn=0xDA7494,dstIF=0x1964EEC, dstCallID=10, voip_mode=0x2, rtp_mode=0x2, ssrc_status=0*Mar 1 01:01:51.598:rtpspi_bridge:Calling cc_api_bridge_done() for 11(0x1AF5400) and 10(0x0).*Mar 1 01:01:51.602:rtpspi_caps_ind:caps from VTSP:codec=0x83FB, codec_bytes=0x50,fax rate=0x7F, vad=0x3 modem=0x0*Mar 1 01:01:51.602:rtpspi_get_rtcp_session_parameters():CURRENT VALUES:dstIF=0x1964EEC, dstCallID=10, current_seq_num=0x0*Mar 1 01:01:51.602:rtpspi_get_rtcp_session_parameters():NEW VALUES:dstIF=0x1964EEC, dstCallID=10, current_seq_num=0xF1E*Mar 1 01:01:51.602:rtpspi_caps_ind:Caps Used:codec=0x1, codec bytes=80,fax rate=0x1, vad=0x1, modem=0x1, dtmf_relay=0x1, seq_num_start=0xF1F*Mar 1 01:01:51.602:rtpspi_caps_ind:calling cc_api_caps_ind().*Mar 1 01:01:51.822:rtpspi_do_call_modify:Remote RTP port changed. New port=16498*Mar 1 01:01:51.822:rtpspi_do_call_modify:Remote IP addrs changed. New IP addrs=0x6000001*Mar 1 01:01:51.822:rtpspi_do_call_modify:Starting new RTCP session.*Mar 1 01:01:51.822:rtpspi_start_rtcp_session:Removing old RTCP session.*Mar 1 01:01:51.822:rtpspi_start_rtcp_session:Starting RTCP session.Local IP addr = 0x5000001, Remote IP addr = 0x6000001,Local RTP port = 16406, Remote RTP port = 16498, mode = 0x2*Mar 1 01:01:51.822:rtpspi_start_rtcp_session:RTCP Timer creation Success. (5)*(5000)*Mar 1 01:01:51.826:rtpspi_start_rtcp_session:RTP Session creation Success.*Mar 1 01:01:51.826:rtpspi_do_call_modify:RTP Session creation Success.*Mar 1 01:01:51.826:rtpspi_do_call_modify:Calling cc_api_call_modify(), result=0x0*Mar 1 01:01:57.296:rtpspi_do_call_modify:Mode changed. new = 3, old = 2*Mar 1 01:01:57.296:rtpspi_modify_rtcp_session_parameters():xmit fn=0xDA7494,dstIF=0x1964EEC, dstCallID=10, voip_mode=0x3, rtp_mode=0x3, ssrc_status=2*Mar 1 01:01:57.296:rtpspi_do_call_modify:RTCP Timer start.*Mar 1 01:01:57.296:rtpspi_do_call_modify:Calling cc_api_call_modify(), result=0x0*Mar 1 01:03:06.108:rtpspi_modify_rtcp_session_parameters():xmit fn=0x0,dstIF=0x0, dstCallID=0, voip_mode=0x3, rtp_mode=0x3, ssrc_status=2*Mar 1 01:03:06.112:rtpspi_do_call_disconnect:calling rtpspi_call_cleanup(). call-id=11*Mar 1 01:03:06.112:rtpspi_call_cleanup:releasing ccb cache. RTP port=16406*Mar 1 01:03:06.112:rtpspi_call_cleanup:RTCP Timer Stop.*Mar 1 01:03:06.112:rtpspi_call_cleanup:deallocating RTP port 16406.*Mar 1 01:03:06.112::rtpspi_call_cleanup freeing ccb (0x1AF5400)Related Commands
debug sdlc
To display information on Synchronous Data Link Control (SDLC) frames received and sent by any router serial interface involved in supporting SDLC end station functions, use the debug sdlc privileged EXEC command. The no form of this command disables debugging output.
debug sdlc
no debug sdlc
Syntax Description
This command has no arguments or keywords.
Usage Guidelines
Note
Examples
The following is sample output from the debug sdlc command:
Router# debug sdlcSDLC: Sending RR at location 4Serial3: SDLC O (12495952) C2 CONNECT (2) RR P/F 6Serial3: SDLC I (12495964) [C2] CONNECT (2) RR P/F 0 (R) [VR: 6 VS: 0]Serial3: SDLC T [C2] 12496064 CONNECT 12496064 0SDLC: Sending RR at location 4Serial3: SDLC O (12496064) C2 CONNECT (2) RR P/F 6Serial3: SDLC I (12496076) [C2] CONNECT (2) RR P/F 0 (R) [VR: 6 VS: 0]Serial3: SDLC T [C2] 12496176 CONNECT 12496176 0The following line of output indicates that the router is sending a Receiver Ready packet at location 4 in the code:
SDLC: Sending RR at location 4The following line of output describes a frame output event:
Serial1/0: SDLC O 04 CONNECT (285) IFRAME P/F 6Table 162 describes the significant fields shown in the display.
The following line of output describes a frame input event:
Serial1/0: SDLC I 02 CONNECT (16) IFRAME P 7 0,[VR: 7 VS: 0]Table 163 describes the significant fields shown in the display.
The following line of output describes a frame timer event:
Serial1/0: SDLC T 02 CONNECT 0x9CB69E8 P 0Table 164 describes the significant fields shown in the display.
Related Commands
debug list
Filters debugging information on a per-interface or per-access list basis.
debug sdlc local-ack
To display information on the local acknowledgment feature, use the debug sdlc local-ack privileged EXEC command. The no form of this command disables debugging output.
debug sdlc local-ack [number]
no debug sdlc local-ack [number]
Syntax Description
Usage Guidelines
You can select the frame types you want to monitor; the frame types correspond to bit flags. You can select 1, 2, 4, or 7, which is the decimal value of the bit flag settings. If you select 1, the octet is set to 00000001. If you select 2, the octet is set to 0000010. If you select 4, the octet is set to 00000100. If you want to select all frame types, select 7; the octet is 00000111. The default is 7 for all events. Table 165 defines these bit flags.
Caution
Examples
The following is sample output from the debug sdlc local-ack command:
The first line shows the input to the SDLC local acknowledgment state machine:
SLACK (Serial3): Input = Network, LinkupRequestTable 166 describes the significant fields shown in the display.
The second line shows the change in the SDLC local acknowledgment state machine. In this case the AwaitSdlcOpen state is an internal state that has not changed while this display was captured.
SLACK (Serial3): Old State = AwaitSdlcOpen New State = AwaitSdlcOpenThe third line shows the output from the SDLC local acknowledgment state machine:
SLACK (Serial3): Output = SDLC, SNRMdebug sdlc packet
To display packet information on Synchronous Data Link Control (SDLC) frames received and sent by any router serial interface involved in supporting SDLC end station functions, use the debug sdlc packet privileged EXEC command. The no form of this command disables debugging output.
debug sdlc packet [max-bytes]
no debug sdlc packet [max-bytes]
Syntax Description
Usage Guidelines
This command requires intensive CPU processing; therefore, we recommend not using it when the router is expected to handle normal network loads, such as in a production environment. Instead, use this command when network response is noncritical. We also recommend that you use this command by itself, rather than in conjunction with other debug commands.
Examples
The following is sample output from the debug sdlc packet command with the packet display limited to 20 bytes of data:
Router# debug sdlc packet 20Serial3 SDLC Output00000 C3842C00 02010010 019000C5 C5C5C5C5 Cd.........EEEEE00010 C5C5C5C5 EEEESerial3 SDLC Output00000 C3962C00 02010011 039020F2 Co.........2Serial3 SDLC Output00000 C4962C00 0201000C 039020F2 Do.........2Serial3 SDLC Input00000 C491 Djdebug sdllc
To display information about data link-layer frames transferred between a device on a Token Ring and a device on a serial line via a router configured with the SDLLC feature, use the debug sdllc privileged EXEC command. The no form of this command disables debugging output.
debug sdllc
no debug sdllc
Syntax Description
This command has no arguments or keywords.
Usage Guidelines
The SDLLC feature translates between the SDLC link-layer protocol used to communicate with devices on a serial line and the LLC2 link-layer protocol used to communicate with devices on a Token Ring.
The router configured with the SDLLC feature must be attached to the serial line. The router sends and receives frames on behalf of the serial device on the attached serial line but acts as an SDLC station.
The topology between the router configured with the SDLLC feature and the Token Ring is network dependent and is not limited by the SDLLC feature.
Examples
The following is sample output from the debug sdllc command between link-layer peers from the perspective of the SDLLC-configured router:
Router# debug sdllcSDLLC: rx explorer rsp, da 4000.2000.1001, sa C000.1020.1000, rif8840.0011.00A1.0050SDLLC: tx short xid, sa 4000.2000.1001, da C000.1020.1000, rif88C0.0011.00A1.0050, dsap 4 ssap 4SDLLC: tx long xid, sa 4000.2000.1001, da C000.1020.1000, rif88C0.0011.00A1.0050, dsap 4 ssap 4Rcvd SABME/LINKUP_REQ pak from TR hostSDLLCERR: not from our partner, pak dropped, da 4000.2000.1001,sa C000.1020.1000, rif 8840.0011.00A1.0050, partner = 5000.1040.1003Table 167 describes the significant fields shown in the display.
The following line indicates that an explorer frame response was received by the router at address 4000.2000.1001 from the FEP at address C000.1020.1000 with the specified RIF. The original explorer sent to the FEP from the router is not monitored as part of the debug sdllc command.
SDLLC: rx explorer rsp, da 4000.2000.1001, sa C000.1020.1000, rif8840.0011.00A1.0050The following line indicates that the router sent the null XID (Type 0) to the FEP. The debugging information does not include the response to the XID message sent by the FEP to the router.
SDLLC: tx short xid, sa 4000.2000.1001, da C000.1020.1000, rif88C0.0011.00A1.0050, dsap 4 ssap 4The following line indicates that the router sent the XID command (Format 0 Type 2) to the FEP:
SDLLC: tx long xid, sa 4000.2000.1001, da C000.1020.1000, rif88C0.0011.00A1.0050, dsap 4 ssap 4The following line is the SABME response to the XID command previously sent by the router to the FEP:
Rcvd SABME/LINKUP_REQ pak from TR host