-
Cisco IOS Debug Command Reference, Release 12.2
-
About the Cisco IOS Software Documentation
-
Using Cisco IOS Software
-
Using Debug Commands
-
Conditionally Triggered Debugging
-
Commands: debug aaa accounting through debug appn trs
-
Commands: debug arap through debug clns events
-
Commands: debug clns igrp packets through debug dmsp doc-to-fax
-
Commands: debug dmsp fax-to-doc through debug ip drp
-
Commands: debug ip dvmrp through debug ip pim
-
Commands: debug ip pim atm through debug ip wccp packets
-
Commands: debug ipx ipxwan through debug lane client
-
Commands: debug lane config through debug mmoip aaa
-
Commands: debug modem through debug ppp
-
Commands: debug ppp bap through debug sdllc
-
Commands: debug serial interface through debug tacacs events
-
Commands: debug tag-switching adjacency through debug tag-switching xtagatm vc
-
Commands: debug tarp events through debug voip settlement transaction
-
Commands: debug vpdn through debug xns routing
-
Appendix A: X.25 Cause and Diagnostic Codes
-
Appendix B: ISDN Switch Types, Codes, and Values
-
 Feedback
Table Of Contents
debug ip ospf mpls traffic-eng advertisements
debug ip dvmrp
To display information on Distance Vector Multiprotocol Routing Protocol (DVMRP) packets received and sent, use the debug ip dvmrp privileged EXEC command. The no form of this command disables debugging output.
debug ip dvmrp [detail [access-list] [in | out]]
no debug ip dvmrp [detail [access-list] [in | out]]
Syntax Description
Usage Guidelines
Use the debug ip dvmrp detail command with care. This command generates a substantial amount of output and can interrupt other activity on the router when it is invoked.
Examples
The following is sample output from the debug ip dvmrp command:
Router# debug ip dvmrpDVMRP: Received Report on Ethernet0 from 172.19.244.10DVMRP: Received Report on Ethernet0 from 172.19.244.11DVMRP: Building Report for Ethernet0 224.0.0.4DVMRP: Send Report on Ethernet0 to 224.0.0.4DVMRP: Sending IGMP Reports for known groups on Ethernet0DVMRP: Received Report on Ethernet0 from 172.19.244.10DVMRP: Received Report on Tunnel0 from 192.168.199.254DVMRP: Received Report on Tunnel0 from 192.168.199.254DVMRP: Received Report on Tunnel0 from 192.168.199.254DVMRP: Received Report on Tunnel0 from 192.168.199.254DVMRP: Received Report on Tunnel0 from 192.168.199.254DVMRP: Received Report on Tunnel0 from 192.168.199.254DVMRP: Building Report for Tunnel0 224.0.0.4DVMRP: Send Report on Tunnel0 to 192.168.199.254DVMRP: Send Report on Tunnel0 to 192.168.199.254DVMRP: Send Report on Tunnel0 to 192.168.199.254DVMRP: Send Report on Tunnel0 to 192.168.199.254DVMRP: Radix tree walk suspensionDVMRP: Send Report on Tunnel0 to 192.168.199.254The following lines show that the router received DVMRP routing information and placed it in the mroute table:
DVMRP: Received Report on Ethernet0 from 172.19.244.10DVMRP: Received Report on Ethernet0 from 172.19.244.11The following lines show that the router is creating a report to send to another DVMRP router:
DVMRP: Building Report for Ethernet0 224.0.0.4DVMRP: Send Report on Ethernet0 to 224.0.0.4Table 71 provides a list of internet multicast addresses supported for host IP implementations.
The following lines show that a protocol update report has been sent to all known multicast groups. Hosts use IGMP reports to communicate with routers and to request to join a multicast group. In this case, the router is sending an IGMP report for every known group to the host, which is running mrouted. The host the responds as though the router was a host on the LAN segment that wants to receive multicast packets for the group.
DVMRP: Sending IGMP Reports for known groups on Ethernet0The following is sample output from the debug ip dvmrp detail command:
Router# debug ip dvmrp detailDVMRP: Sending IGMP Reports for known groups on Ethernet0DVMRP: Advertise group 224.2.224.2 on Ethernet0DVMRP: Advertise group 224.2.193.34 on Ethernet0DVMRP: Advertise group 224.2.231.6 on Ethernet0DVMRP: Received Report on Tunnel0 from 192.168.199.254DVMRP: Origin 150.166.53.0/24, metric 13, distance 0DVMRP: Origin 150.166.54.0/24, metric 13, distance 0DVMRP: Origin 150.166.55.0/24, metric 13, distance 0DVMRP: Origin 150.166.56.0/24, metric 13, distance 0DVMRP: Origin 150.166.92.0/24, metric 12, distance 0DVMRP: Origin 150.166.100.0/24, metric 12, distance 0DVMRP: Origin 150.166.101.0/24, metric 12, distance 0DVMRP: Origin 150.166.142.0/24, metric 8, distance 0DVMRP: Origin 150.166.200.0/24, metric 12, distance 0DVMRP: Origin 150.166.237.0/24, metric 12, distance 0DVMRP: Origin 150.203.5.0/24, metric 8, distance 0The following lines show that this group is available to the DVMRP router. The mrouted process on the host will forward the source and multicast information for this group through the DVMRP cloud to other members.
DVMRP: Advertise group 224.2.224.2 on Ethernet0The following lines show the DVMRP route information:
DVMRP: Origin 150.166.53.0/24, metric 13, distance 0DVMRP: Origin 150.166.54.0/24, metric 13, distance 0The metric is the number of hops the route has covered, and the distance is the administrative distance.
debug ip eigrp
To display information on Enhanced Interior Gateway Routing Protocol (EIGRP) packets, use the debug ip eigrp privileged EXEC command. The no form of this command disables debugging output.
debug ip eigrp
no debug ip eigrp
Syntax Description
This command has no arguments or keywords.
Usage Guidelines
This command helps you analyze the packets that are sent and received on an interface. Because the debug ip eigrp command generates a substantial amount of output, only use it when traffic on the network is light.
Examples
The following is sample output from the debug ip eigrp command:
Router# debug ip eigrpIP-EIGRP: Processing incoming UPDATE packetIP-EIGRP: Ext 192.168.3.0 255.255.255.0 M 386560 - 256000 130560 SM 360960 - 256000 104960IP-EIGRP: Ext 192.168.0.0 255.255.255.0 M 386560 - 256000 130560 SM 360960 - 256000 104960IP-EIGRP: Ext 192.168.3.0 255.255.255.0 M 386560 - 256000 130560 SM 360960 - 256000 104960IP-EIGRP: 172.69.43.0 255.255.255.0, - do advertise out Ethernet0/1IP-EIGRP: Ext 172.69.43.0 255.255.255.0 metric 371200 - 256000 115200IP-EIGRP: 192.135.246.0 255.255.255.0, - do advertise out Ethernet0/1IP-EIGRP: Ext 192.135.246.0 255.255.255.0 metric 46310656 - 45714176 596480IP-EIGRP: 172.69.40.0 255.255.255.0, - do advertise out Ethernet0/1IP-EIGRP: Ext 172.69.40.0 255.255.255.0 metric 2272256 - 1657856 614400IP-EIGRP: 192.135.245.0 255.255.255.0, - do advertise out Ethernet0/1IP-EIGRP: Ext 192.135.245.0 255.255.255.0 metric 40622080 - 40000000 622080IP-EIGRP: 192.135.244.0 255.255.255.0, - do advertise out Ethernet0/1Table 72 describes the significant fields shown in the display.
debug ip error
To display IP errors, use the debug ip error command in privileged EXEC mode. To disable debugging errors, use the no form of this command.
debug ip error access-list-number [detail] [dump]
no debug ip error
Syntax Description
Defaults
No default behavior or values
Command Modes
Privileged EXEC
Usage Guidelines
This command is used for IP error debugging. The output displays IP errors which are locally detected by this router.
CautionEnabling this command will generate output only if IP errors occur. However, if the router starts to receive many packets that contain errors, substantial output may be generated and severely affect system performance. This command should be used with caution in production networks. It should only be enabled when traffic on the IP network is low, so other activity on the system is not adversely affected. Enabling the detail and dump keywords use the highest level of system resources of the available configuration options for this command, so a high level of caution should be applied when enabling either of these keywords.
Caution
Examples
The following is sample output from the debug ip error command:
debug ip errorIP packet errors debugging is on04:04:45:IP:s=10.8.8.1 (Ethernet0/1), d=10.1.1.1, len 28, dispose ip.hopcountThe IP error in the above output was caused when the router attempted to forward a packet with a time-to-live (TTL) value of 0. The "ip.hopcount" traffic counter is incremented when a packet is dropped because of an error. This error is also displayed in the output of the show ip traffic command by the "bad hop count" traffic counter.
Table 73 describes the significant fields shown in the display.
The following is sample output from the debug ip error command enabled with the detail keyword:
debug ip error detailIP packet errors debugging is on (detailed)
1d08h:IP:s=10.0.19.100 (Ethernet0/1), d=10.1.1.1, len 28, dispose udp.noport
1d08h: UDP src=41921, dst=33434
1d08h:IP:s=10.0.19.100 (Ethernet0/1), d=10.2.2.2, len 28, dispose ip.hopcount
1d08h: UDP src=33691, dst=33434The detailed output includes layer 4 information in addition to the standard output. The IP error in the above output was caused when the router received a UDP packet when no application was listening to the UDP port. The "udp.noport" traffic counter is incremented when the router drops a UDP packet because of this error. This error is also displayed in the output of the show ip traffic command by the "no port" traffic counter under "UDP statistics."
Table 74 describes the significant fields shown in the display.
The following is sample output from the debug ip error command enabled with the detail and dump keywords:
debug ip error detail dumpIP packet errors debugging is on (detailed) (dump)1d08h:IP:s=10.0.19.100 (Ethernet0/1), d=10.1.1.1, len 28, dispose udp.noport1d08h: UDP src=37936, dst=3343403D72360: 0001 42AD4242 ..B-BB03D72370:0002FCA5 DC390800 4500001C 30130000 ..|%\9..E...0...03D72380:01116159 0A001364 0A010101 9430829A ..aY...d.....0..03D72390:0008C0AD ..@-1d08h:IP:s=10.0.19.100 (Ethernet0/1), d=10.2.2.2, len 28, dispose ip.hopcount1d08h: UDP src=41352, dst=3343403C01600: 0001 42AD4242 ..B-BB03C01610:0002FCA5 DC390800 4500001C 302A0000 ..|%\9..E...0*..03C01620:01116040 0A001364 0A020202 A188829A ..`@...d....!...03C01630:0008B253 ..2S
Note
The output from the debug ip error command, when the dump keyword is enabled, provides raw packet data in hexadecimal and ASCII forms. This addtional output is displayed in addition to the standard output. The dump keyword can be used with all of the available configuration options of this command.
Table 75 describes the standard output fields shown in the display.
Related Commands
debug ip ftp
To activate the debugging option to track the transactions submitted during an FTP session, use the debug ip ftp privileged EXEC command. To disable debugging output, use the no form of this command.
debug ip ftp
no debug ip ftp
Syntax Description
This command has no arguments or keywords.
Usage Guidelines
The debug ip ftp command is useful for debugging problems associated with FTP.
Examples
The following is an example of the debug ip ftp command:
Router# debug ip ftpFTP transactions debugging is onThe following is sample output from the debug ip ftp command:
FTP: 220 ProFTPD 1.2.0pre8 Server (DFW Nostrum FTP Server) [defiant.dfw.nostrum.com]Dec 27 22:12:09.133: FTP: ---> USER routerDec 27 22:12:09.133: FTP: 331 Password required for router.Dec 27 22:12:09.137: FTP: ---> PASS WQHK5JY2Dec 27 22:12:09.153: FTP: 230 Anonymous access granted, restrictions apply.Dec 27 22:12:09.153: FTP: ---> TYPE IDec 27 22:12:09.157: FTP: 200 Type set to I.Dec 27 22:12:09.157: FTP: ---> PASV..............Dec 27 22:12:09.173: FTP: ---> QUITDec 27 22:12:09.181: FTP: 221 Goodbye.
debug ip http authentication
To troubleshoot HTTP authentication problems, use privileged EXEC command. The no form of this command disables debugging output.
debug ip http authentication
no debug ip http authentication
Syntax Description
This command has no arguments or keywords.
Usage Guidelines
The debug ip http authentication command displays the authentication method the router attempted and authentication-specific status messages.
Examples
The following is sample output from the debug ip http authentication command:
Router# debug ip http authenticationAuthentication for url `/' `/' level 15 privless `/'Authentication username = `local15' priv-level = 15 auth-type = localTable 76 describes the significant fields shown in the display.
debug ip http ezsetup
To display the configuration changes that occur during the EZ Setup process, use the debug ip http ezsetup privileged EXEC command. The no form of this command disables debugging output.
debug ip http ezsetup
no debug ip http ezsetup
Syntax Description
This command has no arguments or keywords.
Usage Guidelines
Use the debug ip http ezsetup command to verify the EZ Setup actions without changing the configuration of the router.
EZ Setup is a form you fill out to perform basic router configuration from most HTML browsers.
Examples
The following is sample output from the debug ip http ezsetup that shows the configuration changes for the router when the EZ Setup form has been submitted:
Router# debug ip http ezsetupservice timestamps debugservice timestamps logservice password-encryption!hostname router-name!enable secret router-pwline vty 0 4password router-pw!interface ethernet 0ip address 172.69.52.9 255.255.255.0no shutdownip helper-address 172.31.2.132ip name-server 172.31.2.132isdn switch-type basic-5essusername Remote-name password Remote-chapinterface bri 0ip unnumbered ethernet 0encapsulation pppno shutdowndialer map ip 192.168.254.254 speed 56 name Remote-name Remote-numberisdn spid1 spid1isdn spid2 spid2ppp authentication chap callindialer-group 1!ip classlessaccess-list 101 deny udp any any eq snmpaccess-list 101 deny udp any any eq ntpaccess-list 101 permit ip any anydialer-list 1 list 101ip route 0.0.0.0 0.0.0.0 192.168.254.254ip route 192.168.254.254 255.255.255.255 bri 0logging bufferedsnmp-server community public ROip http serverip classlessip subnet-zero!endRelated Commands
Displays individual tokens parsed by the HTTP server.
Displays HTTP server transaction processing.
Displays the URLs accessed from the router.
debug ip http ssi
To display information about the HTML SSI EXEC command or HTML SSI ECHO command, use the debug ip http ssi privileged EXEC command. The no form of this command disables debugging output.
debug ip http ssi
no debug ip http ssi
Syntax Description
This command has no arguments or keywords.
Examples
The following is sample output from the debug ip http ssi command:
Router# debug ip http ssiHTML: filtered command `exec cmd="show users"'HTML: SSI command `exec'HTML: SSI tag `cmd' = "show users"HTML: Executing CLI `show users' in mode `exec' doneThe following line shows the contents of the SSI EXEC command:
HTML: filtered command `exec cmd="show users"'The following line indicates the type of SSI command that was requested:
HTML: SSI command `exec'The following line shows the argument show users assigned to the tag cmd:
HTML: SSI tag 'cmd' = "show users"The following line indicates that the
show users command is being executed in EXEC mode:
HTML: Executing CLI `show users' in mode `exec' donedebug ip http token
To display individual tokens parsed by the HTTP server, use the debug ip http token privileged EXEC command. The no form of this command disables debugging output.
debug ip http token
no debug ip http token
Syntax Description
This command has no arguments or keywords.
Usage Guidelines
Use the debug ip http token command to display low-level HTTP server parsings. To display high-level HTTP server parsings, use the debug ip http transaction command.
Examples
The following is part of a sample output from the debug ip http token command. In this example, the browser accessed the router's home page http://router-name/. The output gives the token parsed by the HTTP server and its length.
Router# debug ip http tokenHTTP: token len 3: 'GET'HTTP: token len 1: ' 'HTTP: token len 1: '/'HTTP: token len 1: ' 'HTTP: token len 4: 'HTTP'HTTP: token len 1: '/'HTTP: token len 1: '1'HTTP: token len 1: '.'HTTP: token len 1: '0'HTTP: token len 2: '\15\12'HTTP: token len 7: 'Referer'HTTP: token len 1: ':'HTTP: token len 1: ' 'HTTP: token len 4: 'http'HTTP: token len 1: ':'HTTP: token len 1: '/'HTTP: token len 1: '/'HTTP: token len 3: 'www'HTTP: token len 1: '.'HTTP: token len 3: 'thesite'HTTP: token len 1: '.'HTTP: token len 3: 'com'HTTP: token len 1: '/'HTTP: token len 2: '\15\12'HTTP: token len 10: 'Connection'HTTP: token len 1: ':'HTTP: token len 1: ' 'HTTP: token len 4: 'Keep'HTTP: token len 1: '-'HTTP: token len 5: 'Alive'HTTP: token len 2: '\15\12'HTTP: token len 4: 'User'HTTP: token len 1: '-'HTTP: token len 5: 'Agent'HTTP: token len 1: ':'HTTP: token len 1: ' 'HTTP: token len 7: 'Mozilla'HTTP: token len 1: '/'HTTP: token len 1: '2'HTTP: token len 1: '.'...Related Commands
Displays the configuration changes that occur during the EZ Setup process.
Displays HTTP server transaction processing.
Displays the URLs accessed from the router.
debug ip http transaction
To display HTTP server transaction processing, use the debug ip http transaction privileged EXEC command. The no form of this command disables debugging output.
debug ip http transaction
no debug ip http transaction
Syntax Description
This command has no arguments or keywords.
Usage Guidelines
Use the debug ip http transaction command to display what the HTTP server is parsing at a high level. To display what the HTTP server is parsing at a low level, use the debug ip http token command.
Examples
The following is sample output from the debug ip http transaction command. In this example, the browser accessed the router's home page http://router-name/.
Router# debug ip http transactionHTTP: parsed uri '/'HTTP: client version 1.0HTTP: parsed extension RefererHTTP: parsed line http://www.company.com/HTTP: parsed extension ConnectionHTTP: parsed line Keep-AliveHTTP: parsed extension User-AgentHTTP: parsed line Mozilla/2.01 (X11; I; FreeBSD 2.1.0-RELEASE i386)HTTP: parsed extension HostHTTP: parsed line router-nameHTTP: parsed extension AcceptHTTP: parsed line image/gif, image/x-xbitmap, image/jpeg, image/HTTP: parsed extension AuthorizationHTTP: parsed authorization type BasicHTTP: received GET ''Table 77 lists describes some of the fields in the output.
Related Commands
Displays the configuration changes that occur during the EZ Setup process.
Displays individual tokens parsed by the HTTP server.
Shows the URLs accessed from the router.
debug ip http url
To show the URLs accessed from the router, use the debug ip http url privileged EXEC command. The no form of this command disables debugging output.
debug ip http url
no debug ip http url
Syntax Description
This command has no arguments or keywords.
Usage Guidelines
Use the debug ip http url command to keep track of the URLs that are accessed and to determine from which hosts the URLs are accessed.
Examples
The following output is from the debug ip http url command. In this example, the HTTP server accessed the URLs and /exec. The output shows the URL being requested and the IP address of the host requesting the URL.
Router# debug ip http urlHTTP: processing URL '/' from host 172.31.2.141HTTP: processing URL '/exec' from host 172.31.2.141Related Commands
Displays the configuration changes that occur during the EZ Setup process.
Displays individual tokens parsed by the HTTP server.
Displays HTTP server transaction processing.
debug ip icmp
To display information on Internal Control Message Protocol (ICMP) transactions, use the debug ip icmp privileged EXEC command. The no form of this command disables debugging output.
debug ip icmp
no debug ip icmp
Syntax Description
This command has no arguments or keywords.
Usage Guidelines
This command helps you determine whether the router is sending or receiving ICMP messages. Use it, for example, when you are troubleshooting an end-to-end connection problem.
Note
Examples
The following is sample output from the debug ip icmp command:
Router# debug ip icmpICMP: rcvd type 3, code 1, from 10.95.192.4ICMP: src 10.56.0.202, dst 172.69.16.1, echo replyICMP: dst (10.120.1.0) port unreachable rcv from 10.120.1.15ICMP: src 172.69.12.35, dst 172.69.20.7, echo replyICMP: dst (255.255.255.255) protocol unreachable rcv from 10.31.7.21ICMP: dst (10.120.1.0) port unreachable rcv from 10.120.1.15ICMP: dst (255.255.255.255) protocol unreachable rcv from 10.31.7.21ICMP: dst (10.120.1.0) port unreachable rcv from 10.120.1.15ICMP: src 10.56.0.202, dst 172.69.16.1, echo replyICMP: dst (10.120.1.0) port unreachable rcv from 10.120.1.15ICMP: dst (255.255.255.255) protocol unreachable rcv from 10.31.7.21ICMP: dst (10.120.1.0) port unreachable rcv from 10.120.1.15Table 78 describes the significant fields shown in the display.
Table 79 describes the significant fields in the second line of the display.
Other messages that the debug ip icmp command can generate follow.
When an IP router or host sends out an ICMP mask request, the following message is generated when the router sends a mask reply:
ICMP: sending mask reply (255.255.255.0) to 172.69.80.23 via Ethernet0The following two lines are examples of the two forms of this message. The first form is generated when a mask reply comes in after the router sends out a mask request. The second form occurs when the router receives a mask reply with a nonmatching sequence and ID. Refer to Appendix I of RFC 950, Internet Standard Subnetting Procedures, for details.
ICMP: mask reply 255.255.255.0 from 172.69.80.31ICMP: unexpected mask reply 255.255.255.0 from 172.69.80.32The following output indicates that the router sent a redirect packet to the host at address 172.69.80.31, instructing that host to use the gateway at address 172.69.80.23 in order to reach the host at destination address 172.69.1.111:
ICMP: redirect sent to 172.69.80.31 for dest 172.69.1.111 use gw 172.69.80.23The following message indicates that the router received a redirect packet from the host at address 172.69.80.23, instructing the router to use the gateway at address 172.69.80.28 in order to reach the host at destination address 172.69.81.34:
ICMP: redirect rcvd from 172.69.80.23 -- for 172.69.81.34 use gw 172.69.80.28The following message is displayed when the router sends an ICMP packet to the source address (172.69.94.31 in this case), indicating that the destination address (172.69.13.33 in this case) is unreachable:
ICMP: dst (172.69.13.33) host unreachable sent to 172.69.94.31The following message is displayed when the router receives an ICMP packet from an intermediate address (172.69.98.32 in this case), indicating that the destination address (172.69.13.33 in this case) is unreachable:
ICMP: dst (172.69.13.33) host unreachable rcv from 172.69.98.32Depending on the code received (as Table 78 describes), any of the unreachable messages can have any of the following "strings" instead of the "host" string in the message:
netprotocolportfrag. needed and DF setsource route failedprohibitedThe following message is displayed when the TTL in the IP header reaches zero and a time exceed ICMP message is sent. The fields are self-explanatory.
ICMP: time exceeded (time to live) send to 10.95.1.4 (dest was 172.69.1.111)The following message is generated when parameters in the IP header are corrupted in some way and the parameter problem ICMP message is sent. The fields are self-explanatory.
ICMP: parameter problem sent to 128.121.1.50 (dest was 172.69.1.111)Based on the preceding information, the remaining output can be easily understood:
ICMP: parameter problem rcvd 172.69.80.32ICMP: source quench rcvd 172.69.80.32ICMP: source quench sent to 128.121.1.50 (dest was 172.69.1.111)ICMP: sending time stamp reply to 172.69.80.45ICMP: sending info reply to 172.69.80.12ICMP: rdp advert rcvd type 9, code 0, from 172.69.80.23ICMP: rdp solicit rcvd type 10, code 0, from 172.69.80.43debug ip igmp
To display Internet Group Management Protocol (IGMP) packets received and sent, and IGMP-host related events, use the debug ip igmp privileged EXEC command. To disable debugging output, use the no form of this command.
debug ip igmp
no debug ip igmp
Syntax Description
This command has no arguments or keywords.
Defaults
None
Command History
10.2
This command was introduced.
12.1(3)T
Additional fields were added to the output of this command to support the Source Specific Multicast (SSM) feature.
Usage Guidelines
This command helps discover whether the IGMP processes are functioning. In general, if IGMP is not working, the router process never discovers that another host is on the network that is configured to receive multicast packets. In dense mode, this situation will result in packets being delivered intermittently (a few every 3 minutes). In sparse mode, packets will never be delivered.
Use this command in conjunction with the debug ip pim and debug ip mrouting commands to observe additional multicast activity and to learn the status of the multicast routing process, or why packets are forwarded out of particular interfaces.
Examples
The following is sample output from the debug ip igmp command:
Router# debug ip igmpIGMP: Received Host-Query from 172.69.37.33 (Ethernet1)IGMP: Received Host-Report from 172.69.37.192 (Ethernet1) for 224.0.255.1IGMP: Received Host-Report from 172.69.37.57 (Ethernet1) for 224.2.127.255IGMP: Received Host-Report from 172.69.37.33 (Ethernet1) for 225.2.2.2The messages displayed by the debug ip igmp command show query and report activity received from other routers and multicast group addresses.
The following is sample output from the debug ip igmp command when SSM is enabled. Because IGMP Version 3 lite (IGMP v3lite) requires the host to send IGMP Version 2 (IGMPv2) packets, IGMPv2 host reports also will be displayed in response to the router IGMPv2 queries. If SSM is disabled, the word "ignored" will be displayed in the debug ip igmp command output.
IGMP:Received v3-lite Report from 10.0.119.142 (Ethernet3/3), group count 1IGMP:Received v3 Group Record from 10.0.119.142 (Ethernet3/3) for 232.10.10.10IGMP:Update source 1.1.1.1IGMP:Send v2 Query on Ethernet3/3 to 224.0.0.1IGMP:Received v2 Report from 10.0.119.142 (Ethernet3/3) for 232.10.10.10IGMP:Update source 1.1.1.1Related Commands
debug ip mrm
Displays MRM control packet activity.
debug ip pim
Displays PIM packets received and sent, and PIM-related events.
debug ip igrp events
To display summary information on Interior Gateway Routing Protocol (IGRP) routing messages that indicate the source and destination of each update, and the number of routes in each update, use the debug ip igrp events privileged EXEC command. The no form of this command disables debugging output.
debug ip igrp events [ip-address]
no debug ip igrp events [ip-address]
Syntax Description
Usage Guidelines
If the IP address of an IGRP neighbor is specified, the resulting debug ip igrp events output includes messages describing updates from that neighbor and updates that the router broadcasts toward that neighbor. Messages are not generated for each route.
This command is particularly useful when there are many networks in your routing table. In this case, using debug ip igrp transactions could flood the console and make the router unusable. Use debug ip igrp events instead to display summary routing information.
Examples
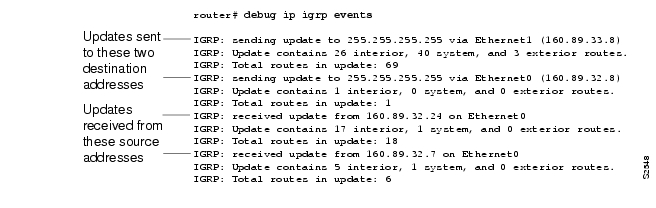
The following is sample output from the debug ip igrp events command:
This shows that the router has sent two updates to the broadcast address 255.255.255.255. The router also received two updates. Three lines of output describe each of these updates.
The first line indicates whether the router sent or received the update packet, the source or destination address, and the interface through which the update was sent or received. If the update was sent, the IP address assigned to this interface is shown (in parentheses).
IGRP: sending update to 255.255.255.255 via Ethernet1 (160.89.33.8)The second line summarizes the number and types of routes described in the update:
IGRP: Update contains 26 interior, 40 system, and 3 exterior routes.The third line indicates the total number of routes described in the update:
IGRP: Total routes in update: 69debug ip igrp transactions
To display transaction information on Interior Gateway Routing Protocol (IGRP) routing transactions, use the debug ip igrp transactions privileged EXEC command. The no form of this command disables debugging output.
debug ip igrp transactions [ip-address]
no debug ip igrp transactions [ip-address]
Syntax Description
Usage Guidelines
If the IP address of an IGRP neighbor is specified, the resulting debug ip igrp transactions output includes messages describing updates from that neighbor and updates that the router broadcasts toward that neighbor.
When many networks are in your routing table, the debug ip igrp transactions command can flood the console and make the router unusable. In this case, use the debug ip igrp events command instead to display summary routing information.
Examples
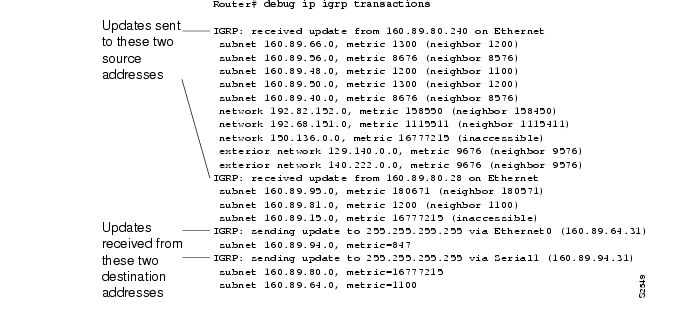
The following is sample output from the debug ip igrp transactions command:
The output shows that the router being debugged has received updates from two other routers on the network. The router at source address 160.89.80.240 sent information about ten destinations in the update; the router at source address 160.89.80.28 sent information about three destinations in its update. The router being debugged also sent updates—in both cases to the broadcast address 255.255.255.255 as the destination address.
On the second line the first field refers to the type of destination information: "subnet" (interior), "network" (system), or "exterior" (exterior). The second field is the Internet address of the destination network. The third field is the metric stored in the routing table and the metric advertised by the neighbor sending the information. "Metric... inaccessible" usually means that the neighbor router has put the destination in a hold down state.
The entries show that the router is sending updates that are similar, except that the numbers in parentheses are the source addresses used in the IP header. A metric of 16777215 is inaccessible.
Other examples of output that the debug ip igrp transactions command can produce follow.
The following entry indicates that the routing table was updated and shows the new edition number (97 in this case) to be used in the next IGRP update:
IGRP: edition is now 97Entries such as the following occur on startup or when some event occurs such as an interface making a transition or a user manually clearing the routing table:
IGRP: broadcasting request on Ethernet0IGRP: broadcasting request on Ethernet1The following type of entry can result when routing updates become corrupted between sending and receiving routers:
IGRP: bad checksum from 172.69.64.43An entry such as the following should never appear. If it does, the receiving router has a bug in the software or a problem with the hardware. In either case, contact your technical support representative.
IGRP: system 45 from 172.69.64.234, should be system 109debug ip inspect
To display messages about Context-Based Access Control (CBAC) events, use the debug ip inspect privileged EXEC command. The no form of this command disables debugging output.
debug ip inspect {function-trace | object-creation | object-deletion | events | timers | protocol | detailed}
no debug ip inspect detailed
Syntax Description
Command History
11.2P
This command was introduced.
12.0(5)T
NetShow support was introduced.
12.0(7)T
H.323 V2 and RTSP protocol support was introduced
Examples
The following is sample output from the debug ip inspect function-trace command:
*Mar 2 01:16:16: CBAC FUNC: insp_inspection*Mar 2 01:16:16: CBAC FUNC: insp_pre_process_sync*Mar 2 01:16:16: CBAC FUNC: insp_find_tcp_host_entry addr 40.0.0.1 bucket 41*Mar 2 01:16:16: CBAC FUNC: insp_find_pregen_session*Mar 2 01:16:16: CBAC FUNC: insp_get_idbsb*Mar 2 01:16:16: CBAC FUNC: insp_get_idbsb*Mar 2 01:16:16: CBAC FUNC: insp_get_irc_of_idb*Mar 2 01:16:16: CBAC FUNC: insp_get_idbsb*Mar 2 01:16:16: CBAC FUNC: insp_create_sis*Mar 2 01:16:16: CBAC FUNC: insp_inc_halfopen_sis*Mar 2 01:16:16: CBAC FUNC: insp_link_session_to_hash_table*Mar 2 01:16:16: CBAC FUNC: insp_inspect_pak*Mar 2 01:16:16: CBAC FUNC: insp_l4_inspection*Mar 2 01:16:16: CBAC FUNC: insp_process_tcp_seg*Mar 2 01:16:16: CBAC FUNC: insp_listen_state*Mar 2 01:16:16: CBAC FUNC: insp_ensure_return_traffic*Mar 2 01:16:16: CBAC FUNC: insp_add_acl_item*Mar 2 01:16:16: CBAC FUNC: insp_ensure_return_traffic*Mar 2 01:16:16: CBAC FUNC: insp_add_acl_item*Mar 2 01:16:16: CBAC FUNC: insp_process_syn_packet*Mar 2 01:16:16: CBAC FUNC: insp_find_tcp_host_entry addr 40.0.0.1 bucket 41*Mar 2 01:16:16: CBAC FUNC: insp_create_tcp_host_entry*Mar 2 01:16:16: CBAC* FUNC: insp_fast_inspection*Mar 2 01:16:16: CBAC* FUNC: insp_inspect_pak*Mar 2 01:16:16: CBAC* FUNC: insp_l4_inspection*Mar 2 01:16:16: CBAC* FUNC: insp_process_tcp_seg*Mar 2 01:16:16: CBAC* FUNC: insp_synrcvd_state*Mar 2 01:16:16: CBAC* FUNC: insp_fast_inspection*Mar 2 01:16:16: CBAC* FUNC: insp_inspect_pak*Mar 2 01:16:16: CBAC* FUNC: insp_l4_inspection*Mar 2 01:16:16: CBAC* FUNC: insp_process_tcp_seg*Mar 2 01:16:16: CBAC* FUNC: insp_synrcvd_state*Mar 2 01:16:16: CBAC FUNC: insp_dec_halfopen_sis*Mar 2 01:16:16: CBAC FUNC: insp_remove_sis_from_host_entry*Mar 2 01:16:16: CBAC FUNC: insp_find_tcp_host_entry addr 40.0.0.1 bucket 41This output shows the functions called by CBAC as a session is inspected. Entries with an asterisk (*) after the word "CBAC" are entries when the fast path is used; otherwise, the process path is used.
The following is sample output from the debug ip inspect object-creation and debug ip inspect object-deletion command:
*Mar 2 01:18:30: CBAC OBJ_CREATE: create pre-gen sis 25A3574*Mar 2 01:18:30: CBAC OBJ_CREATE: create acl wrapper 25A36FC -- acl item 25A3634*Mar 2 01:18:30: CBAC OBJ_CREATE: create sis 25C1CC4*Mar 2 01:18:30: CBAC OBJ_DELETE: delete pre-gen sis 25A3574*Mar 2 01:18:30: CBAC OBJ_CREATE: create host entry 25A3574 addr 10.0.0.1 bucket 31*Mar 2 01:18:30: CBAC OBJ_DELETE: delete sis 25C1CC4*Mar 2 01:18:30: CBAC OBJ_DELETE: delete create acl wrapper 25A36FC -- acl item 25A3634*Mar 2 01:18:31: CBAC OBJ_DELETE: delete host entry 25A3574 addr 10.0.0.1The following is sample output from the debug ip inspect object-creation, debug ip inspect object-deletion, and debug ip inspect events commands:
*Mar 2 01:18:51: CBAC OBJ_CREATE: create pre-gen sis 25A3574*Mar 2 01:18:51: CBAC OBJ_CREATE: create acl wrapper 25A36FC -- acl item 25A3634*Mar 2 01:18:51: CBAC Src 10.1.0.1 Port [1:65535]*Mar 2 01:18:51: CBAC Dst 10.0.0.1 Port [46406:46406]*Mar 2 01:18:51: CBAC Pre-gen sis 25A3574 created: 10.1.0.1[1:65535] 30.0.0.1[46406:46406]*Mar 2 01:18:51: CBAC OBJ_CREATE: create sis 25C1CC4*Mar 2 01:18:51: CBAC sis 25C1CC4 initiator_addr (10.1.0.1:20) responder_addr (30.0.0.1:46406) initiator_alt_addr (40.0.0.1:20) responder_alt_addr (10.0.0.1:46406)*Mar 2 01:18:51: CBAC OBJ_DELETE: delete pre-gen sis 25A3574*Mar 2 01:18:51: CBAC OBJ_CREATE: create host entry 25A3574 addr 10.0.0.1 bucket 31*Mar 2 01:18:51: CBAC OBJ_DELETE: delete sis 25C1CC4*Mar 2 01:18:51: CBAC OBJ_DELETE: delete create acl wrapper 25A36FC -- acl item 25A3634*Mar 2 01:18:51: CBAC OBJ_DELETE: delete host entry 25A3574 addr 10.0.0.1The following is sample output from the debug ip inspect timers command:
*Mar 2 01:19:15: CBAC Timer Init Leaf: Pre-gen sis 25A3574*Mar 2 01:19:15: CBAC Timer Start: Pre-gen sis 25A3574 Timer: 25A35D8 Time: 30000 milisecs*Mar 2 01:19:15: CBAC Timer Init Leaf: sis 25C1CC4*Mar 2 01:19:15: CBAC Timer Stop: Pre-gen sis 25A3574 Timer: 25A35D8*Mar 2 01:19:15: CBAC Timer Start: sis 25C1CC4 Timer: 25C1D5C Time: 30000 milisecs*Mar 2 01:19:15: CBAC Timer Start: sis 25C1CC4 Timer: 25C1D5C Time: 3600000 milisecs*Mar 2 01:19:15: CBAC Timer Start: sis 25C1CC4 Timer: 25C1D5C Time: 5000 milisecs*Mar 2 01:19:15: CBAC Timer Stop: sis 25C1CC4 Timer: 25C1D5CThe following is sample output from the debug ip inspect tcp command:
*Mar  2 01:20:43: CBAC* sis 25A3604 pak 2541C58 TCP P ack 4223720032 seq 4200176225(22)
(10.0.0.1:46409) => (10.1.0.1:21)
*Mar 2 01:20:43: CBAC* sis 25A3604 ftp L7 inspect result: PROCESS-SWITCH packet*Mar 2 01:20:43: CBAC sis 25A3604 pak 2541C58 TCP P ack 4223720032 seq 4200176225(22) (10.0.0.1:46409) => (10.1.0.1:21)*Mar 2 01:20:43: CBAC sis 25A3604 ftp L7 inspect result: PASS packet*Mar 2 01:20:43: CBAC* sis 25A3604 pak 2544374 TCP P ack 4200176247 seq 4223720032(30) (10.0.0. 1:46409) <= (10.1.0.1:21)*Mar 2 01:20:43: CBAC* sis 25A3604 ftp L7 inspect result: PASS packet*Mar 2 01:20:43: CBAC* sis 25A3604 pak 25412F8 TCP P ack 4223720062 seq 4200176247(15) (10.0.0. 1:46409) => (10.1.0.1:21)*Mar 2 01:20:43: CBAC* sis 25A3604 ftp L7 inspect result: PASS packet*Mar 2 01:20:43: CBAC sis 25C1CC4 pak 2544734 TCP S seq 4226992037(0) (10.1.0.1:20) => (10.0.0.1:46411)*Mar 2 01:20:43: CBAC* sis 25C1CC4 pak 2541E38 TCP S ack 4226992038 seq 4203405054(0) (10.1.0.1:20) <= (10.0.0.1:46411)This sample shows TCP packets being processed, and lists the corresponding acknowledge (ACK) packet numbers and sequence (SEQ) numbers. The number of data bytes in the TCP packet is shown in parentheses—for example, (22). For each packet shown, the addresses and port numbers are shown separated by a colon. For example, (10.1.0.1:21) indicates an IP address of 10.1.0.1 and a TCP port number of 21.
Entries with an asterisk (*) after the word "CBAC" are entries when the fast path is used; otherwise, the process path is used.
The following is sample output from the debug ip inspect tcp and debug ip inspect detailed commands:
*Mar 2 01:20:58: CBAC* Pak 2541E38 Find session for (30.0.0.1:46409) (40.0.0.1:21) tcp*Mar 2 01:20:58: P ack 4223720160 seq 4200176262(22)*Mar 2 01:20:58: CBAC* Pak 2541E38 Addr:port pairs to match: (30.0.0.1:46409) (40.0.0.1:21)*Mar 2 01:20:58: CBAC* sis 25A3604 SIS_OPEN*Mar 2 01:20:58: CBAC* Pak 2541E38 IP: s=30.0.0.1 (Ethernet0), d=40.0.0.1 (Ethernet1), len 76,proto=6*Mar 2 01:20:58: CBAC sis 25A3604 Saving State: SIS_OPEN/ESTAB iisn 4200176160 i_rcvnxt 4223720160 i_sndnxt 4200176262 i_rcvwnd 8760 risn 4223719771 r_rcvnxt 4200176262 r_sndnxt 4223720160 r_rcvwnd 8760*Mar 2 01:20:58: CBAC* sis 25A3604 pak 2541E38 TCP P ack 4223720160 seq 4200176262(22) (30.0.0.1:46409) => (40.0.0.1:21)*Mar 2 01:20:58: CBAC* sis 25A3604 pak 2541E38 SIS_OPEN/ESTAB TCP seq 4200176262(22) Flags: ACK 4223720160 PSH*Mar 2 01:20:58: CBAC* sis 25A3604 pak 2541E38 --> SIS_OPEN/ESTAB iisn 4200176160 i_rcvnxt 4223720160 i_sndnxt 4200176284 i_rcvwnd 8760 risn 4223719771 r_rcvnxt 4200176262 r_sndnxt 4223720160 r_rcvwnd 8760*Mar 2 01:20:58: CBAC* sis 25A3604 L4 inspect result: PASS packet 2541E38 (30.0.0.1:46409) (40.0.0.1:21) bytes 22 ftp*Mar 2 01:20:58: CBAC sis 25A3604 Restoring State: SIS_OPEN/ESTAB iisn 4200176160 i_rcvnxt 4223720160 i_sndnxt 4200176262 i_rcvwnd 8760 risn 4223719771 r_rcvnxt 4200176262 r_sndnxt 4223720160 r_rcvwnd 8760*Mar 2 01:20:58: CBAC* sis 25A3604 ftp L7 inspect result: PROCESS-SWITCH packet*Mar 2 01:20:58: CBAC* sis 25A3604 ftp L7 inspect result: PROCESS-SWITCH packet*Mar 2 01:20:58: CBAC* Bump up: inspection requires the packet in the process path(30.0.0.1) (40.0.0.1)*Mar 2 01:20:58: CBAC Pak 2541E38 Find session for (30.0.0.1:46409) (40.0.0.1:21) tcp*Mar 2 01:20:58: P ack 4223720160 seq 4200176262(22)*Mar 2 01:20:58: CBAC Pak 2541E38 Addr:port pairs to match: (30.0.0.1:46409) (40.0.0.1:21)*Mar 2 01:20:58: CBAC sis 25A3604 SIS_OPEN*Mar 2 01:20:58: CBAC Pak 2541E38 IP: s=30.0.0.1 (Ethernet0), d=40.0.0.1 (Ethernet1), len 76, proto=6debug ip mbgp dampening
To log route flap dampening activity related to multiprotocol Border Gateway Protocol (BGP), use the debug ip mbgp dampening privileged EXEC command. To disable debugging output, use the no form of this command.
debug ip mbgp dampening [access-list-number]
no debug ip mbgp dampening [access-list-number]
Syntax Description
access-list-number
(Optional) The number of an access list in the range from 1 to 99. If an access list number is specified, debugging occurs only for the routes permitted by the access list.
Defaults
Logging for route flap dampening activity is not enabled.
Command History
Examples
The following example shows sample debug ip mbgp dampening output:
Router# debug ip mbgp dampeningBGP: charge penalty for 173.19.0.0/16 path 49 with halflife-time 15 reuse/suppress 750/2000BGP: flapped 1 times since 00:00:00. New penalty is 1000BGP: charge penalty for 173.19.0.0/16 path 19 49 with halflife-time 15 reuse/suppress 750/2000BGP: flapped 1 times since 00:00:00. New penalty is 1000debug ip mbgp updates
To log multiprotocol Border Gateway Protocol (BGP)-related information passed in BGP update messages, use the debug ip mbgp updates privileged EXEC command. To disable debugging output, use the no form of this command.
debug ip mbgp updates
no debug ip mbgp updates
Syntax Description
This command has no arguments or keywords.
Defaults
Logging for multiprotocol BGP-related information in BGP update messages is not enabled.
Command History
Examples
The following example shows sample debug ip mbgp updates output:
Router# debug ip mbgp updatesBGP: NEXT_HOP part 1 net 200.10.200.0/24, neigh 171.69.233.49, next 171.69.233.34BGP: 171.69.233.49 send UPDATE 200.10.200.0/24, next 171.69.233.34, metric 0, path 33 34 19 49 109 65000 297 3561 6503BGP: NEXT_HOP part 1 net 200.10.202.0/24, neigh 171.69.233.49, next 171.69.233.34BGP: 171.69.233.49 send UPDATE 200.10.202.0/24, next 171.69.233.34, metric 0, path 33 34 19 49 109 65000 297 1239 1800 3597BGP: NEXT_HOP part 1 net 200.10.228.0/22, neigh 171.69.233.49, next 171.69.233.34BGP: 171.69.233.49 rcv UPDATE about 222.2.2.0/24, next hop 171.69.233.49, path 49 109 metric 0BGP: 171.69.233.49 rcv UPDATE about 131.103.0.0/16, next hop 171.69.233.49, path 49 109 metric 0BGP: 171.69.233.49 rcv UPDATE about 206.205.242.0/24, next hop 171.69.233.49, path 49 109 metric 0BGP: 171.69.233.49 rcv UPDATE about 1.0.0.0/8, next hop 171.69.233.49, path 49 19 metric 0BGP: 171.69.233.49 rcv UPDATE about 198.1.2.0/24, next hop 171.69.233.49, path 49 19 metric 0BGP: 171.69.233.49 rcv UPDATE about 171.69.0.0/16, next hop 171.69.233.49, path 49 metric 0BGP: 171.69.233.49 rcv UPDATE about 172.19.0.0/16, next hop 171.69.233.49, path 49 metric 0BGP: nettable_walker 172.19.0.0/255.255.0.0 calling revise_routeBGP: revise route installing 172.19.0.0/255.255.0.0 -> 171.69.233.49BGP: 171.69.233.19 computing updates, neighbor version 267099, table version 267100, starting at 0.0.0.0BGP: NEXT_HOP part 1 net 172.19.0.0/16, neigh 171.69.233.19, next 171.69.233.49BGP: 171.69.233.19 send UPDATE 172.19.0.0/16, next 171.69.233.49, metric 0, path 33 49BGP: 1 updates (average = 46, maximum = 46)BGP: 171.69.233.19 updates replicated for neighbors : 171.69.233.34, 171.69.233.49, 171.69.233.56BGP: 171.69.233.19 1 updates enqueued (average=46, maximum=46)BGP: 171.69.233.19 update run completed, ran for 0ms, neighbor version 267099, start version 267100, throttled to 267100, check point net 0.0.0.0debug ip mcache
To display IP multicast fast-switching events, use the debug ip mcache command. The no form of this command disables debugging output.
debug ip mcache [name | address]
no debug ip mcache [name | address]
Syntax Description
Usage Guidelines
Use this command when multicast fast switching appears not to be functioning.
Examples
The following is sample output from the debug ip mcache command when an IP multicast route is cleared:
Router# debug ip mcacheIP multicast fast-switching debugging is onRouter# clear ip mroute *MRC: Build MAC header for (172.31.60.185/32, 224.2.231.173), Ethernet0MRC: Fast-switch flag for (172.31.60.185/32, 224.2.231.173), off -> on, caller ip_mroute_replicate-1MRC: Build MAC header for (172.31.191.10/32, 224.2.127.255), Ethernet0MRC: Build MAC header for (172.31.60.152/32, 224.2.231.173), Ethernet0Table 81 explains the significant fields in the display.
Related Commands
debug ip mds ipc
To debug MDS interprocessor communication, that is, synchronization between the MFIB on the line card and the multicast routing table in the RP, use the debug ip mds ipc privileged EXEC command. The no form of this command disables debugging output.
debug ip mds ipc {event | packet}
no debug ip mds ipc {event | packet}
Syntax Description
Usage Guidelines
Use this command on the line card or RP.
Examples
The following is sample output from the debug ip mds ipc packet command:
Router# debug ip mds ipc packetMDFS ipc packet debugging is onRouter#MDFS: LC sending statistics message to RP with code 0 of size 36MDFS: LC sending statistics message to RP with code 1 of size 680MDFS: LC sending statistics message to RP with code 2 of size 200MDFS: LC sending statistics message to RP with code 3 of size 152MDFS: LC sending window message to RP with code 36261 of size 8MDFS: LC received IPC packet of size 60 sequence 36212The following is sample output from the debug ip mds ipc event command:
Router# debug ip mds ipc eventMDFS: LC received invalid sequence 21 while expecting 20debug ip mds mevent
To debug MFIB route creation, route updates, and so on, use the debug ip mds mevent privileged EXEC command. The no form of this command disables debugging output.
debug ip mds mevent
no debug ip mds mevent
Syntax Description
This command has no arguments or keywords.
Usage Guidelines
Use this command on the line card.
Examples
The following is sample output from the debug ip mds mevent command:
Router# debug ip mds meventMDFS mroute event debugging is onRouter#clear ip mdfs for *Router#MDFS: Create (*, 239.255.255.255)MDFS: Create (192.168.1.1/32, 239.255.255.255), RPF POS2/0/0MDFS: Add OIF for mroute (192.168.1.1/239.255.255.255) on Fddi0/0/0MDFS: Create (*, 224.2.127.254)MDFS: Create (192.168.1.1/32, 224.2.127.254), RPF POS2/0/0MDFS: Add OIF for mroute (192.168.1.1/224.2.127.254) on Fddi0/0/0MDFS: Create (128.9.160.67/32, 224.2.127.254), RPF POS2/0/0debug ip mds mpacket
To debug multicast distributed switching (MDS) events such as packet drops, interface drops, and switching failures, use the debug ip mds mpacket privileged EXEC command. The no form of this command disables debugging output.
debug ip mds mpacket
no debug ip mds mpacket
Syntax Description
This command has no arguments or keywords.
Usage Guidelines
Use this command on the line card.
Examples
The following is sample output from the debug ip mds mpacket command:
Router# debug ip mds mpacketdebug ip mds process
To debug line card process level events, use the debug ip mds process privileged EXEC command. The no form of this command disables debugging output.
debug ip mds process
no debug ip mds process
Usage Guidelines
Use this command on the line card or RP.
Examples
The following is sample output from the debug ip mds process command:
Router# debug ip mds processMDFS process debugging is onMar 19 16:15:47.448: MDFS: RP queueing mdb message for (210.115.194.5, 224.2.127.254) to all linecardsMar 19 16:15:47.448: MDFS: RP queueing midb message for (210.115.194.5, 224.2.127.254) to all linecardsMar 19 16:15:47.628: MDFS: RP servicing low queue for LC in slot 0Mar 19 16:15:47.628: MDFS: RP servicing low queue for LC in slot 2Mar 19 16:15:48.229: MDFS: RP queueing mdb message for (171.68.224.10, 224.2.127.254) to all linecardsMar 19 16:15:48.229: MDFS: RP queueing mdb message for (171.68.224.10, 224.2.127.254) to all linecardsMar 19 16:15:48.229: MDFS: RP queueing mdb message for (171.69.67.106, 224.2.127.254) to all linecardsMar 19 16:15:48.229: MDFS: RP queueing mdb message for (171.69.67.106, 224.2.127.254) to all linecardsMar 19 16:15:48.229: MDFS: RP queueing mdb message for (206.14.154.181, 224.2.127.254) to all linecardsMar 19 16:15:48.229: MDFS: RP queueing mdb message for (206.14.154.181, 224.2.127.254) to all linecardsMar 19 16:15:48.233: MDFS: RP queueing mdb message for (210.115.194.5, 224.2.127.254) to all linecardsdebug ip mhbeat
To monitor the action of the heartbeat trap, use the debug ip mhbeat privileged EXEC command. To disable debugging output, use the no form of this command.
debug ip mhbeat
no debug ip mhbeat
Syntax Description
This command has no keywords or arguments.
Defaults
Debugging is not enabled.
Command History
Examples
The following is output from the debug ip mhbeat command.
Router# debug ip mhbeatIP multicast heartbeat debugging is onRouter# debug snmp packetsSNMP packet debugging is on!Router(config)# ip multicast heartbeat intervals-of 10Dec 23 13:34:21.132: MHBEAT: ip multicast-heartbeat group 224.0.1.53 port 0source 0.0.0.0 0.0.0.0 at-least 3 in 5 intervals-of 10 secondsdRouter#Dec 23 13:34:23: %SYS-5-CONFIG_I: Configured from console by consoleDec 23 13:34:31.136: MHBEAT: timer ticked, t=1,i=1,c=0Dec 23 13:34:41.136: MHBEAT: timer ticked, t=2,i=2,c=0Dec 23 13:34:51.136: MHBEAT: timer ticked, t=3,i=3,c=0Dec 23 13:35:01.136: MHBEAT: timer ticked, t=4,i=4,c=0Dec 23 13:35:11.136: MHBEAT: timer ticked, t=5,i=0,c=0Dec 23 13:35:21.135: Send SNMP Trap for missing heartbeatDec 23 13:35:21.135: SNMP: Queuing packet to 171.69.55.12Dec 23 13:35:21.135: SNMP: V1 Trap, ent ciscoExperiment.2.3.1, addr 4.4.4.4, gentrap 6, spectrap 1ciscoIpMRouteHeartBeat.1.0 = 224.0.1.53ciscoIpMRouteHeartBeat.2.0 = 0.0.0.0ciscoIpMRouteHeartBeat.3.0 = 10ciscoIpMRouteHeartBeat.4.0 = 5ciscoIpMRouteHeartBeat.5.0 = 0ciscoIpMRouteHeartBeat.6.0 = 3Related Commands
ip multicast heartbeat
Monitors the health of multicast delivery, and alerts when the delivery fails to meet certain parameters.
debug ip mobile
To display IP mobility activities, use the debug ip mobile command.
debug ip mobile [advertise | host [access-list-number] | local-area | standby]
Syntax Description
Command History
Usage Guidelines
Use the debug ip mobile standby command to troubleshoot redundancy problems.
Examples
The following is sample output from the debug ip mobile standby command. In this example, the active HA receives a registration request from mobile node (MN) 20.0.0.2 and sends a binding update to peer HA 1.0.0.2:
MobileIP:MN 20.0.0.2 - sent BindUpd to HA 1.0.0.2 HAA 20.0.0.1MobileIP:HA standby maint started - cnt 1MobileIP:MN 20.0.0.2 - sent BindUpd id 3780410816 cnt 0 elapsed 0adjust -0 to HA 1.0.0.2 in grp 1.0.0.10 HAA 20.0.0.1In this example, the standby HA receives a binding update for MN 20.0.0.2 sent by the active HA:
MobileIP:MN 20.0.0.2 - HA rcv BindUpd from 1.0.0.3 HAA 20.0.0.1debug ip mobile advertise
To display advertisement information, use the debug ip mobile advertise privileged EXEC command.
debug ip mobile advertise
Syntax Description
This command has no arguments or keywords.
Command History
Examples
The following is sample output from the debug ip mobile advertise command:
Router# debug ip mobile advertiseMobileIP: Agent advertisement sent out Ethernet1/2: type=16, len=10, seq=1, lifetime=36000,flags=0x1400(rbhFmGv-rsv-),Care-of address: 68.0.0.31Prefix Length ext: len=1 (8 )Table 82 describes the significant fields shown in the display.
debug ip mobile host
To display IP mobility events, use the debug ip mobile host privileged EXEC command.
debug ip mobile host acl
Syntax Description
Command History
Examples
The following is sample output from the debug ip mobile host command:
Router# debug ip mobile hostMobileIP: HA received registration for MN 20.0.0.6 on interface Ethernet1 using COA68.0.0.31 HA 66.0.0.5 lifetime 30000 options sbdmgvTMobileIP: Authenticated FA 68.0.0.31 using SPI 110 (MN 20.0.0.6)MobileIP: Authenticated MN 20.0.0.6 using SPI 300MobileIP: HA accepts registration from MN 20.0.0.6MobileIP: Mobility binding for MN 20.0.0.6 updatedMobileIP: Roam timer started for MN 20.0.0.6, lifetime 30000MobileIP: MH auth ext added (SPI 300) in reply to MN 20.0.0.6MobileIP: HF auth ext added (SPI 220) in reply to MN 20.0.0.6MobileIP: HA sent reply to MN 20.0.0.6debug ip mpacket
To display IP multicast packets received and sent, use the debug ip mpacket privileged EXEC command. To disable the debugging output, use the no form of this command.
debug ip mpacket [detail | fastswitch] [access-list] [group]
no debug ip mpacket [detail | fastswitch] [access-list] [group]
Syntax Description
Defaults
The debug ip mpacket command displays all IP multicast packets switched at the process level.
Command Modes
Privileged EXEC
Command History
10.2
This command was introduced.
12.1(2)T
The fastswitch keyword was introduced.
Usage Guidelines
This command displays information for multicast IP packets that are forwarded from this router. By using the access-list or group argument, you can limit the display to multicast packets from sources described by the access list or a specific multicast group.
Use this command with the debug ip packet command to observe additional packet information.
Note
Examples
The following is sample output from the debug ip mpacket command:
Router# debug ip mpacket 224.2.0.1IP: s=10.188.34.54 (Ethernet1), d=224.2.0.1 (Tunnel0), len 88, mforwardIP: s=10.188.34.54 (Ethernet1), d=224.2.0.1 (Tunnel0), len 88, mforwardIP: s=10.188.34.54 (Ethernet1), d=224.2.0.1 (Tunnel0), len 88, mforwardIP: s=10.162.3.27 (Ethernet1), d=224.2.0.1 (Tunnel0), len 68, mforwardTable 83 describes the significant fields shown in the display.
Related Commands
debug ip mrm
To display Multicast Routing Monitor (MRM) control packet activity, use the debug ip mrm privileged EXEC command. Use the no form of the command to disable debugging output.
debug ip mrm
no debug ip mrm
Syntax Description
This command has no arguments or keywords.
Defaults
Debugging for MRM is not enabled.
Command History
Examples
The following example is sample output for the debug ip mrm command on the different devices:
On Manager
*Feb 28 16:25:44.009: MRM: Send Beacon for group 239.1.1.1, holdtime 86100 seconds*Feb 28 16:26:01.095: MRM: Receive Status Report from 10.1.4.2 on Ethernet0*Feb 28 16:26:01.099: MRM: Send Status Report Ack to 10.1.4.2 for group 239.1.1.1*Feb 28 16:26:01.103: IP MRM status report -- Test:test2 Receiver:10.1.4.2*Feb 28 16:26:01.107: Sender:10.1.1.10 Pkt Loss:4(16%) Ehsr:1380The last two lines of output on the manager are not part of the debug output; they appeared because an error report was received.
On Test-Sender
MRM: Receive Test-Sender Request/Local trigger from 1.1.1.1 on Ethernet0MRM: Send TS request Ack to 1.1.1.1 for group 239.1.2.3MRM: Send test packet src:2.2.2.2 dst:239.1.2.3 manager:1.1.1.1On Test-Receiver
MRM: Receive Test-Receiver Request/Monitor from 1.1.1.1 on Ethernet0MRM: Send TR request Ack to 1.1.1.1 for group 239.1.2.3MRM: Receive Beacon from 1.1.1.1 on Ethernet0MRM: Send Status Report to 1.1.1.1 for group 239.1.2.3MRM: Receive Status Report Ack from 1.1.1.1 on Ethernet0debug ip mrouting
To display changes to the IP multicast routing table, use the debug ip mrouting privileged EXEC command. The no form of this command disables debugging output.
debug ip mrouting [group]
no debug ip mrouting [group]
Syntax Description
Usage Guidelines
This command indicates when the router has made changes to the mroute table. Use the debug ip pim and debug ip mrouting commands concurrently to obtain additional multicast routing information. In addition, use the debug ip igmp command to see why an mroute message is being displayed.
This command generates a substantial amount of output. Use the optional group argument to limit the output to a single multicast group.
Examples
The following is sample output from the debug ip mrouting command:
Router# debug ip mrouting 224.2.0.1MRT: Delete (10.0.0.0/8, 224.2.0.1)MRT: Delete (10.4.0.0/16, 224.2.0.1)MRT: Delete (10.6.0.0/16, 224.2.0.1)MRT: Delete (10.9.0.0/16, 224.2.0.1)MRT: Delete (10.16.0.0/16, 224.2.0.1)MRT: Create (*, 224.2.0.1), if_input NULLMRT: Create (172.69.15.0/24, 225.2.2.4), if_input Ethernet0, RPF nbr 172.69.61.15MRT: Create (172.69.39.0/24, 225.2.2.4), if_input Ethernet1, RPF nbr 0.0.0.0MRT: Create (10.0.0.0/8, 224.2.0.1), if_input Ethernet1, RPF nbr 0.0.0.0MRT: Create (10.4.0.0/16, 224.2.0.1), if_input Ethernet1, RPF nbr 0.0.0.0MRT: Create (10.6.0.0/16, 224.2.0.1), if_input Ethernet1, RPF nbr 0.0.0.0MRT: Create (10.9.0.0/16, 224.2.0.1), if_input Ethernet1, RPF nbr 0.0.0.0MRT: Create (10.16.0.0/16, 224.2.0.1), if_input Ethernet1, RPF nbr 0.0.0.0The following lines show that multicast IP routes were deleted from the routing table:
MRT: Delete (10.0.0.0/8, 224.2.0.1)MRT: Delete (10.4.0.0/16, 224.2.0.1)MRT: Delete (10.6.0.0/16, 224.2.0.1)The (*, G) entry in the following line is always because since it is a (*, G). The (*, G) entries are generally created by receipt of an IGMP host report from a group member on the directly connected LAN or by a PIM join message (in sparse mode) that this router receives from a router that is sending joins toward the RP. This router will in turn send a join toward the RP that creates the shared tree (or RP tree).
MRT: Create (*, 224.2.0.1), if_input NULLThe following lines are an example of creating an (S, G) entry that show a mpacket was received on E0. The second line shows a route being created for a source that is on a directly connected LAN. The RPF means "reverse path forwarding," whereby the router looks up the source address of the multicast packet in the unicast routing table and asks which interface will be used to send a packet to that source.
MRT: Create (172.69.15.0/24, 225.2.2.4), if_input Ethernet0, RPF nbr 172.69.61.15MRT: Create (172.69.39.0/24, 225.2.2.4), if_input Ethernet1, RPF nbr 0.0.0.0The following lines show that multicast IP routes were added to the routing table. Note the 0.0.0.0 as the RPF, which means the route was created by a source that is directly connected to this router.
MRT: Create (10.9.0.0/16, 224.2.0.1), if_input Ethernet1, RPF nbr 0.0.0.0MRT: Create (10.16.0.0/16, 224.2.0.1), if_input Ethernet1, RPF nbr 0.0.0.0If the source is not directly connected, the nbr address shown in these lines will be the address of the router that forwarded the packet to this router.
The shortest path tree state maintained in routers consists of source (S), multicast address (G), outgoing interface (OIF), and incoming interface (IIF). The forwarding information is referred to as the multicast forwarding entry for (S,G).
An entry for a shared tree can match packets from any source for its associated group if the packets come through the proper incoming interface as determined by the RPF lookup. Such an entry is denoted as (*,G). A (*,G) entry keeps the same information a (S,G) entry keeps, except that it saves the rendezvous point (RP) address in place of the source address in sparse mode or 0.0.0.0 in dense mode.
Related Commands
debug ip msdp
To debug MSDP activity, use the debug ip msdp privileged EXEC command.
debug ip msdp [peer-address | name] [detail] [routes]
Syntax Description
peer-address | name
(Optional) Logs debug events for that peer only.
detail
(Optional) Provides more detailed debugging information.
routes
(Optional) Displays the contents of Source-Active messages.
Command History
Examples
The following is sample output of the debug ip msdp command:
Router# debug ip msdpMSDP debugging is onRouter#MSDP: 192.150.44.254: Received 1388-byte message from peerMSDP: 192.150.44.254: SA TLV, len: 1388, ec: 115, RP: 137.39.3.92MSDP: 192.150.44.254: Peer RPF check passed for 137.39.3.92, used EMBGP peerMSDP: 192.150.44.250: Forward 1388-byte SA to peerMSDP: 192.150.44.254: Received 1028-byte message from peerMSDP: 192.150.44.254: SA TLV, len: 1028, ec: 85, RP: 137.39.3.92MSDP: 192.150.44.254: Peer RPF check passed for 137.39.3.92, used EMBGP peerMSDP: 192.150.44.250: Forward 1028-byte SA to peerMSDP: 192.150.44.254: Received 1388-byte message from peerMSDP: 192.150.44.254: SA TLV, len: 1388, ec: 115, RP: 137.39.3.111MSDP: 192.150.44.254: Peer RPF check passed for 137.39.3.111, used EMBGP peerMSDP: 192.150.44.250: Forward 1388-byte SA to peerMSDP: 192.150.44.250: Received 56-byte message from peerMSDP: 192.150.44.250: SA TLV, len: 56, ec: 4, RP: 205.167.76.241MSDP: 192.150.44.250: Peer RPF check passed for 205.167.76.241, used EMBGP peerMSDP: 192.150.44.254: Forward 56-byte SA to peerMSDP: 192.150.44.254: Received 116-byte message from peerMSDP: 192.150.44.254: SA TLV, len: 116, ec: 9, RP: 137.39.3.111MSDP: 192.150.44.254: Peer RPF check passed for 137.39.3.111, used EMBGP peerMSDP: 192.150.44.250: Forward 116-byte SA to peerMSDP: 192.150.44.254: Received 32-byte message from peerMSDP: 192.150.44.254: SA TLV, len: 32, ec: 2, RP: 137.39.3.78MSDP: 192.150.44.254: Peer RPF check passed for 137.39.3.78, used EMBGP peerMSDP: 192.150.44.250: Forward 32-byte SA to peerTable 84 describes the significant fields shown in the display.
Table 84 debug ip msdp Field Descriptions
MSDP
Protocol being debugged.
192.150.44.254:
IP address of the MSDP peer.
Received 1388-byte message from peer
MSDP event.
debug ip msdp resets
To debug MSDP peer reset reasons, use the debug ip msdp resets privileged EXEC command.
debug ip msdp resets
Syntax Description
This command has no arguments or keywords.
Command History
debug ip nat
To display information about IP packets translated by the IP Network Address Translation (NAT) feature, use the debug ip nat privileged EXEC command. To disable debugging output, use the no form of this command.
debug ip nat [access-list | detailed | h323 | pptp]
no debug ip nat [access-list | detailed | h323 | pptp]
Syntax Description
Defaults
Disabled
Command Modes
Privileged EXEC
Command History
11.2
This command was introduced.
12.1(5)T
This command was modified to include the h323 keyword.
Usage Guidelines
The NAT feature reduces the need for unique, registered IP addresses. It can also save private network administrators from needing to renumber hosts and routers that do not conform to global IP addressing.
Use the debug ip nat command to verify the operation of the NAT feature by displaying information about every packet that is translated by the router. The debug ip nat detailed command generates a description of each packet considered for translation. This command also outputs information about certain errors or exceptional conditions, such as the failure to allocate a global address. To display messages related to the processing of H.225 signalling and H.245 messages, use the debug ip nat h323 command.
Caution
Examples
The following is sample output from the debug ip nat command. In this example, the first two lines show the debugging output produced by a Domain Name System (DNS) request and reply. The remaining lines show the debugging output from a Telnet connection from a host on the inside of the network to a host on the outside of the network. All Telnet packets, except for the first packet, were translated in the fast path, as indicated by the asterisk (*).
Router# debug ip natNAT: s=192.168.1.95->172.31.233.209, d=172.31.2.132 [6825]NAT: s=172.31.2.132, d=172.31.233.209->192.168.1.95 [21852]NAT: s=192.168.1.95->172.31.233.209, d=172.31.1.161 [6826]NAT*: s=172.31.1.161, d=172.31.233.209->192.168.1.95 [23311]NAT*: s=192.168.1.95->172.31.233.209, d=172.31.1.161 [6827]NAT*: s=192.168.1.95->172.31.233.209, d=172.31.1.161 [6828]NAT*: s=172.31.1.161, d=172.31.233.209->192.168.1.95 [23313]NAT*: s=172.31.1.161, d=172.31.233.209->192.168.1.95 [23325]Table 85 describes the significant fields shown in the display.
The following is sample output from the debug ip nat detailed command. In this example, the first two lines show the debugging output produced by a DNS request and reply. The remaining lines show the debugging output from a Telnet connection from a host on the inside of the network to a host on the outside of the network. In this example, the inside host 192.168.1.95 was assigned the global address 172.31.233.193.
Router# debug ip nat detailedNAT: i: udp (192.168.1.95, 1493) -> (172.31.2.132, 53) [22399]NAT: o: udp (172.31.2.132, 53) -> (172.31.233.193, 1493) [63671]NAT*: i: tcp (192.168.1.95, 1135) -> (172.31.2.75, 23) [22400]NAT*: o: tcp (172.31.2.75, 23) -> (172.31.233.193, 1135) [22002]NAT*: i: tcp (192.168.1.95, 1135) -> (172.31.2.75, 23) [22401]NAT*: i: tcp (192.168.1.95, 1135) -> (172.31.2.75, 23) [22402]NAT*: o: tcp (172.31.2.75, 23) -> (172.31.233.193, 1135) [22060]NAT*: o: tcp (172.31.2.75, 23) -> (172.31.233.193, 1135) [22071]Table 86 describes the significant fields shown in the display.
The following is sample output from the debug ip nat h323 command. In this example, an H.323 call is established between two hosts, one host on the inside and the other one on the outside. The debug displays the H.323 messages names that NAT recognizes and the embedded IP addresses contained in those messages.
Router# debug ip nat h323NAT:H225:[0] processing a Setup messageNAT:H225:[0] found Setup sourceCallSignallingNAT:H225:[0] fix TransportAddress addr=192.168.122.50 port=11140NAT:H225:[0] found Setup fastStartNAT:H225:[0] Setup fastStart PDU length:18NAT:H245:[0] processing OpenLogicalChannel message, forward channelnumber 1NAT:H245:[0] found OLC forward mediaControlChannelNAT:H245:[0] fix TransportAddress addr=192.168.122.50 port=16517NAT:H225:[0] Setup fastStart PDU length:29NAT:H245:[0] processing OpenLogicalChannel message, forward channelnumber 1NAT:H245:[0] found OLC reverse mediaChannelNAT:H245:[0] fix TransportAddress addr=192.168.122.50 port=16516NAT:H245:[0] found OLC reverse mediaControlChannelNAT:H245:[0] fix TransportAddress addr=192.168.122.50 port=16517NAT:H225:[1] processing an Alerting messageNAT:H225:[1] found Alerting fastStartNAT:H225:[1] Alerting fastStart PDU length:25NAT:H245:[1] processing OpenLogicalChannel message, forward channeTable 87 describes the significant fields shown in the display.
debug ip ospf events
To display information on Open Shortest Path First (OSPF)-related events, such as adjacencies, flooding information, designated router selection, and shortest path first (SPF) calculation, use the debug ip ospf events privileged EXEC command. The no form of this command disables debugging output.
debug ip ospf events
no debug ip ospf events
Syntax Description
This command has no arguments or keywords.
Examples
The following is sample output from the debug ip ospf events command:
Router# debug ip ospf eventsOSPF:hello with invalid timers on interface Ethernet0hello interval received 10 configured 10net mask received 255.255.255.0 configured 255.255.255.0dead interval received 40 configured 30The debug ip ospf events output shown might appear if any of the following situations occurs:
•
•
•
If a router configured for OSPF routing is not seeing an OSPF neighbor on an attached network, perform the following tasks:
•
•
In the following example line, the neighbor and this router are not part of a stub area (that is, one is a part of a transit area and the other is a part of a stub area, as explained in RFC 1247):
OSPF: hello packet with mismatched E bitRelated Commands
debug ip ospf mpls traffic-eng advertisements
To print information about traffic engineering advertisements in OSPF link state advertisement (LSA) messages, use the debug ip ospf mpls traffic-eng advertisements privileged EXEC command. To disable debugging output, use the no form of this command.
debug ip ospf mpls traffic-eng advertisements
no debug ip ospf mpls traffic-eng advertisements
Syntax Description
This command has no arguments or keywords
Defaults
No default behavior or values.
Command Modes
Privileged EXEC
Command History
Examples
In the following example, information about traffic engineering advertisements is printed in OSPF LSA messages:
debug ip ospf mpls traffic-eng advertisementsOSPF:IGP delete router node 10.106.0.6 fragment 0 with 0 linksTE Router ID 10.106.0.6OSPF:IGP update router node 10.110.0.10 fragment 0 with 0 linksTE Router ID 10.110.0.10OSPF:MPLS announce router node 10.106.0.6 fragment 0 with 1 linksLink connected to Point-to-Point networkLink ID :10.110.0.10Interface Address :10.1.0.6Neighbor Address :10.1.0.10Admin Metric :10Maximum bandwidth :1250000Maximum reservable bandwidth :625000Number of Priority :8Priority 0 :625000 Priority 1 :625000Priority 2 :625000 Priority 3 :625000Priority 4 :625000 Priority 5 :625000Priority 6 :625000 Priority 7 :625000Affinity Bit :0x0Table 88 describes the significant fields shown in the display.
debug ip ospf packet
To display information about each Open Shortest Path First (OSPF) packet received, use the debug ip ospf packet privileged EXEC command. The no form of this command disables debugging output.
debug ip ospf packet
no debug ip ospf packet
Syntax Description
This command has no arguments or keywords.
Examples
The following is sample output from the debug ip ospf packet command:
Router# debug ip ospf packetOSPF: rcv. v:2 t:1 l:48 rid:200.0.0.117aid:0.0.0.0 chk:6AB2 aut:0 auk:The debug ip ospf packet command produces one set of information for each packet received. The output varies slightly depending on which authentication is used. The following is sample output from the debug ip ospf packet command when MD5 authentication is used.
Router# debug ip ospf packetOSPF: rcv. v:2 t:1 l:48 rid:200.0.0.116aid:0.0.0.0 chk:0 aut:2 keyid:1 seq:0x0Table 89 describes the fields shown in the display.
Related Commands
Displays information on OSPF-related events, such as adjacencies, flooding information, designated router selection, and SPF calculation.
debug ip ospf spf statistic
To display statistical information while running the shortest path first algorithm (SPF), use the debug ip ospf spf statistic command in privileged EXEC mode. To disable the debugging output, use the no form of this command.
debug ip ospf spf statistic
no debug ip ospf spf statistic
Syntax Description
This command has no arguments or keywords.
Command History
Usage Guidelines
The debug ip ospf spf statistic command displays the SPF calculation times in milliseconds, the node count, and a time stamp.
Examples
The following is sample output from the debug ip ospf spf statistic command:
Router# debug ip ospf spf statistic00:05:59: OSPF: Begin SPF at 359.216ms, process time 60ms00:05:59: spf_time 00:05:59.216, wait_interval 0s00:05:59: OSPF: End SPF at 359.216ms, Total elapsed time 0ms00:05:59: Intra: 0ms, Inter: 0ms, External: 0ms00:05:59: R: 4, N: 2, Stubs: 100:05:59: SN: 1, SA: 0, X5: 1, X7: 000:05:59: SPF suspends: 0 intra, 1 totalTable 90 describes the fields shown in the display.
debug ip packet
To display general IP debugging information and IP security option (IPSO) security transactions, use the debug ip packet command in privileged EXEC mode. To disable debugging output, use the no form of this command.
debug ip packet [access-list-number] [detail] [dump]
no debug ip packet [access-list-number]
Syntax Description
Command Modes
Privileged EXEC
Usage Guidelines
If a communication session is closing when it should not be, an end-to-end connection problem can be the cause. The debug ip packet command is useful for analyzing the messages traveling between the local and remote hosts. IP packet debugging captures the packets that are process switched including received, generated and forwarded packets. IP packets that are switched in the fast path are not captured.
IPSO security transactions include messages that describe the cause of failure each time a datagram fails a security test in the system. This information is also sent to the sending host when the router configuration allows it.
Caution
Caution
Examples
The following is sample output from the debug ip packet command:
debug ip packetIP packet debugging is onIP: s=172.69.13.44 (Fddi0), d=10.125.254.1 (Serial2), g=172.69.16.2, forwardIP: s=172.69.1.57 (Ethernet4), d=10.36.125.2 (Serial2), g=172.69.16.2, forwardIP: s=172.69.1.6 (Ethernet4), d=255.255.255.255, rcvd 2IP: s=172.69.1.55 (Ethernet4), d=172.69.2.42 (Fddi0), g=172.69.13.6, forwardIP: s=172.69.89.33 (Ethernet2), d=10.130.2.156 (Serial2), g=172.69.16.2, forwardIP: s=172.69.1.27 (Ethernet4), d=172.69.43.126 (Fddi1), g=172.69.23.5, forwardIP: s=172.69.1.27 (Ethernet4), d=172.69.43.126 (Fddi0), g=172.69.13.6, forwardIP: s=172.69.20.32 (Ethernet2), d=255.255.255.255, rcvd 2IP: s=172.69.1.57 (Ethernet4), d=10.36.125.2 (Serial2), g=172.69.16.2, access deniedThe output shows two types of messages that the debug ip packet command can produce; the first line of output describes an IP packet that the router forwards, and the third line of output describes a packet that is destined for the router. In the third line of output, rcvd 2 indicates that the router decided to receive the packet.
Table 91 describes the significant fields shown in the output.
The following is sample output from the debug ip packet command enabled with the detail keyword:
debug ip packet detailIP packet debugging is on (detailed)001556: 19:59:30: CEF: Try to CEF switch 10.4.9.151 from FastEthernet0/0001557: 19:59:30: IP: s=10.4.9.6 (FastEthernet0/0), d=10.4.9.151 (FastEthernet03001558: 19:59:30: TCP src=179, dst=11001, seq=3736598846, ack=2885081910, wH001559: 20:00:09: CEF: Try to CEF switch 10.4.9.151 from FastEthernet0/0001560: 20:00:09: IP: s=10.4.9.4 (FastEthernet0/0), d=10.4.9.151 (FastEthernet03001561: 20:00:09: TCP src=179, dst=11000, seq=163035693, ack=2948141027, wiH001562: 20:00:14: CEF: Try to CEF switch 10.4.9.151 from FastEthernet0/0001563: 20:00:14: IP: s=10.4.9.6 (FastEthernet0/0), d=10.4.9.151 (FastEthernet03001564: 20:00:14: ICMP type=8, code=0001565: 20:00:14: IP: s=10.4.9.151 (local), d=10.4.9.6 (FastEthernet0/0), len 1g001566: 20:00:14: ICMP type=0, code=0The format of the output with detail keyword provides additional information, such as the packet type, code, some field values, and source and destination port numbers.
Table 92 describes the significant fields shown in the output.
The following is sample output from the debug ip packet command enabled with the dump keyword:
debug ip packet dumpIP packet debugging is on (detailed) (dump)21:02:42: IP: s=10.4.9.6 (FastEthernet0/0), d=10.4.9.4 (FastEthernet0/0), len 1307003A00: 0005 00509C08 ...P..07003A10: 0007855B 4DC00800 45000064 001E0000 ...[M@..E..d....07003A20: FE019669 0A040906 0A040904 0800CF7C ~..i..........O|07003A30: 0D052678 00000000 0A0B7145 ABCDABCD ..&x......qE+M+M07003A40: ABCDABCD ABCDABCD ABCDABCD ABCDABCD +M+M+M+M+M+M+M+M07003A50: ABCDABCD ABCDABCD ABCDABCD ABCDABCD +M+M+M+M+M+M+M+M07003A60: ABCDABCD ABCDABCD ABCDABCD ABCDABCD +M+M+M+M+M+M+M+M07003A70: ABCDABCD ABCDABCD ABCDABCD +M+M+M+M+M+M21:02:42: IP: s=10.4.9.4 (local), d=10.4.9.6 (FastEthernet0/0), len 100, sending07003A00: 0005 00509C08 ...P..07003A10: 0007855B 4DC00800 45000064 001E0000 ...[M@..E..d....07003A20: FF019569 0A040904 0A040906 0000D77C ...i..........W|07003A30: 0D052678 00000000 0A0B7145 ABCDABCD ..&x......qE+M+M07003A40: ABCDABCD ABCDABCD ABCDABCD ABCDABCD +M+M+M+M+M+M+M+M07003A50: ABCDABCD ABCDABCD ABCDABCD ABCDABCD +M+M+M+M+M+M+M+M07003A60: ABCDABCD ABCDABCD ABCDABCD ABCDABCD +M+M+M+M+M+M+M+M07003A70: ABCDABCD ABCDABCD ABCDABCD +M+M+M+M+M+M21:02:42: CEF: Try to CEF switch 10.4.9.4 from FastEthernet0/021:02:42: IP: s=10.4.9.6 (FastEthernet0/0), d=10.4.9.4 (FastEthernet0/0), len 1307003380: 0005 00509C08 ...P..07003390: 0007855B 4DC00800 45000064 001F0000 ...[M@..E..d....070033A0: FE019668 0A040906 0A040904 0800CF77 ~..h..........Ow070033B0: 0D062678 00000000 0A0B7149 ABCDABCD ..&x......qI+M+M070033C0: ABCDABCD ABCDABCD ABCDABCD ABCDABCD +M+M+M+M+M+M+M+M070033D0: ABCDABCD ABCDABCD ABCDABCD ABCDABCD +M+M+M+M+M+M+M+M070033E0: ABCDABCD ABCDABCD ABCDABCD ABCDABCD +M+M+M+M+M+M+M+M070033F0: ABCDABCD ABCDABCD ABCDABCD +M+M+M+M+M+M
Note
The output from the debug ip packet command, when the dump keyword is enabled, provides raw packet data in hexadecimal and ASCII forms. This addtional output is displayed in addition to the standard output. The dump keyword can be used with all of the available configuration options of this command.
Table 93 describes the standard output fields shown.
The calculation on whether to send a security error message can be somewhat confusing. It depends upon both the security label in the datagram and the label of the incoming interface. First, the label contained in the datagram is examined for anything obviously wrong. If nothing is wrong, assume the datagram to be correct. If something is wrong, the datagram is treated as unclassified genser. Then the label is compared with the interface range, and the appropriate action is taken, as Table 94 describes.
The security code can only generate a few types of Internet Control Message Protocol (ICMP) error messages. The only possible error messages and their meanings follow:
•
•
•
•
Note
When an IP packet is rejected due to an IP security failure, an audit message is sent via Department of Defense Intelligence Information System Network Security for Information Exchange (DNSIX) Network Address Translation (NAT). Also, any debug ip packet output is appended to include a description of the reason for rejection. This description can be any of the following:
•
•
•
•
•
•
•
•
•
•
•
•
•
•
•
•
•
•
•
•
debug ip pgm host
To display debug messages for the PGM Host feature, use the debug ip pgm host privileged EXEC command. To disable PGM Host debugging output, use the no form of this command.
debug ip pgm host [data | nak | spm]
no debug ip pgm host [data | nak | spm]
Syntax Description
Defaults
Debugging for PGM Host is not enabled. If the debug ip pgm host command is used with no additional keywords, debugging is enabled for all PGM Host message types.
Command Modes
Privileged EXEC
Command History
Examples
The following example shows output for the debug ip pgm host command:
Router# debug ip pgm hostHost SPM debugging is onHost NAK/NCF debugging is onHost ODATA/RDATA debugging is onThe following example shows output of the debug ip pgm host command when the data keyword is used.
Router# debug ip pgm host data02:50:23:PGM Host:Received ODATA from 10.0.30.2 to 224.3.3.3 (74 bytes)02:50:23: ODATA TSI 00000A001E02-0401 data-dport BBBB csum 9317 tlen 7402:50:23: tsqn 31 dsqn 39The following example shows output of the debug ip pgm host command when the nak keyword is used. In the following example, the host sends a NAK to the source for a missing packet and the source returns an NCF to the host followed by an RDATA data packet.
Router# debug ip pgm host nak02:50:24:PGM Host:Sending NAK from 10.0.32.2 to 10.0.32.1 (36 bytes)02:50:24: NAK TSI 00000A001E02-0401 data-dport BBBB csum 04EC tlen 3602:50:24: dsqn 38 data source 10.0.30.2 group 224.3.3.302:50:24:PGM Host:Received NCF from 10.0.30.2 to 224.3.3.3 (36 bytes)02:50:24: NCF TSI 00000A001E02-0401 data-dport BBBB csum 02EC tlen 3602:50:24: dsqn 38 data source 10.0.30.2 group 224.3.3.302:50:24:PGM Host:Received RDATA from 10.0.30.2 to 224.3.3.3 (74 bytes)02:50:24: RDATA TSI 00000A001E02-0401 data-dport BBBB csum 9218 tlen 7402:50:24: tsqn 31 dsqn 38The following example shows output of the debug ip pgm host command with the spm keyword:
Router# debug ip pgm host spm02:49:39:PGM Host:Received SPM from 10.0.30.2 to 224.3.3.3 (36 bytes)02:49:39: SPM TSI 00000A001E02-0401 data-dport BBBB csum EA08 tlen 3602:49:39: dsqn 980 tsqn 31 lsqn 31 NLA 10.0.32.1Related Commands
debug ip pgm router
To display debug messages for PGM, use the debug ip pgm router privileged EXEC command. Use the no form of the command to disable debugging output.
debug ip pgm router [spm | nak | data]
no debug ip pgm router [spm | nak | data]
Syntax Description
Defaults
Debugging for PGM is is not enabled. If the debug ip pgm router command is used with no additional keywords, debugging is enabled for all PGM message types.
Command History
Examples
The following example shows output of the debug ip pgm router command:
Router# debug ip pgm routerSPM debugging is onNAK/NNAK/NCF debugging is onRDATA debugging is onThe following example shows output of the debug ip pgm router command with the spm keyword:
Router# debug ip pgm router spmPGM: Received SPM on Ethernet1/0/5 from 10.7.0.200 to 227.7.7.7 (52 bytes)SPM TSI 0A0700C85555-1000 data-dport 1001 csum CCCC tlen 52dsqn 3758096779 tsqn 1954 isqn 1979 lsqn 1990NLA 10.7.0.200SPM from source/RPF-neighbour 10.7.0.200 for 10.7.0.200 (SPT)Forwarded SPM from 10.7.0.200 to 227.7.7.7The following is a debug message for a selective SPM:
Router# debug ip pgm router spmPGM: Received SPM on Ethernet1/0/5 from 10.7.0.200 to 234.4.3.2 (52 bytes)SPM TSI 0A0700C85555-2000 data-dport 2001 csum CCCC tlen 52 Options P N Odsqn 3758096768 tsqn 1986 isqn 1994 lsqn 2006NLA 10.7.0.200SPM from source/RPF-neighbour 10.7.0.200 for 10.7.0.200 (SPT)Forwarded SPM from 10.7.0.200 to 227.7.7.7The "P N O" flags indicate which options are present in this packet:
•
•
•
The following example shows output of the debug ip pgm router command with the nak keyword:
Router# debug ip pgm router nakPGM: Received NAK on Ethernet1/0/0 from 10.1.0.4 to 10.1.0.2 (36 bytes)NAK TSI 0A0700C85555-1000 data-dport 1001 csum CCCC tlen 36dsqn 1990 data source 10.7.0.200 group 227.7.7.7NAK unicast routed to RPF neighbour 10.4.0.1Forwarding NAK from 10.1.0.4 to 10.4.0.1 for 10.7.0.200PGM: Received NCF on Ethernet1/0/5 from 10.7.0.200 to 227.7.7.7 (36 bytes)NCF TSI 0A0700C85555-1000 data-dport 1001 csum CACC tlen 36dsqn 1990 data source 10.7.0.200 group 227.7.7.7NAK retx canceled for TSI 0A0700C85555-1000 dsqn 1990NAK elimination started for TSI 0A0700C85555-1000 dsqn 1990PGM: Received NCF on Ethernet1/0/5 from 10.7.0.200 to 227.7.7.7 (36 bytes)NCF TSI 0A0700C85555-1000 data-dport 1001 csum CACC tlen 36dsqn 1991 data source 10.7.0.200 group 227.7.7.7No NAK retx outstanding for TSI 0A0700C85555-1000 dsqn 1991NAK anticipated for TSI 0A0700C85555-1000 dsqn 1991The following example shows output of the debug ip pgm router command with the data keyword. The debug message is for an RDATA packet for which the router has only anticipated state, sqn 1991. Because it did not actually get a NAK, this RDATA is not forwarded by the PGM router.
Router# debug ip pgm router dataPGM: Received RDATA on Ethernet1/0/5 from 10.7.0.200 to 227.7.7.7 (70 bytes)RDATA TSI 0A0700C85555-1000 data-dport 1001 csum CCCC tlen 32tsqn 1954 dsqn 1990Marking Ethernet1/0/0 for forwardingMarking Serial5/0 for skippingForwarded RDATA from 10.7.0.200 to 227.7.7.7Debug message for RDATA packet corresponding to a NAK for sqn1990. Since the NAK was received on Ethernet1/0/0, RDATA is forwardedout only that interface and another interface in the multicast olistSerial5/0 is skipped.PGM: Received RDATA on Ethernet1/0/5 from 10.7.0.200 to 227.7.7.7 (70 bytes)RDATA TSI 0A0700C85555-1000 data-dport 1001 csum CCCC tlen 32tsqn 1954 dsqn 1991Eliminated RDATA (null oif) from 10.7.0.200 to 227.7.7.7Related Commands
Clears PGM traffic statistics.
ip pgm router
Enables the PGM Router Assist feature for the interface.
show ip pgm router
Displays PGM traffic statistics and TSI state.
debug ip pim
To display Protocol Independent Multicast (PIM) packets received and sent, and to display PIM-related events, use the debug ip pim command in privileged EXEC mode. To disable debugging output, use the no form of this command.
debug ip pim [vrf vrf-name] [group-address | atm | auto-rp | bsr | df [rp-address] | hello | tag]
no debug ip pim [vrf vrf-name] [group-address | atm | auto-rp | bsr | df [rp-address] | hello | tag]
Syntax Description
Defaults
All PIM packets are displayed.
Command Modes
Privileged EXEC
Command History
Usage Guidelines
PIM uses Internet Group Management Protocol (IGMP) packets to communicate with routers and advertise reachability information.
Use this command with the debug ip igmp and debug ip mrouting commands to display additional multicast routing information.
Examples
The following is sample output from the debug ip pim command:
Router# debug ip pim 224.2.0.1PIM: Received Join/Prune on Ethernet1 from 172.16.37.33PIM: Received Join/Prune on Ethernet1 from 172.16.37.33PIM: Received Join/Prune on Tunnel0 from 10.3.84.1PIM: Received Join/Prune on Ethernet1 from 172.16.37.33PIM: Received Join/Prune on Ethernet1 from 172.16.37.33PIM: Received RP-Reachable on Ethernet1 from 172.16.20.31PIM: Update RP expiration timer for 224.2.0.1PIM: Forward RP-reachability packet for 224.2.0.1 on Tunnel0PIM: Received Join/Prune on Ethernet1 from 172.16.37.33PIM: Prune-list (10.221.196.51/32, 224.2.0.1)PIM: Set join delay timer to 2 seconds for (10.221.0.0/16, 224.2.0.1) on Ethernet1PIM: Received Join/Prune on Ethernet1 from 172.16.37.6PIM: Received Join/Prune on Ethernet1 from 172.16.37.33PIM: Received Join/Prune on Tunnel0 from 10.3.84.1PIM: Join-list: (*, 224.2.0.1) RP 172.16.20.31PIM: Add Tunnel0 to (*, 224.2.0.1), Forward statePIM: Join-list: (10.0.0.0/8, 224.2.0.1)PIM: Add Tunnel0 to (10.0.0.0/8, 224.2.0.1), Forward statePIM: Join-list: (10.4.0.0/16, 224.2.0.1)PIM: Prune-list (172.16.84.16/28, 224.2.0.1) RP-bit set RP 172.16.84.16PIM: Send Prune on Ethernet1 to 172.16.37.6 for (172.16.84.16/28, 224.2.0.1), RPPIM: For RP, Prune-list: 10.9.0.0/16PIM: For RP, Prune-list: 10.16.0.0/16PIM: For RP, Prune-list: 10.49.0.0/16PIM: For RP, Prune-list: 10.84.0.0/16PIM: For RP, Prune-list: 10.146.0.0/16PIM: For 10.3.84.1, Join-list: 172.16.84.16/28PIM: Send periodic Join/Prune to RP via 172.16.37.6 (Ethernet1)The following lines appear periodically when PIM is running in sparse mode and indicate to this router the multicast groups and multicast sources in which other routers are interested:
PIM: Received Join/Prune on Ethernet1 from 172.16.37.33PIM: Received Join/Prune on Ethernet1 from 172.16.37.33The following lines appear when a rendezvous point (RP) message is received and the RP timer is reset. The expiration timer sets a checkpoint to make sure the RP still exists. Otherwise, a new RP must be discovered.
PIM: Received RP-Reachable on Ethernet1 from 172.16.20.31PIM: Update RP expiration timer for 224.2.0.1PIM: Forward RP-reachability packet for 224.2.0.1 on Tunnel0The prune message in the following line states that this router is not interested in the Source-Active (SA) information. This message tells an upstream router to stop forwarding multicast packets from this source. The address 10.221.196.51/32 indicates a host route with 32 bits of mask.
PIM: Prune-list (10.221.196.51/32, 224.2.0.1)In the following line, a second router on the network wants to override the prune message that the upstream router just received. The timer is set at a random value so that if additional routers on the network still want to receive multicast packets for the group, only one will actually send the message. The other routers will receive the join message and then suppress sending their own message.
PIM: Set join delay timer to 2 seconds for (10.221.0.0/16, 224.2.0.1) on Ethernet1In the following line, a join message is sent toward the RP for all sources:
PIM: Join-list: (*, 224.2.0.1) RP 172.16.20.31In the following lines, the interface is being added to the outgoing interface (OIF) of the (*, G) and
(S, G) multicast route (mroute) table entry so that packets from the source will be forwarded out that particular interface:PIM: Add Tunnel0 to (*, 224.2.0.1), Forward statePIM: Add Tunnel0 to (10.0.0.0/8, 224.2.0.1), Forward stateThe following line appears in sparse mode only. There are two trees on which data may be received: the RP tree and the source tree. In dense mode there is no RP. After the source and the receiver have discovered one another at the RP, the first-hop router for the receiver will usually join to the source tree rather than the RP tree.
PIM: Prune-list (172.16.84.16/28, 224.2.0.1) RP-bit set RP 172.16.84.16The send prune message in the next line shows that a router is sending a message to a second router saying that the first router should no longer receive multicast packets for the (S, G). The RP at the end of the message indicates that the router is pruning the RP tree and is most likely joining the source tree, although the router may not have downstream members for the group or downstream routers with members of the group. The output shows the specific sources from which this router no longer wants to receive multicast messages.
PIM: Send Prune on Ethernet1 to 172.16.37.6 for (172.16.84.16/28, 224.2.0.1), RPThe following lines indicate that a prune message is sent toward the RP so that the router can join the source tree rather than the RP tree:
PIM: For RP, Prune-list: 10.9.0.0/16PIM: For RP, Prune-list: 10.16.0.0/16PIM: For RP, Prune-list: 10.49.0.0/16In the following line, a periodic message is sent toward the RP. The default period is once per minute. Prune and join messages are sent toward the RP or source rather than directly to the RP or source. It is the responsibility of the next hop router to take proper action with this message, such as continuing to forward it to the next router in the tree.
PIM: Send periodic Join/Prune to RP via 172.16.37.6 (Ethernet1)Related Commands