-
Cisco IOS Debug Command Reference, Release 12.2
-
About the Cisco IOS Software Documentation
-
Using Cisco IOS Software
-
Using Debug Commands
-
Conditionally Triggered Debugging
-
Commands: debug aaa accounting through debug appn trs
-
Commands: debug arap through debug clns events
-
Commands: debug clns igrp packets through debug dmsp doc-to-fax
-
Commands: debug dmsp fax-to-doc through debug ip drp
-
Commands: debug ip dvmrp through debug ip pim
-
Commands: debug ip pim atm through debug ip wccp packets
-
Commands: debug ipx ipxwan through debug lane client
-
Commands: debug lane config through debug mmoip aaa
-
Commands: debug modem through debug ppp
-
Commands: debug ppp bap through debug sdllc
-
Commands: debug serial interface through debug tacacs events
-
Commands: debug tag-switching adjacency through debug tag-switching xtagatm vc
-
Commands: debug tarp events through debug voip settlement transaction
-
Commands: debug vpdn through debug xns routing
-
Appendix A: X.25 Cause and Diagnostic Codes
-
Appendix B: ISDN Switch Types, Codes, and Values
-
 Feedback
Table Of Contents
debug frame-relay end-to-end keepalive
debug frame-relay informationelements
debug frame-relay ip tcp header-compression
debug frame-relay networklayerinterface
debug ip cef accounting non-recursive
debug dmsp fax-to-doc
To display debug messages for doc MSP fax-to-doc, use the debug dmsp fax-to-doc EXEC command. To disable the debug messages, use the no form of this command.
debug dmsp fax-to-doc [tiff-writer]
no debug dmsp fax-to-doc [tiff-writer]
Syntax Description
tiff-writer
(Optional) Displays debug messages that occur while the DocMSP Component is receiving T4 fax data and producing TIFF packets.
Defaults
No default behavior or values.
Command History
Examples
The following example displays output from the debug dmsp fax-to-doc command.
Router# debug dmsp fax-to-doc*Oct 16 08:29:54.487: docmsp_call_setup_request: callid=22*Oct 16 08:29:54.487: docmsp_call_setup_request(): ramp data dir=OFFRAMP, conf dir=SRC*Oct 16 08:29:54.487: docmsp_caps_ind: call id=22, src=21*Oct 16 08:29:54.487: docmsp_bridge cfid=15, srccid=22, dstcid=21*Oct 16 08:29:54.487: docmsp_bridge(): ramp data dir=OFFRAMP, conf dir=SRC, encode out=2*Oct 16 08:29:54.487: docmsp_bridge cfid=16, srccid=22, dstcid=17*Oct 16 08:29:54.487: docmsp_bridge(): ramp data dir=OFFRAMP, conf dir=DEST, encode out=2*Oct 16 08:29:54.487: docmsp_xmit: call id src=17, dst=22*Oct 16 08:29:54.487: docmsp_process_rcv_data: call id src=17, dst=22*Oct 16 08:29:54.487: offramp_data_process:*Oct 16 08:29:54.515: docmsp_get_msp_event_buffer:*Oct 16 08:29:56.115: docmsp_call_setup_request: callid=24*Oct 16 08:29:56.115: docmsp_call_setup_request(): ramp data dir=ONRAMP, conf dir=DEST*Oct 16 08:29:56.115: docmsp_caps_ind: call id=24, src=20*Oct 16 08:29:56.115: docmsp_bridge cfid=17, srccid=24, dstcid=20Related Commands
debug dmsp doc-to-fax
Displays debug messages for the doc Media Service Provider TIFF or text2Fax engine.
debug drip event
To display debug messages for Duplicate Ring Protocol (DRiP) events, use the debug drip event privileged EXEC command. Use the no form of this command to disable debugging output.
debug drip event
no debug drip event
Syntax Description
This command has no arguments or keywords.
Defaults
Debugging is disabled for DRiP events.
Command History
Usage Guidelines
When a TrBRF interface is configured on the RSM, the DRiP protocol is activated. The DRiP protocol adds the VLAN ID specified in the router command to its database and recognizes the VLAN as a locally configured, active VLAN.
Examples
The following examples show output for the debug drip event command.
DRiP gets a packet from the network:
612B92C0: 01000C00 00000000 0C501900 0000AAAA .........P....**612B92D0: 0300000C 00020000 00000100 0CCCCCCC .............LLL612B92E0: 00000C50 19000020 AAAA0300 000C0102 ...P... **......612B92F0: 01010114 00000002 00000002 00000C50 ...............P612B9300: 19000001 04C00064 04 .....@.d.DRiP gets a packet from the network:
Recvd. pakDRiP recognizes that the VLAN ID it is getting is a new one from the network:
6116C840: 0100 0CCCCCCC ...LLL6116C850: 00102F72 CBFB0024 AAAA0300 000C0102 ../rK{.$**......6116C860: 01FF0214 0002E254 00015003 00102F72 ......bT..P.../r6116C870: C8000010 04C00014 044003EB 14 H....@...@.k.DRIP : remote update - Never heard of this vlanDRiP attempts to resolve any conflicts when it discovers a new VLAN. The value action = 1 means to notify the local platform of change in state.
DRIP : resolve remote for vlan 20 in VLAN0DRIP : resolve remote - action = 1The local platform is notified of change in state:
DRIP Change notification active vlan 20Another new VLAN ID was received in the packet:
DRIP : resolve remote for vlan 1003 in Vlan0No action is required:
DRIP : resolve remote - action = 0Thirty seconds have expired, and DRiP sends its local database entries to all its trunk ports:
DRIP : local timer expiredDRIP : transmit on 0000.0c50.1900, length = 24612B92C0: 01000C00 00000000 0C501900 0000AAAA .........P....**612B92D0: 0300000C 00020000 00000100 0CCCCCCC .............LLL612B92E0: 00000C50 19000020 AAAA0300 000C0102 ...P... **......612B92F0: 01FF0114 00000003 00000002 00000C50 ...............P612B9300: 19000001 04C00064 04 .....@.d.debug drip packet
To display debug messages for DRiP packets, use the debug drip packet privileged EXEC command. Use the no form of this command to disable debugging output.
debug drip packet
no debug drip packet
Syntax Description
This command has no arguments or keywords.
Defaults
Debugging is not enabled for DRiP packets.
Command History
Usage Guidelines
Before you use this command, you can optionally use the clear drip command first. As a result the DRiP counters are reset to 0. If the DRiP counters begin to increment, the router is receiving packets.
Examples
Following is sample output for the debug drip packet command.
The following type of output is displayed when a packet is entering the router and you use the show debug command:
039E5FC0: 0100 0CCCCCCC 00E0A39B 3FFB0028 ...LLL.`#.?{.(039E5FD0: AAAA0300 000C0102 01FF0314 0000A5F6 **............%v039E5FE0: 00008805 00E0A39B 3C000000 04C00028 .....`#.<....@.(039E5FF0: 04C00032 044003EB 0F .@.2.@.k.039FBD20: 01000C00 00000010 ........The following type of output is displayed when a packet is sent by the router:
039FBD30: A6AEB450 0000AAAA 0300000C 00020000 &.4P..**........039FBD40: 00000100 0CCCCCCC 0010A6AE B4500020 .....LLL..&.4P.039FBD50: AAAA0300 000C0102 01FF0114 00000003 **..............039FBD60: 00000002 0010A6AE B4500001 04C00064 ......&.4P...@.d039FBD70: 04 .Related Commands
debug dsc clock
To display output for the time-division multiplexing (TDM) clock switching events on the dial shelf controller, use the debug dsc clock privileged EXEC command. To turn off output, use the no form of this command.
debug dsc clock
no debug dsc clock
Syntax Description
This command has no arguments or keywords.
Command History
Usage Guidelines
The debug dsc clock command displays TDM clock switching events on the dial shelf controller. The information displayed includes the following:
•
Clock configuration messages received from trunks via the bus
•
•
Examples
The following example shows that the debug dsc clock command has been enabled, that trunk messages are received, and that the configuration message has been received:
Router# debug dsc clockDial Shelf Controller Clock debugging is onRouter#00:02:55: Clock Addition msg of len 12 priority 8 from slot 1 port 1 on line 000:02:55: Trunk 1 has reloadedRelated Commands
debug dsip
To display output for the distributed system interconnect protocol (DSIP) used between the router shelf and the dial shelf, use the debug dsip privileged EXEC command. To disable the output, use the no form of this command.
debug dsip {all | api | boot | console | trace | transport}
no debug dsip {all | api | boot | console | trace | transport}
Syntax Description
Command History
Usage Guidelines
The debug dsip command is used to display messages for DSIP between the router shelf and the dial shelf. Using this command, you can display booting messages generated when the download of an image occurs, view console operation, trace logging of MAC header information, and view DSIP transport-layer information as modules interact with the underlying physical media driver. This command can be applied to a single modem or a group of modems.
Once the debug dsip trace command is enabled, you can read the information captured in the trace buffer using the show dsip tracing command.
Examples
The following example shows the available debug dsip command options:
Router# debug dsip ?all All DSIP debugging messagesapi DSIP API debuggingboot DSIP bootingconsole DSIP consoletrace DSIP tracingtransport DSIP transportThe following example indicates that the debug dsip trace command logs MAC headers of the various classes of DSIP packets. View the logged information using the show dsip tracing command.
Router# debug dsip traceNIP tracing debugging is onRouter# show dsip tracingNIP Control Packet Trace------------------------------------------------------------Dest:00e0.b093.2238 Src:0007.4c72.0058 Type:200B SrcShelf:1 SrcSlot:11MsgType:0 MsgLen:82 Timestamp: 00:49:14------------------------------------------------------------Dest:00e0.b093.2238 Src:0007.4c72.0028 Type:200B SrcShelf:1 SrcSlot:5MsgType:0 MsgLen:82 Timestamp: 00:49:14------------------------------------------------------------Related Commands
Displays output for modem control messages that are received or sent to the router.
debug dspu activation
To display information on downstream physical unit (DSPU) activation, use the debug dspu activation privileged EXEC command. The no form of this command disables debugging output.
debug dspu activation [name]
no debug dspu activation [name]
Syntax Description
Usage Guidelines
The debug dspu activation command displays all DSPU activation traffic. To restrict the output to a specific host or PU, include the host or PU name argument. You cannot turn off debugging output for an individual PU if that PU has not been named in the debug dspu activation command.
Examples
The following is sample output from the debug dspu activation command. Not all intermediate numbers are shown for the "activated" and "deactivated" logical unit (LU) address ranges.
Router# debug dspu activationDSPU: LS HOST3745 connectedDSPU: PU HOST3745 activatedDSPU: LU HOST3745-2 activatedDSPU: LU HOST3745-3 activated...DSPU: LU HOST3745-253 activatedDSPU: LU HOST3745-254 activatedDSPU: LU HOST3745-2 deactivatedDSPU: LU HOST3745-3 deactivated...DSPU: LU HOST3745-253 deactivatedDSPU: LU HOST3745-254 deactivatedDSPU: LS HOST3745 disconnectedDSPU: PU HOST3745 deactivatedTable 42 describes the significant fields shown in the display.
Related Commands
Displays information on a DSPU packet.
Displays information on DSPU FSM state changes.
Displays information on DSPU trace activity.
debug dspu packet
To display information on a downstream physical unit (DSPU) packet, use the debug dspu packet privileged EXEC command. The no form of this command disables debugging output.
debug dspu packet [name]
no debug dspu packet [name]
Syntax Description
Usage Guidelines
The debug dspu packet command displays all DSPU packet data flowing through the router. To restrict the output to a specific host or PU, include the host or PU name argument. You cannot turn off debugging output for an individual PU if that PU has not been named in the debug dspu packet command.
Examples
The following is sample output from the debug dspu packet command:
Router# debug dspu packetDSPU: Rx: PU HOST3745 data length 12 data:2D0003002BE16B80 000D0201DSPU: Tx: PU HOST3745 data length 25 data:2D0000032BE1EB80 000D020100850000 000C060000010000 00DSPU: Rx: PU HOST3745 data length 12 data:2D0004002BE26B80 000D0201DSPU: Tx: PU HOST3745 data length 25 data:2D0000042BE2EB80 000D020100850000 000C060000010000 00Table 43 describes the significant fields shown in the display.
Related Commands
Displays debug messages for DRiP packets.
Displays information on DSPU FSM state changes.
Displays information on DSPU trace activity.
debug dspu state
To display information on downstream physical unit (DSPU) finite state machine (FSM) state changes, use the debug dspu state privileged EXEC command. The no form of this command disables debugging output.
debug dspu state [name]
no debug dspu state [name]
Syntax Description
Usage Guidelines
Use the debug dspu state command to display only the FSM state changes. To see all FSM activity, use the debug dspu trace command. You cannot turn off debugging output for an individual PU if that PU has not been named in the debug dspu state command.
Examples
The following is sample output from the debug dspu state command. Not all intermediate numbers are shown for the "activated" and "deactivated" logical unit (LU) address ranges.
Router# debug dspu stateDSPU: LS HOST3745: input=StartLs, Reset -> PendConOutDSPU: LS HOST3745: input=ReqOpn.Cnf, PendConOut -> XidDSPU: LS HOST3745: input=Connect.Ind, Xid -> ConnInDSPU: LS HOST3745: input=Connected.Ind, ConnIn -> ConnectedDSPU: PU HOST3745: input=Actpu, Reset -> ActiveDSPU: LU HOST3745-2: input=uActlu, Reset -> upLuActiveDSPU: LU HOST3745-3: input=uActlu, Reset -> upLuActive...DSPU: LU HOST3745-253: input=uActlu, Reset -> upLuActiveDSPU: LU HOST3745-254: input=uActlu, Reset -> upLuActiveDSPU: LS HOST3745: input=PuStopped, Connected -> PendDiscDSPU: LS HOST3745: input=Disc.Cnf, PendDisc -> PendCloseDSPU: LS HOST3745: input=Close.Cnf, PendClose -> ResetDSPU: PU HOST3745: input=T2ResetPu, Active -> ResetDSPU: LU HOST3745-2: input=uStopLu, upLuActive -> ResetDSPU: LU HOST3745-3: input=uStopLu, upLuActive -> Reset...DSPU: LU HOST3745-253: input=uStopLu, upLuActive -> ResetDSPU: LU HOST3745-254: input=uStopLu, upLuActive -> ResetTable 44 describes the significant fields shown in the display.
Related Commands
Displays debug messages for DRiP packets.
Displays information on DSPU packet.
Displays information on DSPU trace activity.
debug dspu trace
To display information on downstream physical unit (DSPU) trace activity, which includes all finite state machine (FSM) activity, use the debug dspu trace privileged EXEC command. The no form of this command disables debugging output.
debug dspu trace [name]
no debug dspu trace [name]
Syntax Description
Usage Guidelines
Use the debug dspu trace command to display all FSM state changes. To see FSM state changes only, use the debug dspu state command. You cannot turn off debugging output for an individual PU if that PU has not been named in the debug dspu trace command.
Examples
The following is sample output from the debug dspu trace command:
Router# debug dspu traceDSPU: LS HOST3745 input = 0 ->(1,a1)DSPU: LS HOST3745 input = 5 ->(5,a6)DSPU: LS HOST3745 input = 7 ->(5,a9)DSPU: LS HOST3745 input = 9 ->(5,a28)DSPU: LU HOST3745-2 in:0 s:0->(2,a1)DSPU: LS HOST3745 input = 19 ->(8,a20)DSPU: LS HOST3745 input = 18 ->(8,a17)DSPU: LU HOST3745-3 in:0 s:0->(2,a1)DSPU: LS HOST3745 input = 19 ->(8,a20)DSPU: LS HOST3745 input = 18 ->(8,a17)DSPU: LU HOST3745-252 in:0 s:0->(2,a1)DSPU: LS HOST3745 input = 19 ->(8,a20)DSPU: LS HOST3745 input = 18 ->(8,a17)DSPU: LU HOST3745-253 in:0 s:0->(2,a1)DSPU: LS HOST3745 input = 19 ->(8,a20)DSPU: LS HOST3745 input = 18 ->(8,a17)DSPU: LU HOST3745-254 in:0 s:0->(2,a1)DSPU: LS HOST3745 input = 19 ->(8,a20)Table 45 describes significant fields in the output.
Related Commands
Displays debug messages for DRiP packets.
Displays information on DSPU packet.
Displays information on DSPU FSM state changes.
debug dss ipx event
To display debug messages for route change events that affect IPX Multilayer Switching (MLS), use the debug dss ipx event privileged EXEC command. To disable debugging output, use the no form of the command.
debug dss ipx event
no debug dss ipx event
Syntax Description
This command has no arguments or keywords.
Defaults
Debugging is not enabled.
Command History
Examples
The following displays sample output from the debug dss ipx event command:
Router# debug dss ipx eventDSS IPX events debugging is onRouter# configure terminalEnter configuration commands, one per line. End with CNTL/Z.Router(config)# interface vlan 22Router(config-if)# ipx access-group 800 out05:51:36:DSS-feature:dss_ipxcache_version():idb:NULL, reason:42,prefix:0, mask:FFFFFFFF05:51:36:DSS-feature:dss_ipx_access_group():idb:Vlan2205:51:36:DSS-feature:dss_ipx_access_list()05:51:36:DSS-base 05:51:33.834 dss_ipx_invalidate_interface Vl2205:51:36:DSS-base 05:51:33.834 dss_set_ipx_flowmask_reg 205:51:36:%IPX mls flowmask transition from 1 to 2 due to new status ofsimple IPX access list on interfacesRelated Commands
debug eigrp fsm
To display debugging information about Enhanced Interior Gateway Routing Protocol (EIGRP) feasible successor metrics (FSM), use the debug eigrp fsm privileged EXEC command. The no form of this command disables debugging output.
debug eigrp fsm
no debug eigrp fsm
Syntax Description
This command has no arguments or keywords.
Usage Guidelines
This command helps you observe EIGRP feasible successor activity and to determine whether route updates are being installed and deleted by the routing process.
Examples
The following is sample output from the debug eigrp fsm command:
Router# debug eigrp fsmDUAL: dual_rcvupdate(): 172.25.166.0 255.255.255.0 via 0.0.0.0 metric 750080/0DUAL: Find FS for dest 172.25.166.0 255.255.255.0. FD is 4294967295, RD is 4294967295 foundDUAL: RT installed 172.25.166.0 255.255.255.0 via 0.0.0.0DUAL: dual_rcvupdate(): 192.168.4.0 255.255.255.0 via 0.0.0.0 metric 4294967295/4294967295DUAL: Find FS for dest 192.168.4.0 255.255.255.0. FD is 2249216, RD is 2249216DUAL: 0.0.0.0 metric 4294967295/4294967295not found Dmin is 4294967295DUAL: Dest 192.168.4.0 255.255.255.0 not entering active state.DUAL: Removing dest 192.168.4.0 255.255.255.0, nexthop 0.0.0.0DUAL: No routes. Flushing dest 192.168.4.0 255.255.255.0In the first line, DUAL stands for diffusing update algorithm. It is the basic mechanism within EIGRP that makes the routing decisions. The next three fields are the Internet address and mask of the destination network and the address through which the update was received. The metric field shows the metric stored in the routing table and the metric advertised by the neighbor sending the information. If shown, the term "Metric... inaccessible" usually means that the neighbor router no longer has a route to the destination, or the destination is in a hold-down state.
In the following output, EIGRP is attempting to find a feasible successor for the destination. Feasible successors are part of the DUAL loop avoidance methods. The FD field contains more loop avoidance state information. The RD field is the reported distance, which is the metric used in update, query, or reply packets.
The indented line with the "not found" message means a feasible successor (FS) was not found for 192.168.4.0 and EIGRP must start a diffusing computation. This means it begins to actively probe (sends query packets about destination 192.168.4.0) the network looking for alternate paths to 192.164.4.0.
DUAL: Find FS for dest 192.168.4.0 255.255.255.0. FD is 2249216, RD is 2249216DUAL: 0.0.0.0 metric 4294967295/4294967295not found Dmin is 4294967295The following output indicates the route DUAL successfully installed into the routing table:
DUAL: RT installed 172.25.166.0 255.255.255.0 via 0.0.0.0The following output shows that no routes to the destination were discovered and that the route information is being removed from the topology table:
DUAL: Dest 192.168.4.0 255.255.255.0 not entering active state.DUAL: Removing dest 192.168.4.0 255.255.255.0, nexthop 0.0.0.0DUAL: No routes. Flushing dest 192.168.4.0 255.255.255.0debug eigrp neighbor
To display neighbors discovered by the Enhanced Interior Gateway Routing Protocol (EIGRP), use the debug eigrp neighbor command in privileged EXEC mode. To disable debug eigrp neighbor, use the no form of this command.
debug eigrp neighbor [siatimer] [static]
no debug eigrp neighbor [siatimer] [static]
Syntax Description
Defaults
Debugging for EIGRP neighbors is not enabled.
Command Modes
Privileged EXEC
Command History
Examples
The following is sample output from the debug eigrp neighbor command.
Router# debug eigrp neighbor static
EIGRP Static Neighbors debugging is on
Router#configure terminal
Router(config)#router eigrp 100
Router(config-router)#neighbor 10.1.1.1 e3/1
Router(config-router)#
22:40:07:EIGRP:Multicast Hello is disabled on Ethernet3/1!
22:40:07:EIGRP:Add new static nbr 10.1.1.1 to AS 100 Ethernet3/1
Router(config-router)#no neighbor 10.1.1.1 e3/1
Router(config-router)#
22:41:23:EIGRP:Static nbr 10.1.1.1 not in AS 100 Ethernet3/1 dynamic list
22:41:23:EIGRP:Delete static nbr 10.1.1.1 from AS 100 Ethernet3/1
22:41:23:EIGRP:Multicast Hello is enabled on Ethernet3/1!
Related Commands
show ip eigrp neighbors
Displays EIGRP neighbors.
neighbor
Defines a neighboring router with which to exchange routing information.
debug eigrp packet
To display general debugging information, use the debug eigrp packet privileged EXEC command. The no form of this command disables debugging output.
debug eigrp packet
no debug eigrp packet
Syntax Description
This command has no arguments or keywords.
Usage Guidelines
If a communication session is closing when it should not be, an end-to-end connection problem can be the cause. The debug eigrp packet command is useful for analyzing the messages traveling between the local and remote hosts.
Examples
The following is sample output from the debug eigrp packet command:
Router# debug eigrp packetEIGRP: Sending HELLO on Ethernet0/1AS 109, Flags 0x0, Seq 0, Ack 0EIGRP: Sending HELLO on Ethernet0/1AS 109, Flags 0x0, Seq 0, Ack 0EIGRP: Sending HELLO on Ethernet0/1AS 109, Flags 0x0, Seq 0, Ack 0EIGRP: Received UPDATE on Ethernet0/1 from 192.195.78.24,AS 109, Flags 0x1, Seq 1, Ack 0EIGRP: Sending HELLO/ACK on Ethernet0/1 to 192.195.78.24,AS 109, Flags 0x0, Seq 0, Ack 1EIGRP: Sending HELLO/ACK on Ethernet0/1 to 192.195.78.24,AS 109, Flags 0x0, Seq 0, Ack 1EIGRP: Received UPDATE on Ethernet0/1 from 192.195.78.24,AS 109, Flags 0x0, Seq 2, Ack 0The output shows transmission and receipt of Enhanced Interior Gateway Routing Protocol (EIGRP) packets. These packet types may be hello, update, request, query, or reply packets. The sequence and acknowledgment numbers used by the EIGRP reliable transport algorithm are shown in the output. Where applicable, the network-layer address of the neighboring router is also included.
Table 46 describes the significant fields shown in the display.
debug eigrp transmit
To display transmittal messages sent by the Enhanced Interior Gateway Routing Protocol (EIGRP), use the debug eigrp transmit command in privileged EXEC mode. To disable debug eigrp transmit, use the no form of this command.
debug eigrp transmit [ack] [build] [detail] [link] [packetize] [peerdown] [startup] [strange]
no debug eigrp transmit [ack] [build] [detail] [link] [packetize] [peerdown] [sia] [startup] [strange]
Syntax Description
Defaults
Debugging for EIGRP transmittal messages is not enabled.
Command Modes
Privileged EXEC
Command History
Examples
The following is sample output from the debug eigrp transmit command.
Router# debug eigrp transmitEIGRP Transmission Events debugging is on(ACK, PACKETIZE, STARTUP, PEERDOWN, LINK, BUILD, STRANGE, SIA, DETAIL)Router#configure terminalEnter configuration commands, one per line. End with CNTL/Z.Router#(config)#router eigrp 100Router#(config-router)#network 10.4.9.0 0.0.0.255Router#(config-router)#5d22h: DNDB UPDATE 10.0.0.0/8, serno 0 to 1, refcount 0Router#(config-router)#debug errors
To display errors, use the debug errors privileged EXEC command. The no form of this command disables debugging output.
debug errors
no debug errors
Syntax Description
This command has no arguments or keywords.
Examples
The following is sample output from the debug errors command:
Router# debug errors(2/0): Encapsulation error, link=7, host=836CA86D.(4/0): VCD#7 failed to echo OAM. 4 triesThe first line of output indicates that a packet was routed to the interface, but no static map was set up to route that packet to the proper virtual circuit.
The second line of output shows that an OAM F5 (virtual circuit) cell error occurred.
debug events
To display events, use the debug events privileged EXEC command. The no form of this command disables debugging output.
debug events
no debug events
Syntax Description
This command has no arguments or keywords.
Usage Guidelines
This command displays events that occur on the interface processor and is useful for diagnosing problems in an network. It provides an overall picture of the stability of the network. In a stable network, the debug events command does not return any information. If the command generates numerous messages, the messages can indicate the possible source of problems.
When configuring or making changes to a router or interface for, enable the debug events command. Doing so alerts you to the progress of the changes or to any errors that might result. Also use this command periodically when you suspect network problems.
Examples
The following is sample output from the debug events command:
Router# debug eventsRESET(4/0): PLIM type is 1, Rate is 100Mbpsaip_disable(4/0): state=1config(4/0)aip_love_note(4/0): asr=0x201aip_enable(4/0)aip_love_note(4/0): asr=0x4000aip_enable(4/0): restarting VCs: 7aip_setup_vc(4/0): vc:1 vpi:1 vci:1aip_love_note(4/0): asr=0x200aip_setup_vc(4/0): vc:2 vpi:2 vci:2aip_love_note(4/0): asr=0x200aip_setup_vc(4/0): vc:3 vpi:3 vci:3aip_love_note(4/0): asr=0x200aip_setup_vc(4/0): vc:4 vpi:4 vci:4aip_love_note(4/0): asr=0x200aip_setup_vc(4/0): vc:6 vpi:6 vci:6aip_love_note(4/0): asr=0x200aip_setup_vc(4/0): vc:7 vpi:7 vci:7aip_love_note(4/0): asr=0x200aip_setup_vc(4/0): vc:11 vpi:11 vci:11aip_love_note(4/0): asr=0x200Table 47 describes the significant fields in the display.
The following line indicates that the AIP was reset. The PLIM detected was 1, so the maximum rate is set to 100 Mbps.
RESET(4/0): PLIM type is 1, Rate is 100MbpsThe following line indicates that the AIP was given a shutdown command, but the current configuration indicates that the AIP should be up:
aip_disable(4/0): state=1The following line indicates that a configuration command has been completed by the AIP:
aip_love_note(4/0): asr=0x201The following line indicates that the AIP was given a no shutdown command to take it out of the shutdown state:
aip_enable(4/0)The following line indicates that the AIP detected a carrier state change. It does not indicate that the carrier is down or up, only that it has changed.
aip_love_note(4/0): asr=0x4000The following line of output indicates that the AIP enable function is restarting all PVCs automatically:
aip_enable(4/0): restarting VCs: 7The following lines of output indicate that PVC 1 was set up and a successful completion code was returned:
aip_setup_vc(4/0): vc:1 vpi:1 vci:1aip_love_note(4/0): asr=0x200debug fddi smt-packets
To display information about Station Management (SMT) frames received by the router, use the debug fddi smt-packets privileged EXEC command. The no form of this command disables debugging output.
debug fddi smt-packets
no debug fddi smt-packets
Syntax Description
This command has no arguments or keywords.
Examples
The following is sample output from the debug fddi smt-packets command. In this example, an SMT frame has been output by FDDI 1/0. The SMT frame is a next station addressing (NSA) neighbor information frame (NIF) request frame with the parameters as shown.
Router# debug fddi smt-packetsSMT O: Fddi1/0, FC=NSA, DA=ffff.ffff.ffff, SA=00c0.eeee.be04,class=NIF, type=Request, vers=1, station_id=00c0.eeee.be04, len=40- code 1, len 8 -- 000000016850043F- code 2, len 4 -- 00010200- code 3, len 4 -- 00003100- code 200B, len 8 -- 0000000100000000Table 48 describes the significant fields shown in the display.
debug fmsp receive
To display debug messages for FMSP receive, use the debug fmsp receive EXEC command. To disable the debug messages, use the no form of this command.
debug fmsp receive [t30 | t38]
no debug fmsp receive [t30 | t38]
Syntax Description
Defaults
No default behavior or values.
Command History
Examples
The following example displays output from the debug fmsp receive command.
Router# debug fmsp receive*Oct 16 08:31:33.243: faxmsp_call_setup_request: call id=28*Oct 16 08:31:33.243: faxmsp_call_setup_request: ramp data dir=ONRAMP, conf dir=DEST*Oct 16 08:31:33.243: faxmsp_bridge(): cfid=19, srccid=28, dstcid=27*Oct 16 08:31:33.243: faxmsp_bridge(): ramp data dir=ONRAMP, conf dir=DEST*Oct 16 08:31:33.243: faxmsp_bridge(): Explicit caps ind. done; will wait for registry caps ind*Oct 16 08:31:33.243: faxmsp_caps_ind: call id=28, src=27*Oct 16 08:31:33.243: faxmsp_caps_ack: call id src=27*Oct 16 08:31:33.279: faxmsp_call_setup_request: call id=29*Oct 16 08:31:33.279: faxmsp_call_setup_request: ramp data dir=OFFRAMP, conf dir=SRC*Oct 16 08:31:33.283: faxmsp_bridge(): cfid=20, srccid=29, dstcid=26*Oct 16 08:31:33.283: faxmsp_bridge(): ramp data dir=OFFRAMP, conf dir=SRC*Oct 16 08:31:33.283: faxmsp_bridge(): Explicit caps ind. done; will wait for registry caps ind*Oct 16 08:31:33.283: faxmsp_caps_ind: call id=29, src=26*Oct 16 08:31:33.283: faxmsp_caps_ack: call id src=26*Oct 16 08:31:33.635: faxmsp_codec_download_done: call id=29*Oct 16 08:31:33.635: faxmsp_codec_download_done: call id=28*Oct 16 08:31:33.643: faxmsp_xmit: callid src=26, dst=29*Oct 16 08:31:33.643: faxmsp_xmit: callid src=27, dst=28*Oct 16 08:31:33.643: faxmsp_process_rcv_data: call id src=26, dst=29Related Commands
debug fmsp send
To display debug messages for FMSP send, use the debug fmsp send EXEC command. To disable the debug messages, use the no form of this command.
debug fmsp send [t30 | t38]
no debug fmsp send [t30 | t38]
Syntax Description
Defaults
No default behavior or values.
Command History
Examples
The following example displays output from the debug fmsp send command.
Router# debug fmsp sendJan 1 05:02:56.782: faxmsp_call_setup_request: call id=21Jan 1 05:02:56.782: faxmsp_call_setup_request: ramp data dir=OFFRAMP, conf dir=SRCJan 1 05:02:56.782: faxmsp_bridge(): cfid=7, srccid=21, dstcid=20Jan 1 05:02:56.782: faxmsp_bridge(): ramp data dir=OFFRAMP, conf dir=SRCJan 1 05:02:56.782: faxmsp_bridge(): Explicit caps ind. done; will wait for registry caps indJan 1 05:02:56.782: faxmsp_caps_ind: call id=21, src=20Jan 1 05:02:56.782: faxmsp_caps_ack: call id src=20Jan 1 05:02:57.174: faxmsp_codec_download_done: call id=21Jan 1 05:02:57.174: faxMsp_tx_buffer callID=21Jan 1 05:02:57.178: faxMsp_tx_buffer callID=21Jan 1 05:02:57.178: faxMsp_tx_buffer callID=21Jan 1 05:02:57.178: faxMsp_tx_buffer callID=21Jan 1 05:02:57.182: faxmsp_xmit: callid src=20, dst=21Jan 1 05:02:57.182: faxmsp_process_rcv_data: call id src=20, dst=21Jan 1 05:03:01.814: faxmsp_xmit: callid src=20, dst=21Jan 1 05:03:01.814: faxmsp_process_rcv_data: call id src=20, dst=21Jan 1 05:03:01.814: faxMsp_tx_buffer callID=21Jan 1 05:03:02.802: faxmsp_xmit: callid src=20, dst=21Jan 1 05:03:02.802: faxmsp_process_rcv_data: call id src=20, dst=21Jan 1 05:03:02.822: faxmsp_xmit: callid src=20, dst=21Jan 1 05:03:02.822: faxmsp_process_rcv_data: call id src=20, dst=21Jan 1 05:03:02.854: faxmsp_xmit: callid src=20, dst=21Jan 1 05:03:02.854: faxmsp_process_rcv_data: call id src=20, dst=21Related Commands
debug foip off-ramp
To display debug messages for off-ramp faxmail, use the debug foip off-ramp EXEC command. To disable the debug messages, use the no form of this command.
debug foip off-ramp
no debug foip off-ramp
Syntax Description
This command has no arguments or keywords.
Defaults
No default behavior or values.
Command History
Examples
The following example displays output from the debug foip off-ramp command.
Router# debug foip off-rampJan 1 02:31:17.539: lapp off: CC_EV_CALL_HANDOFF, cid(0xB)Jan 1 02:31:17.539: loffHandoff: called number=5271714, callid=0xBJan 1 02:31:17.543: loffSetupPeer: cid1(0xB)Jan 1 02:31:17.543: destPat(5271714),matched(1),pref(5),tag(20),encap(1)Jan 1 02:31:22.867: lapp off: CC_EV_CALL_CONNECTED, cid(0xC)Jan 1 02:31:22.867: st=CALL_SETTING cid(0xB,0x0,0x0,0xC),cfid(0x0,0x0,0x0)Jan 1 02:31:22.867: loffConnectedJan 1 02:31:22.867: loffFlushPeerTagQueue cid(11) peer list: (empty)Jan 1 02:31:22.867: lapp off: CC_EV_CONF_CREATE_DONE, cid(0xC), cid2(0xD), cfid(0x1)Jan 1 02:31:22.867: st=CONFERENCING3 cid(0xB,0x0,0xD,0xC),cfid(0x0,0x0,0x1)Jan 1 02:31:22.867: loffConfDone3Jan 1 02:31:30.931: lapp off: CC_EV_FROM_FMSP_ON_CALL_DETAIL, cid(0xD)Jan 1 02:31:30.931: st=WAIT_SESS_INFO cid(0xB,0x0,0xD,0xC),cfid(0x0,0x0,0x1)Jan 1 02:31:30.931: loffSessionInfoJan 1 02:31:30.931: encd=2, resl=2, spd=26, min_scan_len=0, csid= 4085271714Jan 1 02:31:30.931: lapp off: CC_EV_CONF_CREATE_DONE, cid(0xD), cid2(0xE), cfid(0x2)Jan 1 02:31:30.931: st=CONFERENCING2 cid(0xB,0xE,0xD,0xC),cfid(0x0,0x2,0x1)Jan 1 02:31:30.931: loffConfDone2Related Commands
debug foip on-ramp
To display debug messages for on-ramp faxmail, use the debug foip on-ramp EXEC command. To disable the debug messages, use the no form of this command.
debug foip on-ramp
no debug foip on-ramp
Syntax Description
This command has no arguments or keywords.
Defaults
No default behavior or values.
Command History
Examples
The following example displays output from the debug foip on-ramp command.
Router# debug foip on-ramp*Oct 16 08:07:01.947: lapp_on_application: Incoming Event: (15 = CC_EV_CALL_HANDOFF), CID(11), DISP(0)*Oct 16 08:07:01.947: lapp_on_call_handoff: Authentication enabled = FALSE*Oct 16 08:07:01.947: lapp_on_call_handoff: Authentication ID = 0*Oct 16 08:07:01.947: lapp_on_call_handoff: Authentication ID source = IVR or unknown*Oct 16 08:07:01.947: lapp_on_call_handoff: Authentication status = SUCCESS*Oct 16 08:07:01.947: lapp_on_call_handoff: Accounting enabled = FALSE*Oct 16 08:07:01.947: lapp_on_call_handoff: Accounting method list = fax*Oct 16 08:07:01.947: lapp_on_conference_vtsp_fmsp: Begin conferencing VTSP and FMSP...*Oct 16 08:07:01.951: lapp_on_change_state: old state(0) new state(1)*Oct 16 08:07:01.951: lapp_on_application: Incoming Event: (29 = CC_EV_CONF_CREATE_DONE), CID(11), DISP(0)*Oct 16 08:07:01.951: lapp_on_application: Current call state = 1*Oct 16 08:07:01.951: lapp_on_conference_created: The VTSP and the FMSP are conferenced*Oct 16 08:07:01.951: lapp_on_conference_created: Wait for FMSP call detail eventRelated Commands
debug frame-relay
To display debugging information about the packets received on a Frame Relay interface, use the debug frame-relay privileged EXEC command. The no form of this command disables debugging output.
debug frame-relay
no debug frame-relay
Syntax Description
This command has no arguments or keywords.
Usage Guidelines
This command helps you analyze the packets that have been received. However, because the debug frame-relay command generates a substantial amount of output, only use it when traffic on the Frame Relay network is fewer than 25 packets per second.
To analyze the packets that have been sent on a Frame Relay interface, use the debug frame-relay packet command.
Examples
The following is sample output from the debug frame-relay command:
Router# debug frame-relaySerial0(i): dlci 500(0x7C41), pkt type 0x809B, datagramsize 24Serial1(i): dlci 1023(0xFCF1), pkt type 0x309, datagramsize 13Serial0(i): dlci 500(0x7C41), pkt type 0x809B, datagramsize 24Serial1(i): dlci 1023(0xFCF1), pkt type 0x309, datagramsize 13Serial0(i): dlci 500(0x7C41), pkt type 0x809B, datagramsize 24Table 49 describes the significant fields shown in the display.
debug frame-relay callcontrol
To display Frame Relay Layer 3 (network layer) call control information, use the debug frame-relay callcontrol privileged EXEC command. The no form of this command disables debugging output.
debug frame-relay callcontrol
no debug frame-relay callcontrol
Syntax Description
This command has no arguments or keywords.
Usage Guidelines
The debug frame-relay callcontrol command is used specifically for observing FRF.4/Q.933 signalling messages and related state changes. The FRF.4/Q.933 specification describes a state machine for call control. The signalling code implements the state machine. The debug statements display the actual event and state combinations.
The Frame Relay switched virtual circuit (SVC) signalling subsystem is an independent software module. When used with the debug frame-relay networklayerinterface command, the debug frame-relay callcontrol command provides a better understanding of the call setup and teardown sequence. The debug frame-relay networklayerinterface command provides the details of the interactions between the signalling subsystem on the router and the Frame Relay subsystem.
Examples
State changes can be observed during a call setup on the calling party side. The debug frame-relay networklayerinterface command shows the following state changes or transitions:
STATE_NULL -> STATE_CALL_INITIATED -> STATE_CALL_PROCEEDING->STATE_ACTIVEThe following messages are samples of output generated during a call setup on the calling side:
6d20h: U0_SetupRequest: Serial06d20h: L3SDL: Ref: 1, Init: STATE_NULL, Rcvd: SETUP_REQUEST, Next: STATE_CALL_INITIATED 6d20h: U1_CallProceeding: Serial06d20h: L3SDL: Ref: 1, Init: STATE_CALL_INITIATED, Rcvd: MSG_CALL_PROCEEDING, Next:STATE_CALL_PROCEEDING6d20h: U3_Connect: Serial06d20h: L3SDL: Ref: 1, Init: STATE_CALL_PROCEEDING, Rcvd: MSG_CONNECT, Next: STATE_ACTIVE 6d20h:The following messages are samples of output generated during a call setup on the called party side. Note the state transitions as the call goes to the active state:
STATE_NULL -> STATE_CALL_PRESENT-> STATE_INCOMING_CALL_PROCEEDING->STATE_ACTIVE1w4d: U0_Setup: Serial2/31w4d: L3SDL: Ref: 32769, Init: STATE_NULL, Rcvd: MSG_SETUP, Next: STATE_CALL_PRESENT 1w4d: L3SDL: Ref: 32769, Init: STATE_CALL_PRESENT, Rcvd: MSG_SETUP, Next:STATE_INCOMING_CALL_PROC 1w4d: L3SDL: Ref: 32769, Init: STATE_INCOMING_CALL_PROC,Rcvd: MSG_SETUP, Next: STATE_ACTIVETable 50 explains the possible call states.
Related Commands
Displays debugging information about the packets that are received on a Frame Relay interface.
Displays NLI information.
debug frame-relay end-to-end keepalive
To display debug messages for the Frame Relay End-to-End Keepalive feature, use the debug frame-relay end-to-end keepalive command. Use the no form of this command to disable the display of debug messages.
debug frame-relay end-to-end keepalive {events | packet}
no debug frame-relay end-to-end keepalive {events | packet}
Syntax Description
Command History
Usage Guidelines
We recommend that both commands be enabled.
Examples
The following examples show typical output from the debug frame-relay end-to-end keepalive packet command. The following example shows output for an outgoing request packet:
EEK (o, Serial0.1 DLCI 200): 1 1 1 3 2 4 3The seven number fields that follow the colon signify the following:
The following example shows output for an incoming reply packet:
EEK (i, Serial0.1 DLCI 200): 1 1 2 3 2 4 4The seven number fields that follow the colon signify the following:
The following example shows typical output from the debug frame-relay end-to-end keepalive events command:
EEK SUCCESS (request, Serial0.2 DLCI 400)EEK SUCCESS (reply, Serial0.1 DLCI 200)EEK sender timeout (Serial0.1 DLCI 200)debug frame-relay events
To display debugging information about Frame Relay ARP replies on networks that support a multicast channel and use dynamic addressing, use the debug frame-relay events privileged EXEC command. The no form of this command disables debugging output.
debug frame-relay events
no debug frame-relay events
Syntax Description
This command has no arguments or keywords.
Usage Guidelines
This command is useful for identifying the cause of end-to-end connection problems during the installation of a Frame Relay network or node.
Note
Examples
The following is sample output from the debug frame-relay events command:
Router# debug frame-relay eventsSerial2(i): reply rcvd 172.16.170.26 126Serial2(i): reply rcvd 172.16.170.28 128Serial2(i): reply rcvd 172.16.170.34 134Serial2(i): reply rcvd 172.16.170.38 144Serial2(i): reply rcvd 172.16.170.41 228Serial2(i): reply rcvd 172.16.170.65 325As the output shows, the debug frame-relay events command returns one specific message type. The first line, for example, indicates that IP address 172.16.170.26 sent a Frame Relay ARP reply; this packet was received as input on serial interface 2. The last field (126) is the data-link connection identifier (DLCI) to use when communicating with the responding router.
debug frame-relay fragment
To display information related to Frame Relay fragmentation on a PVC, use the debug frame-relay fragment privileged EXEC command. Use the no form of this command to turn off the debug function.
debug frame-relay fragment [event | interface type number dlci]
no debug frame-relay fragment [event | interface type number dlci]
Syntax Description
Command History
Usage Guidelines
This command will display event or error messages related to Frame Relay fragmentation; it is only enabled at the PVC level on the selected interface.
This command is not supported on the Cisco MC3810 networking device for fragments received by a PVC configured via the voice-encap command.
Examples
The following example shows sample output from the debug frame-relay fragment command:
Router# debug frame-relay fragment interface serial 0/0 109This may severely impact network performance.You are advised to enable 'no logging console debug'. Continue?[confirm]Frame Relay fragment/packet debugging is onDisplaying fragments/packets on interface Serial0/0 dlci 109 onlySerial0/0(i): dlci 109, rx-seq-num 126, exp_seq-num 126, BE bits set, frag_hdr 04 C0 7ESerial0/0(o): dlci 109, tx-seq-num 82, BE bits set, frag_hdr 04 C0 52The following example shows sample output from the debug frame-relay fragment event command:
Router# debug frame-relay fragment eventThis may severely impact network performance.You are advised to enable 'no logging console debug'. Continue?[confirm]Frame Relay fragment event/errors debugging is onFrame-relay reassembled packet is greater than MTU size, packet dropped on serial 0/0dlci 109Unexpected B bit frame rx on serial0/0 dlci 109, dropping pending segmentsRx an out-of-sequence packet on serial 0/0 dlci 109, seq_num_received 17seq_num_expected 19Related Commands
debug frame-relay foresight
To observe Frame Relay traces relating to traffic shaping with router ForeSight enabled, use the debug frame-relay foresight privileged EXEC command. The no form of this command disables debugging output.
debug frame-relay foresight
no debug frame-relay foresight
Syntax Description
This command has no arguments or keywords.
Examples
The following is sample output that shows the display message returned in response to the debug frame-relay foresight command:
Router# debug frame-relay foresightFR rate control for DLCI 17 due to ForeSight msgThis message indicates the router learned from the ForeSight message that DLCI 17 is now experiencing congestion. The output rate for this circuit should be slowed down, and in the router this DLCI is configured to adapt traffic shaping in response to foresight messages.
Related Commands
debug frame-relay informationelements
To display information about Frame Relay Layer 3 (network layer) information element parsing and construction, use the debug frame-relay informationelements privileged EXEC command. The no form of this command disables debugging output.
debug frame-relay informationelements
no debug frame-relay informationelements
Syntax Description
This command has no arguments or keywords.
Usage Guidelines
Within the FRF.4/Q.933 signalling specification, messages are divided into subunits called information elements. Each information element defines parameters specific to the call. These parameters can be values configured on the router, or values requested from the network.
The debug frame-relay informationelements command shows the signalling message in hexadecimal format. Use this command to determine parameters being requested and granted for a call.
Note
Caution
Examples
The following is sample output from the debug frame-relay informationelements command. In this example, each information element has a length associated with it. For those with odd-numbered lengths, only the specified bytes are valid, and the extra byte is invalid. For example, in the message "Call Ref, length: 3, 0x0200 0x0100," only "02 00 01" is valid; the last "00" is invalid.
lw0d# debug frame-relay informationelementsRouter: Outgoing MSG_SETUPRouter: Dir: U --> N, Type: Prot Disc, length: 1, 0x0800Router: Dir: U --> N, Type: Call Ref, length: 3, 0x0200 0x0100Router: Dir: U --> N, Type: Message type, length: 1, 0x0500Router: Dir: U --> N, Type: Bearer Capability, length: 5, 0x0403 0x88A0 0xCF00Router: Dir: U --> N, Type: DLCI, length: 4, 0x1902 0x46A0Router: Dir: U --> N, Type: Link Lyr Core, length: 27, 0x4819 0x090B 0x5C0B 0xDC0ARouter: 0x3140 0x31C0 0x0B21 0x4021Router: 0xC00D 0x7518 0x7598 0x0E09Router: 0x307D 0x8000Router: Dir: U --> N, Type: Calling Party, length: 12, 0x6C0A 0x1380 0x3837 0x3635Router: 0x3433 0x3231Router: Dir: U --> N, Type: Calling Party Subaddr, length: 4, 0x6D02 0xA000Router: Dir: U --> N, Type: Called Party, length: 11, 0x7009 0x9331 0x3233 0x3435Router: 0x3637 0x386ERouter: Dir: U --> N, Type: Called Party Subaddr, length: 4, 0x7102 0xA000Router: Dir: U --> N, Type: Low Lyr Comp, length: 5, 0x7C03 0x88A0 0xCE65Router: Dir: U --> N, Type: User to User, length: 4, 0x7E02 0x0000Table 51 explains the information elements in the example shown.
Related Commands
debug frame-relay ip tcp header-compression
To display debugging information about TCP/IP header compression on Frame Relay interfaces, use the debug frame-relay ip tcp header-compression command in privileged EXEC mode. To disable debugging output, use the no form of this command.
debug frame-relay ip tcp header-compression
no debug frame-relay ip tcp header-compression
Syntax Description
This command has no arguments or keywords.
Defaults
Disabled
Command Modes
Privileged EXEC
Command History
Usage Guidelines
The debug frame-relay ip tcp header-compression command shows the control packets that are passed to initialize IP header compression (IPHC) on a permanent virtual circuit (PVC). For Cisco IPHC, typically two packets are passed: one sent and one received per PVC. (Inverse Address Resolution Protocol (InARP) packets are sent on PVCs that do not have a mapping defined between a destination protocol address and the data-link connection identifier (DLCI) or Frame Relay PVC bundle that connects to the destination address.)
Debug messages are displayed only if the IPHC control protocol is renegotiated (for an interface or PVC state change or for a configuration change).
Examples
The following is sample output from the debug frame-relay ip tcp header-compression command when Cisco IPHC is configured in the IPHC profile:
Router# debug frame-relay ip tcp header-compression*Nov 14 09:22:07.991: InARP REQ: Tx compr_flags 43 *Nov 14 09:22:08.103: InARP RSP: Rx compr_flags: 43Table 52 describes the significant fields shown in the display.
debug frame-relay lapf
To display Frame Relay switched virtual circuit (SVC) Layer 2 information, use the debug frame-relay lapf privileged EXEC command. The no form of this command disables debugging output.
debug frame-relay lapf
no debug frame-relay lapf
Syntax Description
This command has no arguments or keywords.
Usage Guidelines
Use the debug frame-relay lapf command to troubleshoot the data-link control portion of Layer 2 that runs over data-link connection identifier (DLCI) 0. Use this command only if you have a problem bringing up Layer 2. You can use the show interface serial command to determine the status of Layer 2. If it shows a Link Access Procedure, Frame Relay (LAPF) state of down, Layer 2 has a problem.
Examples
The following is sample output from the debug frame-relay lapf command. In this example, a line being brought up indicates an exchange of set asynchronous balanced mode extended (SABME) and unnumbered acknowledgment (UA) commands. A SABME is initiated by both sides, and a UA is the response. Until the SABME gets a UA response, the line is not declared to be up. The p/f value indicates the poll/final bit setting. TX means send, and RX means receive.
Router# debug frame-relay lapfRouter: *LAPF Serial0 TX -> SABME Cmd p/f=1Router: *LAPF Serial0 Enter state 5Router: *LAPF Serial0 RX <- UA Rsp p/f=1Router: *LAPF Serial0 lapf_ua_5Router: *LAPF Serial0 Link up!Router: *LAPF Serial0 RX <- SABME Cmd p/f=1Router: *LAPF Serial0 lapf_sabme_78Router: *LAPF Serial0 TX -> UA Rsp p/f=1In the following example, a line in an up LAPF state should see a steady exchange of RR (receiver ready) messages. TX means send, RX means receive, and N(R) indicates the receive sequence number.
Router# debug frame-relay lapfRouter: *LAPF Serial0 T203 expired, state = 7Router: *LAPF Serial0 lapf_rr_7Router: *LAPF Serial0 TX -> RR Rsp p/f=1, N(R)= 3Router: *LAPF Serial0 RX <- RR Cmd p/f=1, N(R)= 3Router: *LAPF Serial0 lapf_rr_7Router: *LAPF Serial0 TX -> RR Rsp p/f=1, N(R)= 3Router: *LAPF Serial0 RX <- RR Cmd p/f=1, N(R)= 3Router: *LAPF Serial0 lapf_rr_7debug frame-relay lmi
To display information on the local management interface (LMI) packets exchanged by the router and the Frame Relay service provider, use the debug frame-relay lmi privileged EXEC command. The no form of this command disables debugging output.
debug frame-relay lmi [interface name]
no debug frame-relay lmi [interface name]
Syntax Description
Usage Guidelines
You can use this command to determine whether the router and the Frame Relay switch are sending and receiving LMI packets properly.
Note
Examples
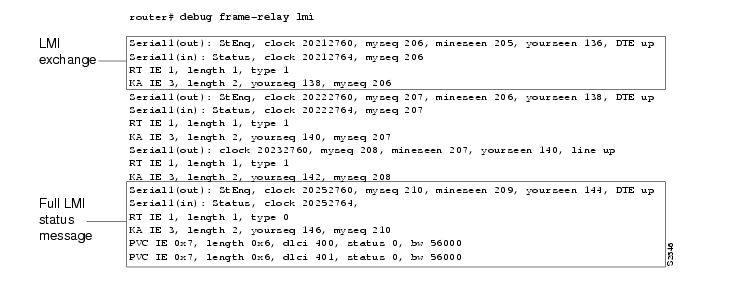
The following is sample output from the debug frame-relay lmi command:
The first four lines describe an LMI exchange. The first line describes the LMI request the router has sent to the switch. The second line describes the LMI reply the router has received from the switch. The third and fourth lines describe the response to this request from the switch. This LMI exchange is followed by two similar LMI exchanges. The last six lines consist of a full LMI status message that includes a description of the two permanent virtual circuits (PVCs) of the router.
Table 53 describes significant fields shown in the first line of the display.
Table 54 describes the significant fields shown in the third and fourth lines of the display.
Table 55 describes the significant fields shown in the last line of the display.
debug frame-relay networklayerinterface
To display Network Layer Interface (NLI) information, use the debug frame-relay networklayerinterface privileged EXEC command. The no form of this command disables debugging output.
debug frame-relay networklayerinterface
no debug frame-relay networklayerinterface
Syntax Description
This command has no arguments or keywords.
Usage Guidelines
The Frame Relay SVC signalling subsystem is decoupled from the rest of the router code by means of the NLI intermediate software layer.
The debug frame-relay networklayerinterface command shows activity within the network-layer interface when a call is set up or torn down. All output that contains an NL relates to the interaction between the Q.933 signalling subsystem and the NLI.
Note
Examples
The following is sample output from the debug frame-relay networklayerinterface command. This example displays the output generated when a call is set up. The second example shows the output generated when a call is torn down.
Router# debug frame-relay networklayerinterfaceRouter: NLI STATE: L3_CALL_REQ, Call ID 1 state 0Router: NLI: Walking the event table 1Router: NLI: Walking the event table 2Router: NLI: Walking the event table 3Router: NLI: Walking the event table 4Router: NLI: Walking the event table 5Router: NLI: Walking the event table 6Router: NLI: Walking the event table 7Router: NLI: Walking the event table 8Router: NLI: Walking the event table 9Router: NLI: NL0_L3CallReqRouter: NLI: State: STATE_NL_NULL, Event: L3_CALL_REQ, Next: STATE_L3_CALL_REQRouter: NLI: Enqueued outgoing packet on holdqRouter: NLI: Map-list search: Found maplist bermudaRouter: daddr.subaddr 0, saddr.subaddr 0, saddr.subaddr 0Router: saddr.subaddr 0, daddr.subaddr 0, daddr.subaddr 0Router: nli_parameter_negotiationRouter: NLI STATE: NL_CALL_CNF, Call ID 1 state 10Router: NLI: Walking the event table 1Router: NLI: Walking the event table 2Router: NLI: Walking the event table 3Router: NLI: NLx_CallCnfRouter: NLI: State: STATE_L3_CALL_REQ, Event: NL_CALL_CNF, Next: STATE_NL_CALL_CNFRouter: Checking maplist "junk"Router: working with maplist "bermuda"Router: Checking maplist "bermuda"Router: working with maplist "bermuda"Router: NLI: Emptying holdQ, link 7, dlci 100, size 104Router# debug frame-relay networklayerinterfaceRouter: NLI: L3 Call Release Req for Call ID 1Router: NLI STATE: L3_CALL_REL_REQ, Call ID 1 state 3Router: NLI: Walking the event table 1Router: NLI: Walking the event table 2Router: NLI: Walking the event table 3Router: NLI: Walking the event table 4Router: NLI: Walking the event table 5Router: NLI: Walking the event table 6Router: NLI: Walking the event table 7Router: NLI: Walking the event table 8Router: NLI: Walking the event table 9Router: NLI: Walking the event table 10Router: NLI: NLx_L3CallRejRouter: NLI: State: STATE_NL_CALL_CNF, Event: L3_CALL_REL_REQ, Next: STATE_L3_CALL_REL_REQRouter: NLI: junk: State: STATE_NL_NULL, Event: L3_CALL_REL_REQ, Next: STATE_NL_NULLRouter: NLI: Map-list search: Found maplist junkRouter: daddr.subaddr 0, saddr.subaddr 0, saddr.subaddr 0Router: saddr.subaddr 0, daddr.subaddr 0, daddr.subaddr 0Router: nli_parameter_negotiationRouter: NLI STATE: NL_REL_CNF, Call ID 1 state 0Router: NLI: Walking the event table 1Router: NLI: Walking the event table 2Router: NLI: Walking the event table 3Router: NLI: Walking the event table 4Router: NLI: Walking the event table 5Router: NLI: Walking the event table 6Router: NLI: Walking the event table 7Router: NLI: NLx_RelCnfRouter: NLI: State: STATE_NL_NULL, Event: NL_REL_CNF, Next: STATE_NL_NULLTable 56 describes the significant states and events shown in the display.
Related Commands
debug frame-relay packet
To display information on packets that have been sent on a Frame Relay interface, use the debug frame-relay packet privileged EXEC command. The no form of this command disables debugging output.
debug frame-relay packet [interface name [dlci value]]
no debug frame-relay packet [interface name [dlci value]]
Syntax Description
interface name
(Optional) Name of interface or subinterface.
dlci value
(Optional) Data-link connection indentifier (DLCI) decimal value.
Usage Guidelines
This command helps you analyze the packets that are sent on a Frame Relay interface. Because the debug frame-relay packet command generates a substantial amount of output, only use it when traffic on the Frame Relay network is fewer than 25 packets per second. Use the options to limit the debugging output to a specific DLCI or interface.
To analyze the packets received on a Frame Relay interface, use the debug frame-relay command.
Examples
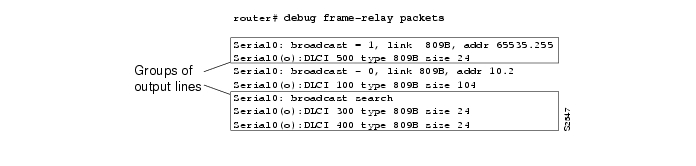
The following is sample output from the debug frame-relay packet command:
The debug frame-relay packet output consists of groups of output lines; each group describes a Frame Relay packet that has been sent. The number of lines in the group can vary, depending on the number of DLCIs on which the packet was sent. For example, the first two pairs of output lines describe two different packets, both of which were sent out on a single DLCI. The last three lines describe a single Frame Relay packet that was sent out on two DLCIs.
Table 57 describes the significant fields shown in the display.
The following lines describe a Frame Relay packet sent to a particular address; in this case AppleTalk address 10.2:
Serial0: broadcast - 0, link 809B, addr 10.2Serial0(o):DLCI 100 type 809B size 104The following lines describe a Frame Relay packet that went out on two different DLCIs, because two Frame Relay map entries were found:
Serial0: broadcast searchSerial0(o):DLCI 300 type 809B size 24Serial0(o):DLCI 400 type 809B size 24The following lines do not appear. They describe a Frame Relay packet sent to a true broadcast address.
Serial1: broadcast searchSerial1(o):DLCI 400 type 800 size 288debug frame-relay ppp
To display debugging information, use the debug frame-relay ppp privileged EXEC command. To disable debugging output, use the no form of this command.
debug frame-relay ppp
no debug frame-relay ppp
Syntax Description
This command has no arguments or keywords.
Usage Guidelines
This command displays error messages for link states and LMI status changes for PPP over Frame Relay sessions.
To debug process-switched packets, use the debug frame-relay packet or debug ppp packet commands. To analyze the packets that have been sent on a Frame Relay interface, use the debug frame-relay packet command.
The debug frame-relay ppp command is generated from process-level switching only and is not CPU intensive.
Examples
The following shows output from the debug frame-relay ppp command where the encapsulation failed for VC 100.
Router# debug frame-relay pppFR-PPP: encaps failed for FR VC 100 on Serial0 downFR-PPP: input- Serial0 vc or va down, pak droppedThe following shows the output from the debug frame relay ppp and debug frame-relay packet commands. This example shows a virtual interface (virtual interface 1) establishing a PPP connection over PPP.
Router# debug frame-relay pppRouter# debug frame-relay packetVi1 LCP: O CONFREQ [Closed] id 1 len 10Vi1 LCP: MagicNumber 0xE0638565 (0x0506E0638565)Serial2/1(o): dlci 201(0x3091), NLPID 0x3CF(PPP), datagramsize 16Vi1 PPP: I pkt type 0xC021, datagramsize 14Vi1 LCP: I CONFACK [REQsent] id 1 len 10Vi1 LCP: MagicNumber 0xE0638565 (0x0506E0638565)Vi1 PPP: I pkt type 0xC021, datagramsize 14Vi1 LCP: I CONFREQ [ACKrcvd] id 6 len 10Vi1 LCP: MagicNumber 0x000EAD99 (0x0506000EAD99)Vi1 LCP: O CONFACK [ACKrcvd] id 6 len 10Vi1 LCP: MagicNumber 0x000EAD99 (0x0506000EAD99)Serial2/1(o): dlci 201(0x3091), NLPID 0x3CF(PPP), datagramsize 16Vi1 IPCP: O CONFREQ [Closed] id 1 len 10Vi1 IPCP: Address 170.100.9.10 (0x0306AA64090A)Serial2/1(o): dlci 201(0x3091), NLPID 0x3CF(PPP), datagramsize 16Vi1 PPP: I pkt type 0x8021, datagramsize 14Vi1 IPCP: I CONFREQ [REQsent] id 1 len 10Vi1 IPCP: Address 170.100.9.20 (0x0306AA640914)Vi1 IPCP: O CONFACK [REQsent] id 1 len 10Vi1 IPCP: Address 170.100.9.20 (0x0306AA640914)Serial2/1(o): dlci 201(0x3091), NLPID 0x3CF(PPP), datagramsize 16Vi1 PPP: I pkt type 0x8021, datagramsize 14Vi1 IPCP: I CONFACK [ACKsent] id 1 len 10Vi1 IPCP: Address 170.100.9.10 (0x0306AA64090A)Vi1 PPP: I pkt type 0xC021, datagramsize 16Vi1 LCP: I ECHOREQ [Open] id 1 len 12 magic 0x000EAD99Vi1 LCP: O ECHOREP [Open] id 1 len 12 magic 0xE0638565Serial2/1(o): dlci 201(0x3091), NLPID 0x3CF(PPP), datagramsize 18Vi1 LCP: O ECHOREQ [Open] id 1 len 12 magic 0xE0638565Serial2/1(o): dlci 201(0x3091), NLPID 0x3CF(PPP), datagramsize 18Vi1 LCP: echo_cnt 4, sent id 1, line upThe following shows the output for the debug frame-relay ppp and debug frame-relay packet commands that report a failed PPP over Frame Relay session. The problem is due to a challenge handshake authentication protocol (CHAP) failure.
Router# debug frame-relay pppRouter# debug frame-relay packetVi1 LCP: O CONFREQ [Listen] id 24 len 10Vi1 LCP: MagicNumber 0xE068EC78 (0x0506E068EC78)Serial2/1(o): dlci 201(0x3091), NLPID 0x3CF(PPP), datagramsize 16Vi1 PPP: I pkt type 0xC021, datagramsize 19Vi1 LCP: I CONFREQ [REQsent] id 18 len 15Vi1 LCP: AuthProto CHAP (0x0305C22305)Vi1 LCP: MagicNumber 0x0014387E (0x05060014387E)Vi1 LCP: O CONFACK [REQsent] id 18 len 15Vi1 LCP: AuthProto CHAP (0x0305C22305)Vi1 LCP: MagicNumber 0x0014387E (0x05060014387E)Serial2/1(o): dlci 201(0x3091), NLPID 0x3CF(PPP), datagramsize 21Vi1 PPP: I pkt type 0xC021, datagramsize 14Vi1 LCP: I CONFACK [ACKsent] id 24 len 10Vi1 LCP: MagicNumber 0xE068EC78 (0x0506E068EC78)Vi1 PPP: I pkt type 0xC223, datagramsize 32Vi1 CHAP: I CHALLENGE id 12 len 28 from "krishna"Vi1 LCP: O TERMREQ [Open] id 25 len 4Serial2/1(o): dlci 201(0x3091), NLPID 0x3CF(PPP), datagramsize 10Vi1 PPP: I pkt type 0xC021, datagramsize 8Vi1 LCP: I TERMACK [TERMsent] id 25 len 4Serial2/1(i): dlci 201(0x3091), pkt type 0x2000, datagramsize 303%SYS-5-CONFIG_I: Configured from console by consoleVi1 LCP: TIMEout: Time 0x199580 State Listendebug frame-relay switching
To display debug messages for switched Frame Relay PVCs, use the debug frame-relay switching EXEC command. To disable Frame Relay switching debugging, use the no form of this command.
debug frame-relay switching interface interface dlci [interval interval]
no debug frame-relay switching
Syntax Description
Defaults
The default interval is 1 second.
Command History
12.0(12)S
This command was introduced.
12.1(5)T
This command was implemented in Cisco IOS Release 12.1(5)T.
Usage Guidelines
The debug frame-relay switching command can be used only on switched Frame Relay PVCs, not terminated PVCs.
Debug statistics are displayed only if they have changed.
Note
Examples
The following example shows sample output for the debug frame-relay switching command:
Router# debug frame-relay switching interface s2/1 1000 interval 2Frame Relay switching debugging is onDisplay frame switching debug on interface Serial2/1 dlci 10001d02h: Serial2/1 dlci 1000: 32 packets switched to Serial2/0 dlci 10021d02h: Serial2/1 dlci 1000: 1800 packets output1d02h: Serial2/1 dlci 1000: 4 packets dropped - outgoing PVC inactive1d02h: Serial2/1 dlci 1000: Incoming PVC status changed to ACTIVE1d02h: Serial2/1 dlci 1000: Outgoing PVC status changed to ACTIVE1d02h: Serial2/1 dlci 1000: Incoming interface hardware module state changed to UP1d02h: Serial2/1 dlci 1000: Outgoing interface hardware module state changed to UPdebug fras error
To display information about Frame Relay access support (FRAS) protocol errors, use the debug fras error privileged EXEC command. The no form of this command disables debugging output.
debug fras error
no debug fras error
Syntax Description
This command has no arguments or keywords.
Usage Guidelines
For complete information on the FRAS process, use the debug fras message along with the debug fras error command.
Examples
The following is sample output from the debug fras error command. This example shows that no logical connection exists between the local station and remote station in the current setup:
Router# debug fras errorFRAS: No route, lmac 1000.5acc.7fb1 rmac 4fff.0000.0000, lSap=0x4, rSap=0x4FRAS: Can not find the SetupRelated Commands
Displays information about CLS messages.
Displays general information about FRAS messages.
Displays information about FRAS data-link control state changes.
debug fras-host activation
To display the LLC2 session activation and deactivation frames (such as XID, SABME, DISC, UA) that are being handled by the FRAS host, use the debug fras-host activation privileged EXEC command. The no form of this command disables debugging output.
debug fras-host activation
no debug fras-host activation
Syntax Description
This command has no arguments or keywords.
Usage Guidelines
If many LLC2 sessions are being activated or deactivated at any time, this command may generate a substantial amount of output to the console.
Examples
The following is sample output from the debug fras-host activation command:
Router# debug fras-host activationFRHOST: Snd TST C to HOST, DA = 4001.3745.1088 SA = 400f.dddd.001e DSAP = 0x00 SSAP = 0x04FRHOST: Fwd BNN XID to HOST, DA = 4001.3745.1088 SA = 400f.dddd.001e DSAP = 0x04 SSAP = 0x04FRHOST: Fwd HOST XID to BNN, DA = 400f.dddd.001e SA = 4001.3745.1088 DSAP = 0x04 SSAP = 0x05FRHOST: Fwd BNN XID to HOST, DA = 4001.3745.1088 SA = 400f.dddd.001e DSAP = 0x04 SSAP = 0x04FRHOST: Fwd HOST SABME to BNN, DA = 400f.dddd.001e SA = 4001.3745.1088 DSAP = 0x04 SSAP = 0x04FRHOST: Fwd BNN UA to HOST, DA = 4001.3745.1088 SA = 400f.dddd.001e DSAP = 0x04 SSAP = 0x05The first line indicates that the FRAS Host sent a TEST Command to the host. In the second line, the FRAS Host forwards an XID frame from a BNN device to the host. In the third line, the FRAS Host forwards an XID from the host to the BNN device.
Table 58 describes the significant fields shown in the display.
debug fras-host error
To enable the FRAS Host to send error messages to the console, use the debug fras-host error privileged EXEC command. The no form of this command disables debugging output.
debug fras-host error
no debug fras-host error
Syntax Description
This command has no arguments or keywords.
Examples
The following is sample output from the debug fras-host error command when the I-field in a TEST Response frame from a host does not match the I-field of the TEST Command sent by the FRAS Host:
Router# debug fras-host errorFRHOST: SRB TST R Protocol Violation - LLC I-field not maintained.debug fras-host packet
To see which LLC2 session frames are being handled by the FRAS Host, use the debug fras-host packet privileged EXEC command. The no form of this command disables debugging output.
debug fras-host packet
no debug fras-host packet
Syntax Description
This command has no arguments or keywords.
Usage Guidelines
Use this command with great care. If many LLC2 sessions are active and passing data, this command may generate a substantial amount of output to the console and impact device performance.
Examples
The following is sample output from the debug fras-host packet command:
Router# debug fras-host packetFRHOST: Snd TST C to HOST, DA = 4001.3745.1088 SA = 400f.dddd.001e DSAP = 0x00 SSAP = 0x04FRHOST: Fwd BNN XID to HOST, DA = 4001.3745.1088 SA = 400f.dddd.001e DSAP = 0x04 SSAP = 0x04FRHOST: Fwd HOST XID to BNN, DA = 400f.dddd.001e SA = 4001.3745.1088 DSAP = 0x04 SSAP = 0x05FRHOST: Fwd BNN XID to HOST, DA = 4001.3745.1088 SA = 400f.dddd.001e DSAP = 0x04 SSAP = 0x04FRHOST: Fwd HOST SABME to BNN, DA = 400f.dddd.001e SA = 4001.3745.1088 DSAP = 0x04 SSAP = 0x04FRHOST: Fwd BNN UA to HOST, DA = 4001.3745.1088 SA = 400f.dddd.001e DSAP = 0x04 SSAP = 0x05FRHOST: Fwd HOST LLC-2 to BNN, DA = 400f.dddd.001e SA = 4001.3745.1088 DSAP = 0x04 SSAP = 0x04FRHOST: Fwd BNN LLC-2 to HOST, DA = 4001.3745.1088 SA = 400f.dddd.001e DSAP = 0x04 SSAP = 0x05FRHOST: Fwd HOST LLC-2 to BNN, DA = 400f.dddd.001e SA = 4001.3745.1088 DSAP = 0x04 SSAP = 0x04FRHOST: Fwd BNN LLC-2 to HOST, DA = 4001.3745.1088 SA = 400f.dddd.001e DSAP = 0x04 SSAP = 0x04The debug fras-host packet output contains all of the output from the debug fras-host activation command and additional information. The first six lines of this sample display are the same as the output from the debug fras-host activation command. The last lines show LLC-2 frames being sent between the BNN device and the host.
The following describes the significant fields shown in the display.
debug fras-host snmp
To display messages to the console describing SNMP requests to the FRAS Host MIB, use the debug fras-host snmp privileged EXEC command. The no form of this command disables debugging output.
debug fras-host snmp
no debug fras-host snmp
Syntax Description
This command has no arguments or keywords.
Usage Guidelines
Use of this command may result in a substantial amount of output to the screen. Only use this command for problem determination.
Examples
The following is sample output from the debug fras-host snmp command. In this example, the MIB variable k_frasHostConnEntry_get() is providing SNMP information for the FRAS host.
Router# debug fras-host snmpk_frasHostConnEntry_get(): serNum = -1, vRingIfIdx = 31, frIfIdx = 12Hmac = 4001.3745.1088, frLocSap = 4, Rmac = 400f.dddd.001e, frRemSap = 4Table 60 describes the significant fields shown in the display.
debug fras message
To display general information about Frame Relay access support (FRAS) messages, use the debug fras message privileged EXEC command. The no form of this command disables debugging output.
debug fras message
no debug fras message
Syntax Description
This command has no arguments or keywords.
Usage Guidelines
For complete information on the FRAS process, use the debug fras error command along with the debug fras message command.
Examples
The following is sample output from the debug fras message command. This example shows incoming Cisco Link Services (CLS) primitives:
Router# debug fras messageFRAS: receive 4C23FRAS: receive CC09Related Commands
debug fras state
To display information about Frame Relay access support (FRAS) data-link control link-state changes, use the debug fras state privileged EXEC command. The no form of this command disables debugging output.
debug fras state
no debug fras state
Syntax Description
This command has no arguments or keywords.
Examples
The following is sample output from the debug fras state command. This example shows the state changing from a request open station is sent state to an exchange XID state.
Possible states are the following: reset, request open station is sent, exchange xid, connection request is sent, signal station wait, connection response wait, connection response sent, connection established, disconnect wait, and number of link states.
Router# debug fras stateFRAS: TR0 (04/04) oldstate=LS_RQOPNSTNSENT, input=RQ_OPNSTN_CNFFRAS: newstate=LS_EXCHGXIDRelated Commands
Limits output for some debugging commands based on the interfaces.
Displays information about FRAS protocol errors.
Displays general information about FRAS messages.
debug ftpserver
To display information about the FTP server process, use the debug ftpserver privileged EXEC command. The no form of this command disables debugging output.
debug ftpserver
no debug ftpserver
Syntax Description
This command has no arguments or keywords.
Examples
The following is sample output from the debug ftpserver command:
Router# debug ftpserverMar 3 10:21:10: %FTPSERVER-6-NEWCONN: FTP Server - new connection made.-Process= "TCP/FTP Server", ipl= 0, pid= 53Mar 3 10:21:10: FTPSRV_DEBUG:FTP Server file path: 'disk0:'Mar 3 10:21:10: FTPSRV_DEBUG:(REPLY) 220Mar 3 10:21:10: FTPSRV_DEBUG:FTProuter IOS-FTP server (version 1.00) ready.Mar 3 10:21:10: FTPSRV_DEBUG:FTP Server Command received: 'USER aa'Mar 3 10:21:20: FTPSRV_DEBUG:(REPLY) 331Mar 3 10:21:20: FTPSRV_DEBUG:Password required for 'aa'.Mar 3 10:21:20: FTPSRV_DEBUG:FTP Server Command received: 'PASS aa'Mar 3 10:21:21: FTPSRV_DEBUG:(REPLY) 230Mar 3 10:21:21: FTPSRV_DEBUG:Logged in.Mar 3 10:21:21: FTPSRV_DEBUG:FTP Server Command received: 'SYST'Mar 3 10:21:21: FTPSRV_DEBUG:(REPLY) 215Mar 3 10:21:21: FTPSRV_DEBUG:Cisco IOS Type: L8 Version: IOS/FTP 1.00Mar 3 10:21:21: FTPSRV_DEBUG:FTP Server Command received: 'PWD'Mar 3 10:21:35: FTPSRV_DEBUG:(REPLY) 257Mar 3 10:21:39: FTPSRV_DEBUG:FTP Server Command received: 'CWD disk0:/syslogd.d'r/'Mar 3 10:21:45: FTPSRV_DEBUG:FTP Server file path: 'disk0:/syslogd.dir'Mar 3 10:21:45: FTPSRV_DEBUG:(REPLY) 250Mar 3 10:21:45: FTPSRV_DEBUG:CWD command successful.Mar 3 10:21:45: FTPSRV_DEBUG:FTP Server Command received: 'PORT 171,69,30,20,22',32Mar 3 10:21:46: FTPSRV_DEBUG:(REPLY) 200Mar 3 10:21:46: FTPSRV_DEBUG:PORT command successful.Mar 3 10:21:46: FTPSRV_DEBUG:FTP Server Command received: 'LIST'Mar 3 10:21:47: FTPSRV_DEBUG:FTP Server file path: 'disk0:/syslogd.dir/.'Mar 3 10:21:47: FTPSRV_DEBUG:(REPLY) 220Mar 3 10:23:11: FTPSRV_DEBUG:Opening ASCII mode data connection for file list.Mar 3 10:23:11: FTPSRV_DEBUG:(REPLY) 226Mar 3 10:23:12: FTPSRV_DEBUG:Transfer complete.Mar 3 10:23:12: FTPSRV_DEBUG:FTP Server Command received: 'TYPE I'Mar 3 10:23:14: FTPSRV_DEBUG:(REPLY) 200Mar 3 10:23:14: FTPSRV_DEBUG:Type set to I.Mar 3 10:23:14: FTPSRV_DEBUG:FTP Server Command received: 'PORT 171,69,30,20,22',51Mar 3 10:23:20: FTPSRV_DEBUG:(REPLY) 200Mar 3 10:23:20: FTPSRV_DEBUG:PORT command successful.Mar 3 10:23:20: FTPSRV_DEBUG:FTP Server Command received: 'RETR syslogd.1'Mar 3 10:23:21: FTPSRV_DEBUG:FTP Server file path: 'disk0:/syslogd.dir/syslogd.1'Mar 3 10:23:21: FTPSRV_DEBUG:FTPSERVER: Input path passed Top-dir(disk0:/syslogd.dir/) test.Mar 3 10:23:21: FTPSRV_DEBUG:(REPLY) 150Mar 3 10:23:21: FTPSRV_DEBUG:Opening BINARY mode data connection for syslogd.1 (607317 bytes).Mar 3 10:23:21: FTPSRV_DEBUG:(REPLY) 226Mar 3 10:23:29: FTPSRV_DEBUG:Transfer complete.The sample output corresponds to the following FTP client session. In this example, the user connects to the FTP server, views the contents of the top-level directory, and gets a file.
FTPclient% ftp FTProuterConnected to FTProuter.cisco.com.220 FTProuter IOS-FTP server (version 1.00) ready.Name (FTProuter:me): aa331 Password required for 'aa'.Password:230 Logged in.Remote system type is Cisco.ftp> pwd257 "disk0:/syslogd.dir/" is current directory.ftp> dir200 PORT command successful.150 Opening ASCII mode data connection for file list.syslogd.1syslogd.2syslogd.3syslogd.4syslogd.5syslogd.6syslogd.7syslogd.8syslogd.9syslogd.cur226 Transfer complete.ftp> bin200 Type set to I.ftp> get syslogd.1200 PORT command successful.150 Opening BINARY mode data connection for syslogd.1 (607317 bytes).226 Transfer complete.607317 bytes received in 7.7 seconds (77 Kbytes/s)ftp>The following debug ftpserver command output indicates that no top-level directory is specified. Therefore, the client cannot access any location on the FTP server. Use the ftp-server topdir command to specify the top-level directory.
Mar 3 10:29:14: FTPSRV_DEBUG:(REPLY) 550Mar 3 10:29:14: FTPSRV_DEBUG:Access denied to 'disk0:'debug gatekeeper server
To trace all the message exchanges between the Cisco IOS Gatekeeper and the external applications, use the debug gatekeeper server command from EXEC mode. Enter the no form of this command to disable debugging output.
debug gatekeeper server
no debug gatekeeper server
Syntax Description
This command has no arguments or keywords.
Defaults
Disabled
Command Modes
EXEC
Command History
Usage Guidelines
Use this command to see information about a Gatekeeper server. This command shows any errors that occur in sending messages to the external applications or in parsing messages from the external applications.
Examples
The following example shows debugging information about a Gatekeeper server
Router# debug gatekeeper serversRouter# show debugGatekeeper:Gatekeeper Server Messages debugging is onTo turn the Gatekeeper server debugging message off, see the following examples:
Router# no debug allor
Router# no debug Gatekeeper serversRelated Commands
show gatekeeper server
Displays information about the Gatekeeper servers configured on your network by ID.
debug gprs charging
To display information about GPRS charging functions on the GGSN, use the debug gprs charging events command. To disable debugging output, use the no form of the command.
debug gprs charging {events | packets}
no debug gprs charging {events | packets}
Syntax Description
events
Displays events related to GPRS charging processing on the GGSN.
packets
Displays GPRS charging packets that are sent between the GGSN and the charging gateway.
Defaults
No default behavior or values.
Command History
12.1(1)GA
This command was introduced.
12.1(3)T
This command was integrated into Cisco IOS Release 12.1(3)T.
Usage Guidelines
This command is useful for system operators if problems are encountered with GPRS charging functions.
Caution
Examples
The following example enables the display of events related to GPRS charging events on the GGSN:
Router# debug gprs charging eventsThe following example enables the display of GPRS charging packets sent between the GGSN and the charging gateway:
Router# debug gprs charging eventsdebug gprs gtp
To display information about the GPRS Tunneling Protocol (GTP), use the debug gprs gtp command. To disable debugging output, use the no form of the command.
debug gprs gtp {events | messages | packets}
no debug gprs gtp {events | messages | packets}
Syntax Description
Defaults
No default behavior or values.
Command History
12.1(1)GA
This command was introduced.
12.1(3)T
This command was integrated in Cisco IOS Release 12.1(3)T.
Usage Guidelines
This command is useful for system operators and development engineers if problems are encountered with communication between the GGSN and the SGSN using GTP.
Caution
Examples
The following example enables the display of events related to GTP processing on the GGSN:
Router# debug gprs gtp eventsThe following example enables the display of GTP signalling messages:
Router# debug gprs gtp messagesThe following example enables the display of GTP packets sent between the SGSN and GGSN:
Router# debug gprs gtp packetsdebug h225
To display additional information about the actual contents of H.225 RAS messages, use the debug h225 privileged EXEC command. Use the no form of this command to disable debugging output.
debug h225 {asn1 | events}
no debug h225 {asn1 | events}
Syntax Description
Command History
Usage Guidelines
Both versions of the debug H225 command display information about H.225 messages. H.225 messages are used to exchange RAS information between gateways and gatekeepers and to exchange Q.931 information between gateways.
The debug h225 events command displays key Q.931 events that occur when placing an H.323 call from one gateway to another. Q.931 events are carried in H.225 messages. This command enables you to monitor Q.931 state changes such as setup, alert, connected, and released.
Note
The debug h225 asn1 command displays the ASN.1 contents of any H.225 message sent or received that contains ASN.1 content. Not all H.225 messages contain ASN.1 content. Some messages contain both Q.931 information and ASN.1 information; if you enter this command, only ASN.1 information will be displayed.
Examples
The following sample display for the debug h225 events command shows a call being placed from gateway GW13 to gateway GW14. Before the call was placed, the gateway exchanged RAS messages with the Gatekeeper. Because RAS messages do not contain Q.931 information, these messages do not appear in this output.
Router# debug h225 eventsH.225 Event Messages debugging is onRouter#*Mar 2 02:47:14.689: H225Lib::h225TConn:connect in progress on socket [2]*Mar 2 02:47:14.689: H225Lib::h225TConn:Q.931 Call State is initialized to be [Null].*Mar 2 02:47:14.697:Hex representation of the SETUP TPKT to send.0300004D080200DC05040380C0A36C0991313323313333303070099131342331343330307E00260500800 60008914A000102004B1F5E5D8990006C0000000005BF7454000C0700000000000000*Mar 2 02:47:14.701:*Mar 2 02:47:14.701: H225Lib::h225SetupRequest:Q.931 SETUP sent from socket [2]*Mar 2 02:47:14.701: H225Lib::h225SetupRequest:Q.931 Call State changed to [Call Initiated].*Mar 2 02:47:14.729:Hex representation of the received TPKT03000021080280DC013401017E0012050340060008914A000100000109350E2B28*Mar 2 02:47:14.729:*Mar 2 02:47:14.729: H225Lib::h225RecvData:Q.931 ALERTING received from socket [2]*Mar 2 02:47:14.729: H225Lib::h225RecvData:Q.931 Call State changed to [Call Delivered].*Mar 2 02:47:17.565:Hex representation of the received TPKT03000034080280DC07040380C0A37E0023050240060008914A0001000109350E2B2802004B1F5E5D899000 6C0000000005BF7454*Mar 2 02:47:17.569:*Mar 2 02:47:17.569: H225Lib::h225RecvData:Q.931 CONNECT received from socket [2]*Mar 2 02:47:17.569: H225Lib::h225RecvData:Q.931 Call State changed to [Active].*Mar 2 02:47:23.273:Hex representation of the received TPKT0300001A080280DC5A080280107E000A050500060008914A0001*Mar 2 02:47:23.273:*Mar 2 02:47:23.273: H225Lib::h225RecvData:Q.931 RELEASE COMPLETE received from socket [2]*Mar 2 02:47:23.273: H225Lib::h225RecvData:Q.931 Call State changed to [Null].*Mar 2 02:47:23.293:Hex representation of the RELEASE COMPLETE TPKT to send.0300001A080200DC5A080280107E000A050500060008914A0001*Mar 2 02:47:23.293:*Mar 2 02:47:23.293: H225Lib::h225TerminateRequest:Q.931 RELEASE COMPLETE sent from socket [2]. Call state changed to [Null].*Mar 2 02:47:23.293: H225Lib::h225TClose:TCP connection from socket [2] closedThe following output shows the same call being placed from gateway GW13 to gateway GW14 using the debug h225 asn1 command. The output is very long but you can track the following information:
•
•
•
•
•
•
•
•
•
Router# debug h225 asn1H.225 ASN1 Messages debugging is onRouter#value RasMessage ::= admissionRequest :*Mar 2 02:48:18.445: {*Mar 2 02:48:18.445: requestSeqNum 03320,*Mar 2 02:48:18.445: callType pointToPoint :NULL,*Mar 2 02:48:18.445: callModel direct :NULL,*Mar 2 02:48:18.445: endpointIdentifier "60D6BA4C00000001",*Mar 2 02:48:18.445: destinationInfo*Mar 2 02:48:18.445: {*Mar 2 02:48:18.445: e164 :"14#14300"*Mar 2 02:48:18.445: },*Mar 2 02:48:18.449: srcInfo*Mar 2 02:48:18.449: {*Mar 2 02:48:18.449: e164 :"13#13300"*Mar 2 02:48:18.449: },*Mar 2 02:48:18.449: bandWidth 0640,*Mar 2 02:48:18.449: callReferenceValue 0224,*Mar 2 02:48:18.449: conferenceID '4B1F5E5D899000720000000005C067A4'H,*Mar 2 02:48:18.449: activeMC FALSE,*Mar 2 02:48:18.449: answerCall FALSE*Mar 2 02:48:18.449: }*Mar 2 02:48:18.449:25800CF7 00F00036 00300044 00360042 00410034 00430030 00300030 0030003000300030 00310103 80470476 33010380 46046633 40028000 E04B1F5E 5D89900072000000 0005C067 A40029000CF7 40028000 0109350E 06B80077value RasMessage ::= admissionConfirm :*Mar 2 02:48:18.469: {*Mar 2 02:48:18.469: requestSeqNum 03320,*Mar 2 02:48:18.469: bandWidth 0640,*Mar 2 02:48:18.469: callModel direct :NULL,*Mar 2 02:48:18.469: destCallSignalAddress ipAddress :*Mar 2 02:48:18.469: {*Mar 2 02:48:18.469: ip '0109350E'H,*Mar 2 02:48:18.469: port 01720*Mar 2 02:48:18.469: },*Mar 2 02:48:18.469: irrFrequency 0120*Mar 2 02:48:18.473: }*Mar 2 02:48:18.473:value H323-UserInformation ::=*Mar 2 02:48:18.481:{*Mar 2 02:48:18.481: h323-uu-pdu*Mar 2 02:48:18.481: {*Mar 2 02:48:18.481: h323-message-body setup :*Mar 2 02:48:18.481: {*Mar 2 02:48:18.481: protocolIdentifier { 0 0 8 2250 0 1 },*Mar 2 02:48:18.481: sourceInfo*Mar 2 02:48:18.481: {*Mar 2 02:48:18.481: terminal*Mar 2 02:48:18.481: {*Mar 2 02:48:18.481: },*Mar 2 02:48:18.481: mc FALSE,*Mar 2 02:48:18.481: undefinedNode FALSE*Mar 2 02:48:18.481: },*Mar 2 02:48:18.481: activeMC FALSE,*Mar 2 02:48:18.481: conferenceID '4B1F5E5D899000720000000005C067A4'H,*Mar 2 02:48:18.481: conferenceGoal create :NULL,*Mar 2 02:48:18.485: callType pointToPoint :NULL,*Mar 2 02:48:18.485: sourceCallSignalAddress ipAddress :*Mar 2 02:48:18.485: {*Mar 2 02:48:18.485: ip '00000000'H,*Mar 2 02:48:18.485: port 00*Mar 2 02:48:18.485: }*Mar 2 02:48:18.485: }*Mar 2 02:48:18.485: }*Mar 2 02:48:18.485:}*Mar 2 02:48:18.485:00800600 08914A00 0102004B 1F5E5D89 90007200 00000005 C067A400 0C07000000000000 00value H323-UserInformation ::=*Mar 2 02:48:18.525:{*Mar 2 02:48:18.525: h323-uu-pdu*Mar 2 02:48:18.525: {*Mar 2 02:48:18.525: h323-message-body alerting :*Mar 2 02:48:18.525: {*Mar 2 02:48:18.525: protocolIdentifier { 0 0 8 2250 0 1 },*Mar 2 02:48:18.525: destinationInfo*Mar 2 02:48:18.525: {*Mar 2 02:48:18.525: mc FALSE,*Mar 2 02:48:18.525: undefinedNode FALSE*Mar 2 02:48:18.525: },*Mar 2 02:48:18.525: h245Address ipAddress :*Mar 2 02:48:18.525: {*Mar 2 02:48:18.525: ip '0109350E'H,*Mar 2 02:48:18.525: port 011050*Mar 2 02:48:18.525: }*Mar 2 02:48:18.525: }*Mar 2 02:48:18.525: }*Mar 2 02:48:18.525:}*Mar 2 02:48:18.525:value H323-UserInformation ::=*Mar 2 02:48:22.753:{*Mar 2 02:48:22.753: h323-uu-pdu*Mar 2 02:48:22.753: {*Mar 2 02:48:22.753: h323-message-body connect :*Mar 2 02:48:22.753: {*Mar 2 02:48:22.753: protocolIdentifier { 0 0 8 2250 0 1 },*Mar 2 02:48:22.753: h245Address ipAddress :*Mar 2 02:48:22.753: {*Mar 2 02:48:22.753: ip '0109350E'H,*Mar 2 02:48:22.753: port 011050*Mar 2 02:48:22.753: },*Mar 2 02:48:22.753: destinationInfo*Mar 2 02:48:22.753: {*Mar 2 02:48:22.753: terminal*Mar 2 02:48:22.753: {*Mar 2 02:48:22.753: },*Mar 2 02:48:22.757: mc FALSE,*Mar 2 02:48:22.757: undefinedNode FALSE*Mar 2 02:48:22.757: },*Mar 2 02:48:22.757: conferenceID '4B1F5E5D899000720000000005C067A4'H*Mar 2 02:48:22.757: }*Mar 2 02:48:22.757: }*Mar 2 02:48:22.757:}*Mar 2 02:48:22.757:value H323-UserInformation ::=*Mar 2 02:48:27.109:{*Mar 2 02:48:27.109: h323-uu-pdu*Mar 2 02:48:27.109: {*Mar 2 02:48:27.109: h323-message-body releaseComplete :*Mar 2 02:48:27.109: {*Mar 2 02:48:27.109: protocolIdentifier { 0 0 8 2250 0 1 }*Mar 2 02:48:27.109: }*Mar 2 02:48:27.109: }*Mar 2 02:48:27.109:}*Mar 2 02:48:27.109:value RasMessage ::= disengageRequest :*Mar 2 02:48:27.117: {*Mar 2 02:48:27.117: requestSeqNum 03321,*Mar 2 02:48:27.117: endpointIdentifier "60D6BA4C00000001",*Mar 2 02:48:27.117: conferenceID '4B1F5E5D899000720000000005C067A4'H,*Mar 2 02:48:27.121: callReferenceValue 0224,*Mar 2 02:48:27.121: disengageReason normalDrop :NULL*Mar 2 02:48:27.121: }*Mar 2 02:48:27.121:3C0CF81E 00360030 00440036 00420041 00340043 00300030 00300030 0030003000300031 4B1F5E5D 89900072 00000000 05C067A4 00E020400CF8value RasMessage ::= disengageConfirm :*Mar 2 02:48:27.133: {*Mar 2 02:48:27.133: requestSeqNum 03321*Mar 2 02:48:27.133: }*Mar 2 02:48:27.133:value H323-UserInformation ::=*Mar 2 02:48:27.133:{*Mar 2 02:48:27.133: h323-uu-pdu*Mar 2 02:48:27.133: {*Mar 2 02:48:27.133: h323-message-body releaseComplete :*Mar 2 02:48:27.133: {*Mar 2 02:48:27.133: protocolIdentifier { 0 0 8 2250 0 1 }*Mar 2 02:48:27.133: }*Mar 2 02:48:27.133: }*Mar 2 02:48:27.133:}*Mar 2 02:48:27.133:05000600 08914A00 01.debug h225 asn1
To display ASN1 contents of RAS and Q.931 messages, use the debug h255 asn1 privileged EXEC command. The no form of this command disables debugging output.
debug h255 asn1
no debug h255 asn1
Syntax Description
This command has no arguments or keywords.
Command History
Usage Guidelines
Caution
Examples
Example 1
The following output shows two proxy call scenarios. A trace is collected on the gatekeeper with ASN1 turned on. The call is being established.
Router# debug h225 asn1H.225 ASN1 Messages debugging is onRouter#24800006 03C00030 00300036 00380041 00450037 00430030 00300030 0030003000300030 00310140 0F007000 74006500 6C003200 33004000 7A006F00 6E00650032002E00 63006F00 6D020180 AAAA4006 00700074 0065006C 00320031 0033401E0000015F C8490FB4 B9D111BF AF0060B0 00E94500value RasMessage ::= admissionRequest :{requestSeqNum 7,callType pointToPoint : NULL,endpointIdentifier "0068AE7C00000001",destinationInfo{h323-ID : "ptel23@zone2.com"},srcInfo{e164 : "7777",h323-ID : "ptel213"},bandWidth 7680,callReferenceValue 1,conferenceID '5FC8490FB4B9D111BFAF0060B000E945'H,activeMC FALSE,answerCall FALSE}value RasMessage ::= admissionConfirm :{requestSeqNum 7,bandWidth 7680,callModel direct : NULL,destCallSignalAddress ipAddress :{ip '65000001'H,port 1720},irrFrequency 30}29000006 401E0000 65000001 06B8001D2480001D 03C00030 00300036 00380041 00390036 00300030 00300030 0030003000300030 00320140 0F007000 74006500 6C003200 33004000 7A006F00 6E00650032002E00 63006F00 6D014006 00700074 0065006C 00320031 00334002 8000015FC8490FB4 B9D111BF AF0060B0 00E94540value RasMessage ::= admissionRequest :{requestSeqNum 30,callType pointToPoint : NULL,endpointIdentifier "0068A96000000002",destinationInfo{h323-ID : "ptel23@zone2.com"},srcInfo{h323-ID : "ptel213"},bandWidth 640,callReferenceValue 1,conferenceID '5FC8490FB4B9D111BFAF0060B000E945'H,activeMC FALSE,answerCall TRUE}value ACFnonStandardInfo ::={srcTerminalAlias{e164 : "7777",h323-ID : "ptel213"},dstTerminalAlias{h323-ID : "ptel23@zone2.com"},dstProxyAlias{h323-ID : "px2"},dstProxySignalAddress{ip '66000001'H,port 1720}}C00203AA AA800600 70007400 65006C00 32003100 3301800F 00700074 0065006C00320033 0040007A 006F006E 00650032 002E0063 006F006D 01800200 7000780032660000 0106B8value RasMessage ::= admissionConfirm :{requestSeqNum 30,bandWidth 7680,callModel direct : NULL,destCallSignalAddress ipAddress :{ip '66000001'H,port 1720},irrFrequency 30,nonStandardData{nonStandardIdentifier h221NonStandard :{t35CountryCode 181,t35Extension 0,manufacturerCode 18},data'C00203AAAA8006007000740065006C00320031003301800F007000740065006C003200 ...'H}}2980001D 401E0000 66000001 06B8001D 40B50000 1247C002 03AAAA80 0600700074006500 6C003200 31003301 800F0070 00740065 006C0032 00330040 007A006F006E0065 0032002E 0063006F 006D0180 02007000 78003266 00000106 B824C0001E 03C00030 00300036 00380041 00390036 00300030 00300030 0030003000300030 00320140 0F007000 74006500 6C003200 33004000 7A006F00 6E00650032002E00 63006F00 6D006600 000106B8 020180AA AA400600 70007400 65006C0032003100 33401E00 00435FC8 490FB4B9 D111BFAF 0060B000 E94500value RasMessage ::= admissionRequest :{requestSeqNum 31,callType pointToPoint : NULL,endpointIdentifier "0068A96000000002",destinationInfo{h323-ID : "ptel23@zone2.com"},destCallSignalAddress ipAddress :{ip '66000001'H,port 1720},srcInfo{e164 : "7777",h323-ID : "ptel213"},bandWidth 7680,callReferenceValue 67,conferenceID '5FC8490FB4B9D111BFAF0060B000E945'H,activeMC FALSE,answerCall FALSE}value RasMessage ::= admissionConfirm :{requestSeqNum 31,bandWidth 7680,callModel direct : NULL,destCallSignalAddress ipAddress :{ip '66000001'H,port 1720},irrFrequency 30}Example 2
The following output shows two proxy call scenarios. A trace is collected on the source proxy with ASN1 turned on. The call is being torn down
Router# debug h225 asn1H.225 ASN1 Messages debugging is onRouter#value H323-UserInformation ::={h323-uu-pdu{h323-message-body setup :{protocolIdentifier { 0 0 8 2250 0 1 },sourceAddress{h323-ID : "ptel213"},sourceInfo{terminal{},mc FALSE,undefinedNode FALSE},destinationAddress{h323-ID : "ptel23@zone2.com"},activeMC FALSE,conferenceID '5FC8490FB4B9D111BFAF0060B000E945'H,conferenceGoal create : NULL,callType pointToPoint : NULL,sourceCallSignalAddress ipAddress :{ip '3200000C'H,port 1720}}}}value RasMessage ::= admissionRequest :{requestSeqNum 30,callType pointToPoint : NULL,endpointIdentifier "0068A96000000002",destinationInfo{h323-ID : "ptel23@zone2.com"},srcInfo{h323-ID : "ptel213"},bandWidth 640,callReferenceValue 1,conferenceID '5FC8490FB4B9D111BFAF0060B000E945'H,activeMC FALSE,answerCall TRUE}2480001D 03C00030 00300036 00380041 00390036 00300030 00300030 0030003000300030 00320140 0F007000 74006500 6C003200 33004000 7A006F00 6E00650032002E00 63006F00 6D014006 00700074 0065006C 00320031 00334002 8000015FC8490FB4 B9D111BF AF0060B0 00E945402980001D 401E0000 66000001 06B8001D 40B50000 1247C002 03AAAA80 0600700074006500 6C003200 31003301 800F0070 00740065 006C0032 00330040 007A006F006E0065 0032002E 0063006F 006D0180 02007000 78003266 00000106 B8value RasMessage ::= admissionConfirm :{requestSeqNum 30,bandWidth 7680,callModel direct : NULL,destCallSignalAddress ipAddress :{ip '66000001'H,port 1720},irrFrequency 30,nonStandardData{nonStandardIdentifier h221NonStandard :{t35CountryCode 181,t35Extension 0,manufacturerCode 18},data'C00203AAAA8006007000740065006C00320031003301800F007000740065006C003200 ...'H}}C00203AA AA800600 70007400 65006C00 32003100 3301800F 00700074 0065006C00320033 0040007A 006F006E 00650032 002E0063 006F006D 01800200 7000780032660000 0106B8value ACFnonStandardInfo ::={srcTerminalAlias{e164 : "7777",h323-ID : "ptel213"},dstTerminalAlias{h323-ID : "ptel23@zone2.com"},dstProxyAlias{h323-ID : "px2"},dstProxySignalAddress{ip '66000001'H,port 1720}}value RasMessage ::= admissionRequest :{requestSeqNum 31,callType pointToPoint : NULL,endpointIdentifier "0068A96000000002",destinationInfo{h323-ID : "ptel23@zone2.com"},destCallSignalAddress ipAddress :{ip '66000001'H,port 1720},srcInfo{e164 : "7777",h323-ID : "ptel213"},bandWidth 7680,callReferenceValue 67,conferenceID '5FC8490FB4B9D111BFAF0060B000E945'H,activeMC FALSE,answerCall FALSE}24C0001E 03C00030 00300036 00380041 00390036 00300030 00300030 0030003000300030 00320140 0F007000 74006500 6C003200 33004000 7A006F00 6E00650032002E00 63006F00 6D006600 000106B8 020180AA AA400600 70007400 65006C0032003100 33401E00 00435FC8 490FB4B9 D111BFAF 0060B000 E945002900001E 401E0000 66000001 06B8001Dvalue RasMessage ::= admissionConfirm :{requestSeqNum 31,bandWidth 7680,callModel direct : NULL,destCallSignalAddress ipAddress :{ip '66000001'H,port 1720},irrFrequency 30}value H323-UserInformation ::={h323-uu-pdu{h323-message-body callProceeding :{protocolIdentifier { 0 0 8 2250 0 1 },destinationInfo{gateway{protocol{h323 :{}}},mc FALSE,undefinedNode FALSE}}}}01000600 08914A00 01088001 2800value H323-UserInformation ::={h323-uu-pdu{h323-message-body setup :{protocolIdentifier { 0 0 8 2250 0 1 },sourceAddress{h323-ID : "ptel213"},sourceInfo{vendor{vendor{t35CountryCode 181,t35Extension 0,manufacturerCode 18}},gateway{protocol{h323 :{}}},mc FALSE,undefinedNode FALSE},destinationAddress{h323-ID : "ptel23@zone2.com"},destCallSignalAddress ipAddress :{ip '66000001'H,port 1720},activeMC FALSE,conferenceID '5FC8490FB4B9D111BFAF0060B000E945'H,conferenceGoal create : NULL,callType pointToPoint : NULL,sourceCallSignalAddress ipAddress :{ip '65000001'H,port 1720},remoteExtensionAddress h323-ID : "ptel23@zone2.com"}}}00B80600 08914A00 01014006 00700074 0065006C 00320031 00332800 B500001240012800 01400F00 70007400 65006C00 32003300 40007A00 6F006E00 650032002E006300 6F006D00 66000001 06B8005F C8490FB4 B9D111BF AF0060B0 00E945000E070065 00000106 B822400F 00700074 0065006C 00320033 0040007A 006F006E00650032 002E0063 006F006Dvalue H323-UserInformation ::={h323-uu-pdu{h323-message-body callProceeding :{protocolIdentifier { 0 0 8 2250 0 1 },destinationInfo{gateway{protocol{h323 :{}}},mc FALSE,undefinedNode FALSE}}}}value H323-UserInformation ::={h323-uu-pdu{h323-message-body alerting :{protocolIdentifier { 0 0 8 2250 0 1 },destinationInfo{mc FALSE,undefinedNode FALSE}}}}value H323-UserInformation ::={h323-uu-pdu{h323-message-body alerting :{protocolIdentifier { 0 0 8 2250 0 1 },destinationInfo{mc FALSE,undefinedNode FALSE}}}}03000600 08914A00 010000value H323-UserInformation ::={h323-uu-pdu{h323-message-body connect :{protocolIdentifier { 0 0 8 2250 0 1 },h245Address ipAddress :{ip '66000001'H,port 11011},destinationInfo{gateway{protocol{h323 :{}}},mc FALSE,undefinedNode FALSE},conferenceID '5FC8490FB4B9D111BFAF0060B000E945'H}}}value H323-UserInformation ::={h323-uu-pdu{h323-message-body connect :{protocolIdentifier { 0 0 8 2250 0 1 },h245Address ipAddress :{ip '65000001'H,port 11007},destinationInfo{gateway{protocol{h323 :{}}},mc FALSE,undefinedNode FALSE},conferenceID '5FC8490FB4B9D111BFAF0060B000E945'H}}}02400600 08914A00 01006500 00012AFF 08800128 005FC849 0FB4B9D1 11BFAF0060B000E9 45Example 3
The following output shows two proxy call scenarios. A trace is collected on a destination router where both destination proxy and destination Gatekeeper coexist. Both RAS and H.225 traces are enabled for one complete call.
px2#RASLib::RASRecvData: successfully rcvd message of length 80 from 40.0.0.33:1585RASLib::RASRecvData: LRQ rcvd from [40.0.0.33:1585] on sock [6880372]RASlib::ras_sendto: msg length 111 sent to 40.0.0.33RASLib::RASSendLCF: LCF sent to 40.0.0.33H225Lib::h225TAccept: TCP connection accepted from 101.0.0.1:11002 onsocket [2]H225Lib::h225TAccept: Q.931 Call State is initialized to be [Null].Hex representation of the received TPKT030000A60802008005040488988CA56C0591373737377E008D0500B8060008914A0001014006007000740065006C0032003100332800B50000124001280001400F007000740065006C003200330040007A006F006E00650032002E0063006F006D006600000106B8003DC8490FB4B9D111BFAF0060B000E945000E07006500000106B822400F007000740065006C003200330040007A006F006E00650032002E0063006F006DH225Lib::h225RecvData: Q.931 SETUP received from socket [2]H225Lib::h225RecvData: State changed to [Call Present].RASlib::ras_sendto: msg length 119 sent to 102.0.0.1RASLib::RASSendARQ: ARQ sent to 102.0.0.1RASLib::RASRecvData: successfully rcvd message of length 119 from 102.0.0.1:24999RASLib::RASRecvData: ARQ rcvd from [102.0.0.1:24999] on sock [0x68FC74]RASlib::ras_sendto: msg length 16 sent to 70.0.0.31RASLib::RASSendACF: ACF sent to 70.0.0.31RASLib::RASRecvData: successfully rcvd message of length 16 from 102.0.0.1:1719RASLib::RASRecvData: ACF rcvd from [102.0.0.1:1719] on sock [0x67E6A4]RASlib::ras_sendto: msg length 119 sent to 102.0.0.1RASLib::RASSendARQ: ARQ sent to 102.0.0.1RASLib::RASRecvData: successfully rcvd message of length 119 from 102.0.0.1:24999RASLib::RASRecvData: ARQ rcvd from [102.0.0.1:24999] on sock [0x68FC74]RASlib::ras_sendto: msg length 16 sent to 70.0.0.31RASLib::RASSendACF: ACF sent to 70.0.0.31RASLib::RASRecvData: successfully rcvd message of length 16 from 102.0.0.1:1719RASLib::RASRecvData: ACF rcvd from [102.0.0.1:1719] on sock [0x67E6A4]Hex representation of the CALL PROCEEDING TPKT to send.0300001B08028080027E000F050100060008914A00010880012800H225Lib::h225CallProcRequest: Q.931 CALL PROCEEDING sent from socket[2]. Call state remains unchanged (Q.931 FSM simplified for H.225.0)H225Lib::h225TConn: connect in progress on socket [4]H225Lib::h225TConn: Q.931 Call State is initialized to be [Null].Hex representation of the SETUP TPKT to send.030000A50802008005040388C0A56C0591373737377E008D0500B8060008914A0001014006007000740065006C0032003100332800B50000124001280001400F007000740065006C003200330040007A006F006E00650032002E0063006F006D005A00000D06B8003DC8490FB4B9D111BFAF0060B000E945000E07006600000106B822400F007000740065006C003200330040007A006F006E00650032002E0063006F006DH225Lib::h225SetupRequest: Q.931 SETUP sent from socket [4]H225Lib::h225SetupRequest: Q.931 Call State changed to [Call Initiated].RASLib::RASRecvData: successfully rcvd message of length 123 from 90.0.0.13:1700RASLib::RASRecvData: ARQ rcvd from [90.0.0.13:1700] on sock [0x68FC74]RASlib::ras_sendto: msg length 16 sent to 90.0.0.13RASLib::RASSendACF: ACF sent to 90.0.0.13Hex representation of the received TPKT0300001808028080027E000C050100060008914A00010200H225Lib::h225RecvData: Q.931 CALL PROCEEDING received from socket [4]Hex representation of the received TPKT0300001808028080017E000C050300060008914A00010200H225Lib::h225RecvData: Q.931 ALERTING received from socket [4]H225Lib::h225RecvData: Q.931 Call State changed to [Call Delivered].Hex representation of the ALERTING TPKT to send.0300001808028080017E000C050300060008914A00010000H225Lib::h225AlertRequest: Q.931 ALERTING sent from socket [2]. Callstate changed to [Call Received].Hex representation of the received TPKT0300003508028080070404889886A57E0023050240060008914A0001005A00000D06A402003DC8490FB4B9D111BFAF0060B000E945H225Lib::h225RecvData: Q.931 CONNECT received from socket [4]H225Lib::h225RecvData: Q.931 Call State changed to [Active].Hex representation of the CONNECT TPKT to send.030000370802808007040388C0A57E0026050240060008914A000100660000012AFC08800128003DC8490FB4B9D111BFAF0060B000E945H225Lib::h225SetupResponse: Q.931 CONNECT sent from socket [2]H225Lib::h225SetupResponse: Q.931 Call State changed to [Active].RASlib::ras_sendto: msg length 108 sent to 102.0.0.1RASLib::RASSendIRR: IRR sent to 102.0.0.1RASLib::RASRecvData: successfully rcvd message of length 108 from 102.0.0.1:24999RASLib::RASRecvData: IRR rcvd from [102.0.0.1:24999] on sock [0x68FC74]RASLib::RASRecvData: successfully rcvd message of length 101 from 90.0.0.13:1700RASLib::RASRecvData: IRR rcvd from [90.0.0.13:1700] on sock [0x68FC74]Hex representation of the received TPKT0300001A080280805A080280107E000A050500060008914A0001H225Lib::h225RecvData: Q.931 RELEASE COMPLETE received from socket [2]H225Lib::h225RecvData: Q.931 Call State changed to [Null].RASlib::ras_sendto: msg length 55 sent to 102.0.0.1RASLib::RASSendDRQ: DRQ sent to 102.0.0.1H225Lib::h225RecvData: no connection on socket [2]RASLib::RASRecvData: successfully rcvd message of length 55 from 102.0.0.1:24999RASLib::RASRecvData: DRQ rcvd from [102.0.0.1:24999] on sock [0x68FC74]RASlib::ras_sendto: msg length 3 sent to 70.0.0.31RASLib::RASSendDCF: DCF sent to 70.0.0.31Hex representation of the RELEASE COMPLETE TPKT to send.0300001A080280805A080280107E000A050500060008914A0001H225Lib::h225TerminateRequest: Q.931 RELEASE COMPLETE sent from socket [2]. Call state changed to [Null].H225Lib::h225TClose: TCP connection from socket [2] closedRASlib::ras_sendto: msg length 55 sent to 102.0.0.1RASLib::RASSendDRQ: DRQ sent to 102.0.0.1RASLib::RASRecvData: successfully rcvd message of length 3 from 102.0.0.1:1719RASLib::RASRecvData: DCF rcvd from [102.0.0.1:1719] on sock [0x67E6A4]RASLib::RASRecvData: successfully rcvd message of length 55 from 102.0.0.1:24999RASLib::RASRecvData: DRQ rcvd from [102.0.0.1:24999] on sock [0x68FC74]RASlib::ras_sendto: msg length 3 sent to 70.0.0.31RASLib::RASSendDCF: DCF sent to 70.0.0.31RASLib::RASRecvData: successfully rcvd message of length 3 from 102.0.0.1:1719RASLib::RASRecvData: DCF rcvd from [102.0.0.1:1719] on sock [0x67E6A4]Hex representation of the RELEASE COMPLETE TPKT to send.0300001A080280805A080280107E000A050500060008914A0001H225Lib::h225TerminateRequest: Q.931 RELEASE COMPLETE sent from socket [4]. Call state changed to [Null].H225Lib::h225TClose: TCP connection from socket [4] closedRASLib::RASRecvData: successfully rcvd message of length 55 from 90.0.0.13:1700RASLib::RASRecvData: DRQ rcvd from [90.0.0.13:1700] on sock [0x68FC74]RASlib::ras_sendto: msg length 3 sent to 90.0.0.13RASLib::RASSendDCF: DCF sent to 90.0.0.13debug h225 events
To display Q.931 events, use the debug h225 events privileged EXEC command. The no form of this command disables debugging output.
debug h225 events
no debug h255 events
Syntax Description
This command has no arguments or keywords.
Command History
Examples
The following are sample output from the debug h225 events command.
Example 1
The following output shows two proxy call scenarios. A trace is collected on the source proxy with H.225 turned on. The call is being established.
Router# debug h225 eventsH.225 Event Messages debugging is onRouter# H225Lib::h225TAccept: TCP connection accepted from 50.0.0.12:1701 onsocket [2]H225Lib::h225TAccept: Q.931 Call State is initialized to be [Null].Hex representation of the received TPKT0300007408020001050404889886A56C0580373737377E005B0500B0060008914A0001014006007000740065006C003200310033020001400F007000740065006C003200330040007A006F006E00650032002E0063006F006D004EC8490FB4B9D111BFAF0060B000E945000C07003200000C06B8H225Lib::h225RecvData: Q.931 SETUP received from socket [2]H225Lib::h225RecvData: State changed to [Call Present].Hex representation of the CALL PROCEEDING TPKT to send.0300001B08028001027E000F050100060008914A00010880012800H225Lib::h225CallProcRequest: Q.931 CALL PROCEEDING sent from socket[2]. Call state remains unchanged (Q.931 FSM simplified for H.225.0)H225Lib::h225TConn: connect in progress on socket [4]H225Lib::h225TConn: Q.931 Call State is initialized to be [Null].Hex representation of the SETUP TPKT to send.030000A60802008405040488988CA56C0591373737377E008D0500B8060008914A0001014006007000740065006C0032003100332800B50000124001280001400F007000740065006C003200330040007A006F006E00650032002E0063006F006D006600000106B8004EC8490FB4B9D111BFAF0060B000E945000E07006500000106B822400F007000740065006C003200330040007A006F006E00650032002E0063006F006DH225Lib::h225SetupRequest: Q.931 SETUP sent from socket [4]H225Lib::h225SetupRequest: Q.931 Call State changed to [Call Initiated].Hex representation of the received TPKT0300001B08028084027E000F050100060008914A00010880012800H225Lib::h225RecvData: Q.931 CALL PROCEEDING received from socket [4]Hex representation of the received TPKT0300001808028084017E000C050300060008914A00010000H225Lib::h225RecvData: Q.931 ALERTING received from socket [4]H225Lib::h225RecvData: Q.931 Call State changed to [Call Delivered].Hex representation of the ALERTING TPKT to send.0300001808028001017E000C050300060008914A00010000H225Lib::h225AlertRequest: Q.931 ALERTING sent from socket [2]. Callstate changed to [Call Received].Hex representation of the received TPKT030000370802808407040388C0A57E0026050240060008914A000100660000012AFF08800128004EC8490FB4B9D111BFAF0060B000E945H225Lib::h225RecvData: Q.931 CONNECT received from socket [4]H225Lib::h225RecvData: Q.931 Call State changed to [Active].Hex representation of the CONNECT TPKT to send.0300003808028001070404889886A57E0026050240060008914A000100650000012AFC08800128004EC8490FB4B9D111BFAF0060B000E945H225Lib::h225SetupResponse: Q.931 CONNECT sent from socket [2]H225Lib::h225SetupResponse: Q.931 Call State changed to [Active].Example 2
The following output shows two proxy call scenarios. A trace is collected on the source proxy with H.225 turned on. The call is being torn down.
Router# debug h225 eventsH.225 Event Messages debugging is onRouter#Hex representation of the received TPKT0300001A080200015A080200907E000A050500060008914A0001H225Lib::h225RecvData: Q.931 RELEASE COMPLETE received from socket [2]H225Lib::h225RecvData: Q.931 Call State changed to [Null].H225Lib::h225RecvData: no connection on socket [2]Hex representation of the RELEASE COMPLETE TPKT to send.0300001A080280015A080280107E000A050500060008914A0001H225Lib::h225TerminateRequest: Q.931 RELEASE COMPLETE sent from socket [2]. Call state changed to [Null].H225Lib::h225TClose: TCP connection from socket [2] closedHex representation of the RELEASE COMPLETE TPKT to send.0300001A080280845A080280107E000A050500060008914A0001H225Lib::h225TerminateRequest: Q.931 RELEASE COMPLETE sent from socket [4]. Call state changed to [Null].H225Lib::h225TClose: TCP connection from socket [4] closeddebug h245 asn1
To display ASN1 contents of H.245 messages, use the debug h245 asn1 privileged EXEC command. The no form of this command disables debugging output.
debug h245 asn1
no debug h245 asn1
Syntax Description
This command has no arguments or keywords.
Command History
Usage Guidelines
Caution
debug h245 events
To display H.245 events, use the debug h245 events privileged EXEC command. The no form of this command disables debugging output.
debug h245 events
no debug h245 events
Syntax Description
This command has no arguments or keywords.
Command History
debug ima
To display debug messages for IMA groups and links, enter the debug ima privileged EXEC command. Enter the no form of this command to disable debugging output.
debug ima
no debug ima
Syntax Description
This command has no arguments or keywords.
Defaults
Debugging for IMA groups is not enabled.
Command History
Examples
The following example shows output when you enter the debug ima command while adding two ATM links to an IMA group. Notice that the group has not yet been created with the interface atm slot/imagroup-number command, so the links are not activated yet as group members. However, the individual ATM links are deactivated.
Router# debug imaIMA network interface debugging is onRouter# config terminalEnter configuration commands, one per line. End with CNTL/Z.Router(config)# interface atm1/0Router(config-if)# ima-group 1Router(config-if)#01:35:08:IMA shutdown atm layer of link ATM1/001:35:08:ima_clear_atm_layer_if ATM1/001:35:08:IMA link ATM1/0 removed in firmware01:35:08:ima_release_channel:ATM1/0 released channel 0.01:35:08:Bring up ATM1/4 that had been waiting for a free channel.01:35:08:IMA:no shut the ATM interface.01:35:08:IMA allocate_channel:ATM1/4 using channel 0.01:35:08:IMA config_restart ATM1/401:35:08:IMA adding link 0 to Group ATM1/IMA1ATM1/0 is down waiting for IMA group 1 to be activated01:35:08:Link 0 was added to Group ATM1/IMA101:35:08:ATM1/0 is down waiting for IMA group 1 to be created.01:35:08:IMA send AIS on link ATM1/001:35:08:IMA Link up/down Alarm:port 0, new status 0x10, old_status 0x1.01:35:10:%LINK-3-UPDOWN:Interface ATM1/4, changed state to up01:35:10:%LINK-3-UPDOWN:Interface ATM1/0, changed state to down01:35:11:%LINEPROTO-5-UPDOWN:Line protocol on Interface ATM1/4, changed state to up01:35:11:%LINEPROTO-5-UPDOWN:Line protocol on Interface ATM1/0, changed state to downRouter(config-if)# int atm1/1Router(config-if)# ima-group 1Router(config-if)#01:37:19:IMA shutdown atm layer of link ATM1/101:37:19:ima_clear_atm_layer_if ATM1/101:37:19:IMA link ATM1/1 removed in firmware01:37:19:ima_release_channel:ATM1/1 released channel 1.01:37:19:Bring up ATM1/5 that had been waiting for a free channel.01:37:19:IMA:no shut the ATM interface.01:37:19:IMA allocate_channel:ATM1/5 using channel 1.01:37:19:IMA config_restart ATM1/501:37:19:IMA adding link 1 to Group ATM1/IMA1ATM1/1 is down waiting for IMA group 1 to be activated01:37:19:Link 1 was added to Group ATM1/IMA101:37:19:ATM1/1 is down waiting for IMA group 1 to be created.01:37:19:IMA send AIS on link ATM1/101:37:19:IMA Link up/down Alarm:port 1, new status 0x10, old_status 0x1.Router(config-if)#01:37:21:%LINK-3-UPDOWN:Interface ATM1/5, changed state to up01:37:21:%LINK-3-UPDOWN:Interface ATM1/1, changed state to down01:37:22:%LINEPROTO-5-UPDOWN:Line protocol on Interface ATM1/5, changed state to up01:37:22:%LINEPROTO-5-UPDOWN:Line protocol on Interface ATM1/1, changed state to downRelated Commands
debug ip auth-proxy
To display the authentication proxy configuration information on the router, use the debug ip auth-proxy command in privileged EXEC mode.
debug ip auth-proxy {ftp | function-trace | http | object-creation | object-deletion | tcp | telnet | timer}
Syntax Description
Command History
Usage Guidelines
Use the debug ip auth-proxy command to display authentication proxy activity. See the "Examples" section for more information about the debug options.
Note
Examples
The following examples illustrates the output of the debug ip auth-proxy command. In these examples, debugging is on for object creations, object deletions, HTTP, and TCP.
In this example, the client host at 192.168.201.1 is attempting to make an HTTP connection to the web server located at 192.168.21.1. The HTTP debugging information is on for the authentication proxy. The output shows that the router is setting up an authentication proxy entry for the login request:
00:11:10: AUTH-PROXY creates info:cliaddr - 192.168.21.1, cliport - 36583seraddr - 192.168.201.1, serport - 80ip-srcaddr 192.168.21.1pak-srcaddr 0.0.0.0Following a successful login attempt, the debugging information shows the authentication proxy entries created for the client. In this example, the client is authorized for SMTP (port 25), FTP data (port 20), FTP control (port 21), and Telnet (port 23) traffic. The dynamic ACL entries are included in the display.
00:11:25:AUTH_PROXY OBJ_CREATE:acl item 61AD60CC00:11:25:AUTH-PROXY OBJ_CREATE:create acl wrapper 6151C7C8 -- acl item 61AD60CC00:11:25:AUTH-PROXY Src 192.168.162.216 Port [0]00:11:25:AUTH-PROXY Dst 192.168.162.220 Port [25]00:11:25:AUTH_PROXY OBJ_CREATE:acl item 6151C90800:11:25:AUTH-PROXY OBJ_CREATE:create acl wrapper 6187A060 -- acl item 6151C90800:11:25:AUTH-PROXY Src 192.168.162.216 Port [0]00:11:25:AUTH-PROXY Dst 192.168.162.220 Port [20]00:11:25:AUTH_PROXY OBJ_CREATE:acl item 61A40B8800:11:25:AUTH-PROXY OBJ_CREATE:create acl wrapper 6187A0D4 -- acl item 61A40B8800:11:25:AUTH-PROXY Src 192.168.162.216 Port [0]00:11:25:AUTH-PROXY Dst 192.168.162.220 Port [21]00:11:25:AUTH_PROXY OBJ_CREATE:acl item 6187955000:11:25:AUTH-PROXY OBJ_CREATE:create acl wrapper 61879644 -- acl item 6187955000:11:25:AUTH-PROXY Src 192.168.162.216 Port [0]00:11:25:AUTH-PROXY Dst 192.168.162.220 Port [23]The next example shows the debug output following a clear ip auth-proxy cache command to clear the authentication entries from the router. The dynamic ACL entries are removed from the router.
00:12:36:AUTH-PROXY OBJ_DELETE:delete auth_proxy cache 61AD629800:12:36:AUTH-PROXY OBJ_DELETE:delete create acl wrapper 6151C7C8 -- acl item 61AD60CC00:12:36:AUTH-PROXY OBJ_DELETE:delete create acl wrapper 6187A060 -- acl item 6151C90800:12:36:AUTH-PROXY OBJ_DELETE:delete create acl wrapper 6187A0D4 -- acl item 61A40B8800:12:36:AUTH-PROXY OBJ_DELETE:delete create acl wrapper 61879644 -- acl item 61879550The following example shows the timer information for a dynamic ACL entry. All times are expressed in milliseconds. The first laststart is the time that the ACL entry is created relative to the startup time of the router. The lastref is the time of the last packet to hit the dynamic ACL relative to the startup time of the router. The exptime is the next expected expiration time for the dynamic ACL. The delta indicates the remaining time before the dynamic ACL expires. After the timer expires, the debugging information includes a message indicating that the ACL and associated authentication proxy information for the client have been removed.
00:19:51:first laststart 119111200:20:51:AUTH-PROXY:delta 54220 lastref 1245332 exptime 125111200:21:45:AUTH-PROXY:ACL and cache are removedRelated Commands
debug ip bgp
To display information related to processing BGPs, use the debug ip bgp privileged EXEC command. To disable the display of BGP information, use the no form of this command.
debug ip bgp [A.B.C.D. | dampening | events | in | keepalives | out | updates | vpnv4]
no debug ip bgp [A.B.C.D. | dampening | events | in | keepalives | out | updates | vpnv4]
Syntax Description
Command History
Examples
The following example displays the output from this command:
Router# debug ip bgp vpnv403:47:14:vpn:bgp_vpnv4_bnetinit:100:2:58.0.0.0/803:47:14:vpn:bnettable add:100:2:58.0.0.0 / 803:47:14:vpn:bestpath_hook route_tag_change for vpn2:58.0.0.0/255.0.0.0(ok)03:47:14:vpn:bgp_vpnv4_bnetinit:100:2:57.0.0.0/803:47:14:vpn:bnettable add:100:2:57.0.0.0 / 803:47:14:vpn:bestpath_hook route_tag_change for vpn2:57.0.0.0/255.0.0.0(ok)03:47:14:vpn:bgp_vpnv4_bnetinit:100:2:14.0.0.0/803:47:14:vpn:bnettable add:100:2:14.0.0.0 / 803:47:14:vpn:bestpath_hook route_tag_chacle ip bgp *nge for vpn2:14.0.0.0/255.0.0.0(ok)debug ip casa affinities
To display debug messages for affinities, use the debug ip casa affinities privileged EXEC command. Use the no form of the command to disable debugging.
debug ip casa affinities
no debug ip casa affinities
Syntax Description
This command has no arguments or keywords.
Defaults
Debugging for affinities is not enabled.
Command History
Examples
The following is output from the debug ip casa affinities command:
Router# debug ip casa affinities16:15:36:Adding fixed affinity:16:15:36: 10.10.1.1:54787 -> 10.10.10.10:23 proto = 616:15:36:Updating fixed affinity:16:15:36: 10.10.1.1:54787 -> 10.10.10.10:23 proto = 616:15:36: flags = 0x2, appl addr = 10.10.3.2, interest = 0x5/0x10016:15:36: int ip:port = 10.10.2.2:1638, sequence delta = 0/0/0/016:15:36:Adding fixed affinity:16:15:36: 10.10.10.10:23 -> 10.10.1.1:54787 proto = 616:15:36:Updating fixed affinity:16:15:36: 10.10.10.10:23 -> 10.10.1.1:54787 proto = 616:15:36: flags = 0x2, appl addr = 0.0.0.0, interest = 0x3/0x10416:15:36: int ip:port = 10.10.2.2:1638, sequence delta = 0/0/0/0Table 61 describes the significant fields shown in the display.
debug ip casa packets
To display debug messages for packets, use the debug ip casa packets privileged EXEC command. Use the no form of the command to disable debugging.
debug ip casa packets
no debug ip casa packets
Syntax Description
This command has no arguments or keywords.
Defaults
Debugging for packets is not enabled.
Command History
Examples
The following is output from the debug ip casa packets command:
Router# debug ip casa packets16:15:36:Routing CASA packet - TO_MGR:16:15:36: 10.10.1.1:55299 -> 10.10.10.10:23 proto = 616:15:36: Interest Addr:10.10.2.2 Port:163816:15:36:Routing CASA packet - FWD_PKT:16:15:36: 10.10.1.1:55299 -> 10.10.10.10:23 proto = 616:15:36: Fwd Addr:10.10.3.216:15:36:Routing CASA packet - TO_MGR:16:15:36: 10.10.10.10:23 -> 10.10.1.1:55299 proto = 616:15:36: Interest Addr:10.10.2.2 Port:163816:15:36:Routing CASA packet - FWD_PKT:16:15:36: 10.10.10.10:23 -> 10.10.1.1:55299 proto = 616:15:36: Fwd Addr:0.0.0.016:15:36:Routing CASA packet - TICKLE:16:15:36: 10.10.10.10:23 -> 10.10.1.1:55299 proto = 616:15:36: Interest Addr:10.10.2.2 Port:1638 Interest Mask:SYN16:15:36: Fwd Addr:0.0.0.016:15:36:Routing CASA packet - FWD_PKT:16:15:36: 10.10.1.1:55299 -> 10.10.10.10:23 proto = 616:15:36: Fwd Addr:10.10.3.2Table 62 describes the significant fields shown in the display.
debug ip casa wildcards
To display debug messages for wildcards, use the debug ip casa wildcards privileged EXEC command. Use the no form of this command to disable debugging.
debug ip casa wildcards
no debug ip casa wildcards
Syntax Description
This command has no arguments or keywords.
Defaults
Debugging for wildcards is not enabled.
Command History
Examples
The following is output from the debug ip casa wildcards command:
Router# debug ip casa wildcards16:13:23:Updating wildcard affinity:16:13:23: 10.10.10.10:0 -> 0.0.0.0:0 proto = 616:13:23: src mask = 255.255.255.255, dest mask = 0.0.0.016:13:23: no frag, not advertising16:13:23: flags = 0x0, appl addr = 0.0.0.0, interest = 0x8107/0x810416:13:23: int ip:port = 10.10.2.2:1638, sequence delta = 0/0/0/016:13:23:Updating wildcard affinity:16:13:23: 0.0.0.0:0 -> 10.10.10.10:0 proto = 616:13:23: src mask = 0.0.0.0, dest mask = 255.255.255.25516:13:23: no frag, advertising16:13:23: flags = 0x0, appl addr = 0.0.0.0, interest = 0x8107/0x810216:13:23 int ip:port = 10.10.2.2:1638, sequence delta = 0/0/0/0Table 63 describes the significant fields in the display.
.
debug ip cef
To troubleshoot various Cisco Express Forwarding (CEF) events, use the debug ip cef command in privileged EXEC mode. To disable debugging, use the no form of this command.
debug ip cef {drops [rpf [access-list]] [access-list] | receive [access-list] | events [access-list] | interface}
no debug ip cef {drops [rpf [access-list]] [access-list] | receive [access-list] | events [access-list] | interface}
Specific to IPC Records
debug ip cef {ipc | interface-ipc | prefix-ipc [access-list]}
no debug ip cef {ipc | interface-ipc | prefix-ipc [access-list]}
Syntax Description
Defaults
This command is disabled by default.
Command Modes
Privileged EXEC
Command History
11.2 GS
This command was introduced.
11.1 CC
Multiple platform support was added.
12.0(5)T
The rpf keyword was added.
Usage Guidelines
This command gathers additional information for the handling of CEF interface, IPC, or packet events.
Note
Examples
The following is sample output from the debug ip cef rpf command for a packet that is dropped when it fails the RPF check. IP address 172.17.249.252 is the source address and Ethernet 2/0/0 is the input interface:
Router# debug ip cef drops rpfIP CEF drops for RPF debugging is on00:42:02:CEF-Drop:Packet from 172.17.249.252 via Ethernet2/0/0 -- unicast rpf checkThe following is sample output for CEF packets that are not switched using information from the FIB table, but are received and sent to the next switching layer:
Router# debug ip cef receiveIP CEF received packets debugging is on00:47:52:CEF-receive:Receive packet for 9.1.104.13Table 64 describes the significant fields shown in the display.
debug ip cef accounting non-recursive
To troubleshoot Cisco Express Forwarding (CEF) accounting records, use the debug ip cef accounting non-recursive command in privileged EXEC mode. To disable debugging, use the no form of this command.
debug ip cef accounting non-recursive
no debug ip cef acounting non-recursive
Syntax Description
This command has no arguments or keywords.
Defaults
This command is disabled by default.
Command Modes
Privileged EXEC
Command History
Usage Guidelines
This command records accounting events for nonrecursive prefixes when the ip cef accounting non-recursive command is enabled in global configuration mode.
Examples
The following is sample output from the debug ip cef accounting non-recursive command.
Router# debug ip cef accounting non-recursive03:50:19:CEF-Acct:tmstats_binary:Beginning generation of tmstatsephemeral file (mode binary)03:50:19:CEF-Acct:snapshoting loadinfo 0x63FF200003:50:19:CEF-Acct:snapshoting loadinfo 0x63FF1EA003:50:19:CEF-Acct:snapshoting loadinfo 0x63FF17C003:50:19:CEF-Acct:snapshoting loadinfo 0x63FF1D4003:50:19:CEF-Acct:snapshoting loadinfo 0x63FF1A8003:50:19:CEF-Acct:snapshoting loadinfo 0x63FF074003:50:19:CEF-Acct:snapshoting loadinfo 0x63FF08A003:50:19:CEF-Acct:snapshoting loadinfo 0x63FF0B6003:50:19:CEF-Acct:snapshoting loadinfo 0x63FF0CC003:50:19:CEF-Acct:snapshoting loadinfo 0x63FF0F8003:50:19:CEF-Acct:snapshoting loadinfo 0x63FF10E003:50:19:CEF-Acct:snapshoting loadinfo 0x63FF124003:50:19:CEF-Acct:snapshoting loadinfo 0x63FF13A003:50:19:CEF-Acct:snapshoting loadinfo 0x63FF150003:50:19:CEF-Acct:snapshoting loadinfo 0x63FF192003:50:19:CEF-Acct:snapshoting loadinfo 0x63FF0E2003:50:19:CEF-Acct:snapshoting loadinfo 0x63FF166003:50:19:CEF-Acct:snapshoting loadinfo 0x63FF05E003:50:19:CEF-Acct:snapshoting loadinfo 0x63FF0A0003:50:19:CEF-Acct:snapshoting loadinfo 0x63FF1BE003:50:19:CEF-Acct:snapshoting loadinfo 0x63FF048003:50:19:CEF-Acct:tmstats_binary:aggregation complete, duration 0 seconds03:50:21:CEF-Acct:tmstats_binary:writing 45 bytes03:50:24:CEF-Acct:tmstats_binary:writing 45 bytes03:50:24:CEF-Acct:tmstats_binary:writing 45 bytes03:50:27:CEF-Acct:tmstats_binary:writing 45 bytes03:50:29:CEF-Acct:tmstats_binary:writing 45 bytes03:50:32:CEF-Acct:tmstats_binary:writing 45 bytes03:50:35:CEF-Acct:tmstats_binary:writing 45 bytes03:50:38:CEF-Acct:tmstats_binary:writing 45 bytes03:50:41:CEF-Acct:tmstats_binary:writing 45 bytes03:50:45:CEF-Acct:tmstats_binary:writing 45 bytes03:50:48:CEF-Acct:tmstats_binary:writing 45 bytes03:50:49:CEF-Acct:tmstats_binary:writing 45 bytes03:50:52:CEF-Acct:tmstats_binary:writing 45 bytes03:50:55:CEF-Acct:tmstats_binary:writing 45 bytes03:50:57:CEF-Acct:tmstats_binary:writing 45 bytes03:50:57:CEF-Acct:tmstats_binary:writing 45 bytes03:50:57:CEF-Acct:tmstats_binary:writing 45 bytes03:50:57:CEF-Acct:tmstats_binary:writing 45 bytes03:50:57:CEF-Acct:tmstats_binary:writing 45 bytes03:50:57:CEF-Acct:tmstats_binary:writing 45 bytes03:50:57:CEF-Acct:tmstats_binary:writing 45 bytes03:50:57:CEF-Acct:tmstats_binary:tmstats file written, status 0Table 65 describes the significant fields shown in the display.
debug ip cef fragmentation
To report fragmented IP packets when Cisco Express Forwarding (CEF) is enabled, use the debug ip cef fragmentation command in privileged EXEC mode. To disable debugging, use the no form of this command:
debug ip cef fragmentation
no debug ip cef fragmentation
Syntax Description
This command has no arguments or keywords.
Defaults
This command is disabled by default.
Command Modes
Privileged EXEC
Command History
12.0(14)S
This command was introduced.
12.2(2)T
This command was integrated into Cisco IOS Release 12.2(2)T.
Usage Guidelines
This command is used to troubleshoot fragmentation problems when CEF switching is enabled.
Examples
The following is sample output from the debug ip cef fragmentation command:
Router# debug ip cef fragmentation00:59:45:CEF-FRAG:no_fixup path:network_start 0x5397CF8E datagramstart 0x5397CF80 data_start 0x397CF80 data_block 0x397CF40 mtu 1000 datagramsize 1414 data_bytes 141400:59:45:CEF-FRAG:send frag:datagramstart 0x397CF80 datagramsize 442 data_bytes 44200:59:45:CEF-FRAG:send frag:datagramstart 0x38BC266 datagramsize 1006 data_bytes 100600:59:45:CEF-FRAG:no_fixup path:network_start 0x5397C60E datagramstart 0x5397C600 data_start 0x397C600 data_block 0x397C5C0 mtu 1000 datagramsize 1414 data_bytes 141400:59:45:CEF-FRAG:send frag:datagramstart 0x397C600 datagramsize 442 data_bytes 44200:59:45:CEF-FRAG:send frag:datagramstart 0x38BC266 datagramsize 1006 data_bytes 1006Table 66 describes the significant fields shown in the display.
debug ip cef hash
To record Cisco Express Forwarding (CEF) load sharing hash algorithm events, use the debug ip cef hash command in privileged EXEC mode. To disable debugging, use the no form of this command.
debug ip cef hash
no debug ip cef hash
Syntax Description
This command has no arguments or keywords.
Defaults
This command is disabled by default.
Command Modes
Privileged EXEC
Command History
12.0(12)S
This command was introduced.
12.1(5)T
This command was integrated into Cisco IOS Release 12.1(5)T.
Usage Guidelines
Use this command when changing the load sharing algorithm to view the hash table details.
Examples
The following is sample output from the debug ip cef hash command with IP CEF load algorithm tunnel information:
Router# debug ip cef hash01:15:06:%CEF:ip cef load-sharing algorithm tunnel 001:15:06:%CEF:Load balancing algorithm:tunnel01:15:06:%CEF:Load balancing unique id:1F2BA5F601:15:06:%CEF:Destroyed load sharing hash table01:15:06:%CEF:Sending hash algorithm id 2, unique id 1F2BA5F6 to slot 255The following lines showIP CEF load algorithm universal information:01:15:28:%CEF:ip cef load-sharing algorithm universal 001:15:28:%CEF:Load balancing algorithm:universal01:15:28:%CEF:Load balancing unique id:062063A401:15:28:%CEF:Creating load sharing hash table01:15:28:%CEF:Hash table columns for valid max_index:01:15:28:12: 9 7 7 4 4 10 0 7 10 4 5 0 4 7 8 401:15:28:15: 3 10 10 4 10 4 0 7 1 7 14 6 13 13 11 1301:15:28:16: 1 3 7 12 4 14 8 7 10 4 1 12 8 15 4 801:15:28:%CEF:Sending hash algorithm id 3, unique id 062063A4 to slot 255Table 67 describes the significant fields shown in the display.
debug ip cef rrhash
To record Cisco Express Forwarding (CEF) removal of receive hash events, use the debug ip cef rrhash command in privileged EXEC mode. To disable debugging, use the no form of this command.
debug ip cef rrhash
no debug ip cef rrhash
Syntax Description
This command has no arguments or keywords.
Defaults
This command is disabled by default.
Command Modes
Privileged EXEC
Command History
Usage Guidelines
Use this command to verify the removal of receive hash events when you are shutting down or deleting an interface.
Examples
The following is sample output from the debug ip cef rrhash command.
Router# debug ip cef rrhash00:27:15:CEF:rrhash/check:found 9.1.104.7 on down idb [ok to delete]00:27:15:CEF:rrhash/check:found 9.1.104.0 on down idb [ok to delete]00:27:15:CEF:rrhash/check:found 9.1.104.255 on down idb [ok to delete]00:27:15:CEF:rrhash/check:found 9.1.104.7 on down idb [ok to delete]00:27:15:CEF:rrhash/check:found 9.1.104.7 on down idb [ok to delete]00:27:15:CEF:rrhash/check:found 9.1.104.0 on down idb [ok to delete]00:27:15:CEF:rrhash/check:found 9.1.104.255 on down idb [ok to delete]00:27:15:CEF:rrhash/check:found 9.1.104.7 on down idb [ok to delete]Table 68 describes the significant fields shown in the display.
debug ip cef subblock
To troubleshoot Cisco Express Forwarding (CEF) subblock events, use the debug ip cef subblock command in privileged EXEC mode. To disable debugging, use the no form of this command.
debug ip cef subblock [id {all | hw hw-id | sw sw-id }] [xdr {all | control | event | none | statistic}]
no debug ip cef subblock
Syntax Description
Defaults
This command is disabled by default.
Command Modes
Privileged EXEC
Command History
12.0 S
This command was introduced.
12.2(2)T
This command was integrated into Cisco IOS Release 12.2(2)T.
Usage Guidelines
This command is used to record CEF subblock messages and events.
Examples
The following is sample output from the debug ip cef subblock command:
Router# debug ip cef subblock00:28:12:CEF-SB:Creating unicast RPF subblock for FastEthernet6/000:28:12:CEF-SB:Linked unicast RPF subblock to FastEthernet6/0.00:28:12:CEF-SB:Encoded unit of unicast RPF data (length 16) for FastEthernet6/000:28:12:CEF-SB:Sent 1 data unit to slot 6 in 1 XDR messageTable 69 describes the significant fields shown in the display.
debug ip cef table
To enable the collection of events that affect entries in the Cisco Express Forwarding (CEF) tables, use the debug ip cef table command in privileged EXEC mode. To disable debugging, use the no form of this command.
debug ip cef table [access-list | consistency-checkers]
no debug ip cef table [access-list | consistency-checkers]
Syntax Description
access-list
(Optional) Controls collection of consistency checker parameters from specified lists.
consistency-checkers
(Optional) Sets consistency checking characteristics.
Defaults
This command is disabled by default.
Command Modes
Privileged EXEC
Command History
Usage Guidelines
This command is used to record CEF table events related to the forwarding information base (FIB) table. Possible types of events include the following:
•
•
•
•
Examples
The following is sample output from the debug ip cef table command:
Router# debug ip cef table01:25:46:CEF-Table:Event up, 1.1.1.1/32 (rdbs:1, flags:1000000)01:25:46:CEF-IP:Checking dependencies of 0.0.0.0/001:25:47:CEF-Table:attempting to resolve 1.1.1.1/3201:25:47:CEF-IP:resolved 1.1.1.1/32 via 9.1.104.1 to 9.1.104.1 Ethernet2/0/001:26:02:CEF-Table:Event up, default, 0.0.0.0/0 (rdbs:1, flags:400001)01:26:02:CEF-IP:Prefix exists - no-op changeTable 70 describes the significant fields shown in the display.
debug ip dhcp server
To enable DHCP Server debugging, use the debug ip dhcp server privileged EXEC command.
debug ip dhcp server {events | packets | linkage}
Syntax Description
Defaults
Disabled by default
Command History
debug ip drp
To display Director Response Protocol (DRP) information, use the debug ip drp privileged EXEC command. The no form of this command disables debugging output.
debug ip drp
no debug ip drp
Syntax Description
This command has no arguments or keywords.
Usage Guidelines
The debug ip drp command is used to debug the director response agent used by the Distributed Director product. The Distributed Director can be used to dynamically respond to Domain Name System (DNS) queries with the IP address of the "best" host based on various criteria.
Examples
The following is sample output from the debug ip drp command. This example shows the packet origination, the IP address that information is routed to, and the route metrics that were returned.
Router# debug ip drpDRP: received v1 packet from 172.69.232.8, via Ethernet0DRP: RTQUERY for 172.69.58.94 returned internal=0, external=0Table 71 describes the significant fields shown in the display.