-
Cisco Wireless Control System Configuration Guide, Release 5.1
-
Preface
-
Chapter 1: Overview
-
Chapter 2: Getting Started
-
Chapter 3: Configuring Security Solutions
-
Chapter 4: Performing System Tasks
-
Chapter 5: Adding and Using Maps
-
Chapter 6: Monitoring Wireless Devices
-
Chapter 7: Managing WCS User Accounts
-
Chapter 8: Configuring Mobility Groups
-
Chapter 9: Configuring Access Points
-
Chapter 10: Configuring Controllers and Switches
-
Chapter 11: Using Templates
-
Chapter 12: Performing Maintenance Operations
-
Chapter 13: Configuring Hybrid REAP
-
Chapter 14: Alarms and Events
-
Chapter 15: Running Reports
-
Chapter 16: Administrative Tasks
-
Chapter 17: Virtual Domains
-
Chapter 18: Google Earth Maps
-
Appendix A: Troubleshooting and Best Practices
-
Appendix B: WCS and End User Licenses
-
Appendix C: Conversion of a WLSE Autonomous Deployment to a WCS Controller Deployment
-
Index of Cisco Wireless Control System Configuration Guide, Version 5.1
-
 Feedback
Table Of Contents
Monitoring Rogue Access Points, Adhocs, and Clients
Interpreting Security Summary Window
Unclassified Rogue Access Points
Access Point Threats or Attacks
Rogue Access Point Location, Tagging, and Containment
Detecting and Locating Rogue Access Points
Configuring ACS View Server Credentials
Enabling Automatic Client Troubleshooting
Monitoring Mesh Networks Using Maps
Monitoring Mesh Link Statistics Using Maps
Monitoring Mesh Access Points Using Maps
Monitoring Mesh Access Point Neighbors Using Maps
Mesh Statistics for an Access Point
Viewing the Mesh Network Hierarchy
Using Mesh Filters to Modify Map Display of Maps and Mesh Links
Viewing Clients Identified as WGBs
Retrieving the Unique Device Identifier on Controllers and Access Points
Transmission Power Change Notifications
Monitoring Wireless Devices
This chapter describes how to use WCS to monitor your wireless LANs. It contains these sections:
•
Monitoring Rogue Access Points, Adhocs, and Clients
•
•
•
•
•
•
•
Monitoring Rogue Access Points, Adhocs, and Clients
Because unauthorized rogue access points are inexpensive and readily available, employees sometimes plug them into existing LANs and build ad hoc wireless networks without IT department knowledge or consent. These rogue access points can be a serious breach of network security because they can be plugged into a network port behind the corporate firewall. Because employees generally do not enable any security settings on the rogue access point, it is easy for unauthorized users to use the access point to intercept network traffic and hijack client sessions. Even more alarming, wireless users frequently publish unsecure access point locations, increasing the odds of having the enterprise security breached.
Rather than having a person with a scanner manually detect rogue access points, the Cisco Unified Wireless Network Solution automatically collects information on rogue access points detected by its managed access points (by MAC and IP address) and allows the system operator to locate, tag, and contain them. It can also be used to discourage rogue access point clients by sending them deauthenticate and disassociate messages from one to four access points.
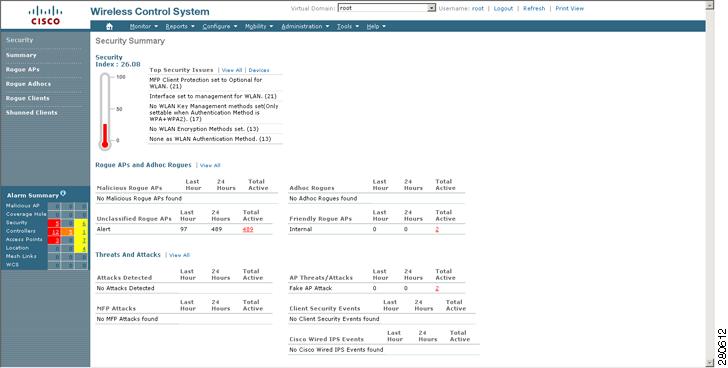
Interpreting Security Summary Window
You can see a summary of existing events and the security state of the network by choosing Monitor > Security. The Security Summary window appears (see Figure 6-1).
Figure 6-1 Security Summary Window
The Security Summary window provides information in the following sections:
•
•
•
Security Index
The Security Index gives an indication of the security of the WCS managed network, and it is calculated as part of daily background tasks. It is calculated by assigning weight to the various security configurations and displaying it in visual form. The combined weighting can vary from 0 to 100 where 0 signifies the least secured and 100 is the maximum secured. The weighting comes from the lowest scoring controller and the lowest scoring Location Server/Mobility Service Engine related security configurations that are maintained within WCS itself. The Security Index of the WCS managed network is calculated as the lowest scoring controller plus the lowest scoring Location Service/Mobility Service Engine.
The security thermometer color range is represented as follows:
•
•
•
Note
The security index of the latest release is the benchmark for the required security configurations. For example, if AES encryption was not present in an earlier version of code, the index is reduced by the number associated with the AES encryption security configuration. Likewise, if new security configurations are introduced, the weighting would be altered.
Note
Top Security Issues
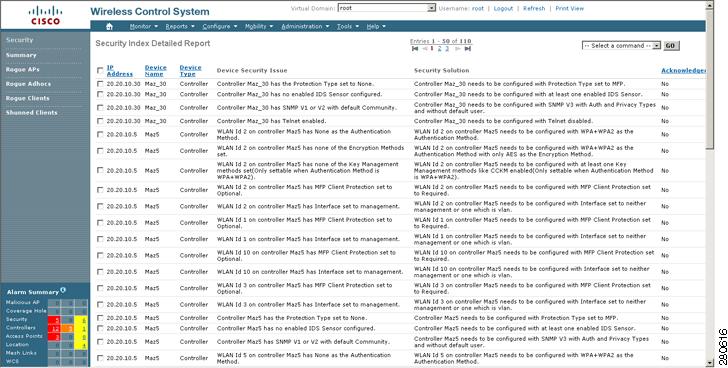
The View All and Devices links sort relevant columns and show a report of security issues occurring across all controllers. If you click View All, the Security Index Detailed Report appears (see Figure 6-2). It displays all security issues found across all controllers, location servers, and mobility service engines. It details problems found in a particular security configuration retrieved from the device. If a particular issue has been acknowledged (just as you would an alarm), it will be ignored the next time the Configuration Sync task runs (provided Security Index Calculation is enabled).
Note
- The acknowledged issue on the controller is not directly affecting the security index score.
- The acknowledged issue on a WLAN is not directly affecting the security index score. Only the lowest scoring WLAN of the lowest scoring controller affects the security index score, so an issue on any other WLAN would not make the score higher.
- Some cases, like SSH and Telnet being enabled on a controller, are both flagged as issues. However, a Telnet issue has a higher precedence than an SSH issue. For instance, if SSH is acknowledged on a controller with the lowest score, no changes would occur for the security index.The following three different view can be viewed:
•
•
•
Figure 6-2 Security Index Detailed Report
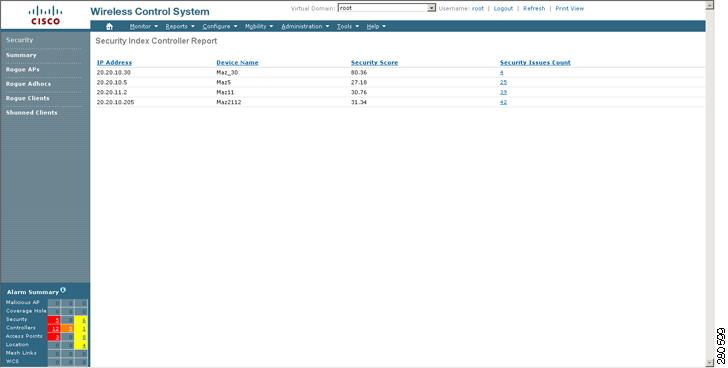
If you click Devices from the Security Summary window (Figure 6-1), the Security Index Controller Report appears (see Figure 6-3). This screen shows the security violation report as a summary for each controller. By row, each controller shows the number of security issues that occurred on that controller and provides a link to all security issues.
Note
Figure 6-3 Security Index Controller Report
If you click the number in the Security Issues Count column, the Security Index Detailed Report appears (see Figure 6-2).
Table 6-1 lists top security issues, provides a description of why the issue occurs, and defines what action should be taken as a solution. Table 6-2 lists top security issues for location and mobility servers, provides a description of why the issue occurs, and defines what action should be taken as a solution.
Malicious Rogue Access Points
This section provides information on rogue access points that are classified as Malicious. Table 6-3 describes the various parameters. For each of these parameters, a value is provided for last hour, last 24 hours, and total active. If you click an underlined number in any of the time period categories, a window with further information appears.
Note
Adhocs Rogues
This section provides information on rogue adhocs. This section provides information on rogue adhocs. Table 6-4 describes the various parameters. For each of these parameters, a value is provided for last hour, last 24 hours, and total active. If you click an underlined number in any of the time period categories, a window with further information appears.
Unclassified Rogue Access Points
This section provides information on rogue access points that are not classified. Table 6-5 describes the various parameters. For each of these parameters, a value is provided for last hour, last 24 hours, and total active. If you click an underlined number in any of the time period categories, a window with further information appears.
Note
Friendly Rogue Access Points
This section provides information on rogue access points that are classified as friendly. Table 6-6 describes the various parameters. For each of these parameters, a value is provided for last hour, last 24 hours, and total active. If you click an underlined number in any of the time period categories, a window with further information appears.
Note
Attacks Detected
Attacks reflect network patterns that indicate a possible virus or hacker attack. When an attack occurs, the attack table is updated immediately. The table displays the number of attacks during the last one hour, last 24 hours, and the total active. You can use this information to assess the security state or security threats to the network.
If you click an underlined number in any of the time period categories, a window with further information appears.
Access Point Threats or Attacks
Table 6-7 describes the AP Threats or Attacks parameters. For each of these parameters, a value is provided for last hour, last 24 hours, and total active. If you click an underlined number in any of the time period categories, a window with further information appears.
MFP Attacks
A value is provided for Infrastructure and client MFP attacks in the last hour, last 24 hours, and total active. If you click an underlined number in any of the time period categories, a window with further information appears.
Client Security Events
For each of these parameters, a value is provided for last hour, last 24 hours, and total active. If you click an underlined number in any of the time period categories, a window with further information appears.
Cisco Wired IPS Events
A value is provided for last hour, last 24 hours, and all. If you click an underlined number in any of the time period categories, a window with further information appears.
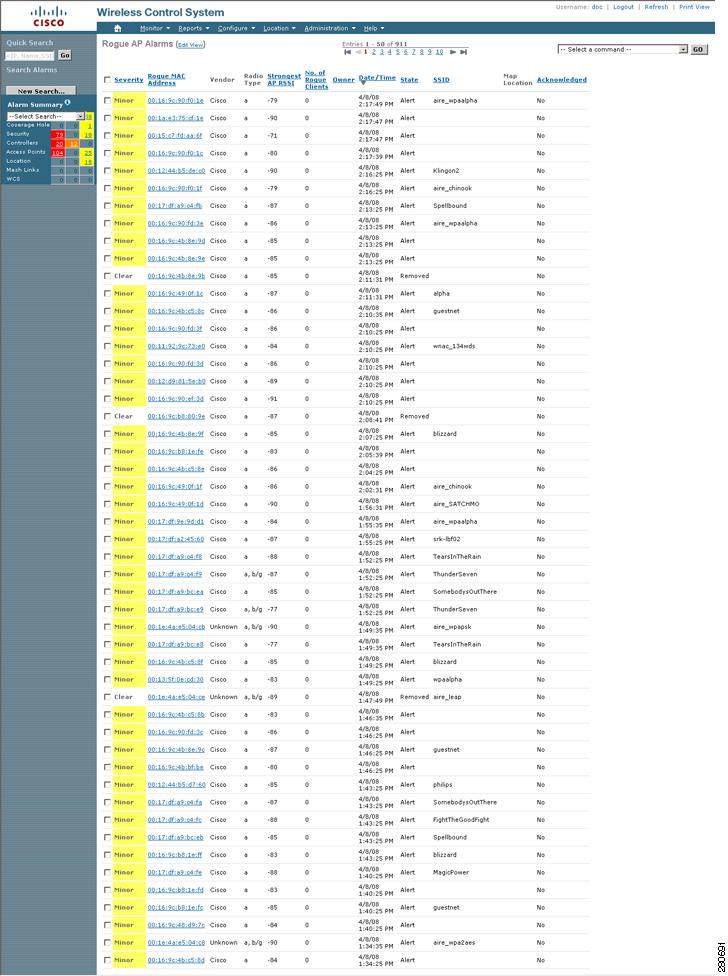
Monitoring Rogue Access Point
If you choose Rogue APs from the left sidebar menu (of the Monitor > Security page), the Rogue AP Alarms window appears (see Figure 6-4). This window allows you to view alarm details and messages regarding any anomalies with the controllers and access points.
Figure 6-4 Rogue AP Alarms
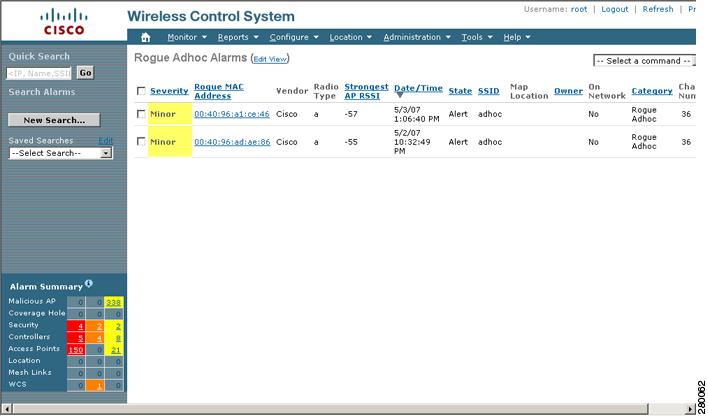
Monitoring Rogue Adhoc
If you choose Rogue Adhocs from the left sidebar menu (of the Monitor > Security page), the Rogue Adhoc Alarms window appears (see Figure 6-5). On this window you can view details of rogue adhoc alarms.
Figure 6-5 Rogue Adhoc Alarms Window
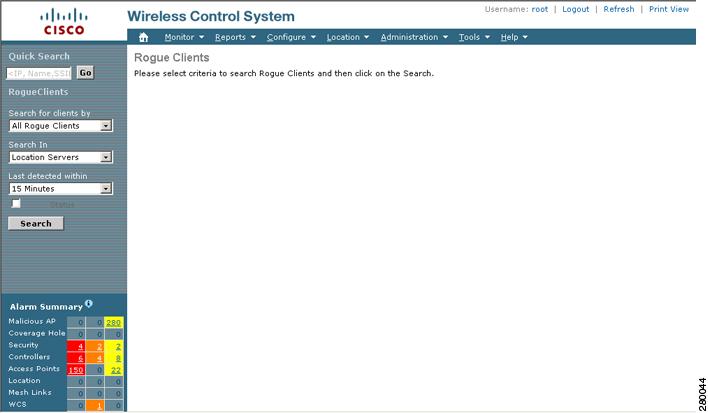
Monitoring Rogue Clients
If you choose Rogue Clients from the left sidebar menu (of the Monitor > Security page), the Rogue Clients window appears (see Figure 6-6). You can select search criteria in the left sidebar menu and then details about the rogue clients that are found is displayed.
Figure 6-6 Rogue Clients Window
Monitoring Shunned Clients
When a Cisco IPS sensor on the wired network detects a suspicious or threatening client, it alerts the controller to shun this client. If the client to be shunned is currently associated to an access point and controller in a mobility group:
1.
2.
3.
The next time the client tries to connect to a controller, the anchor controller rejects the handcuff and informs the foreign controller that the client is being excluded.
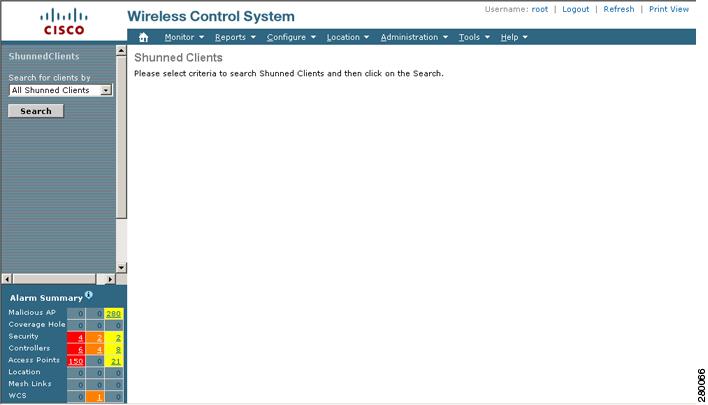
Choose Monitor > Security from the left sidebar menu and select Shunned Clients to access this window (see Figure 6-7).
Figure 6-7 Shunned Clients Window
The Shunned Client window displays the client IP address, sensor IP address, and the controller for each shunned client.
Rogue Access Point Location, Tagging, and Containment
This built-in detection, tagging, monitoring, and containment capability enables system administrators to take appropriate action:
•
•
•
•
•
•
–
–
–
–
Detecting and Locating Rogue Access Points
When the access points on your wireless LAN are powered up and associated with controllers, WCS immediately starts listening for rogue access points. When a controller detects a rogue access point, it immediately notifies WCS, which creates a rogue access point alarm.
When WCS receives a rogue access point message from a controller, an alarm monitor appears in the lower left corner of all WCS user interface pages. The alarm monitor in Figure 6-8 shows 199 rogue access point alarms.
Figure 6-8 Alarm Monitor for Rogue Access Points
Follow these steps to detect and locate rogue access points.
Step 1
Step 2
Step 3
•
•
•
•
•
•
•
•
Set State to `Known - Internal'—Tags the rogue access point as internal, adds it to the known rogue access points list, and turns off containment.
Set State to `Known - External'—Tags the rogue access point as external, adds it to the known rogue access points list, and turns off containment.
•
Step 4
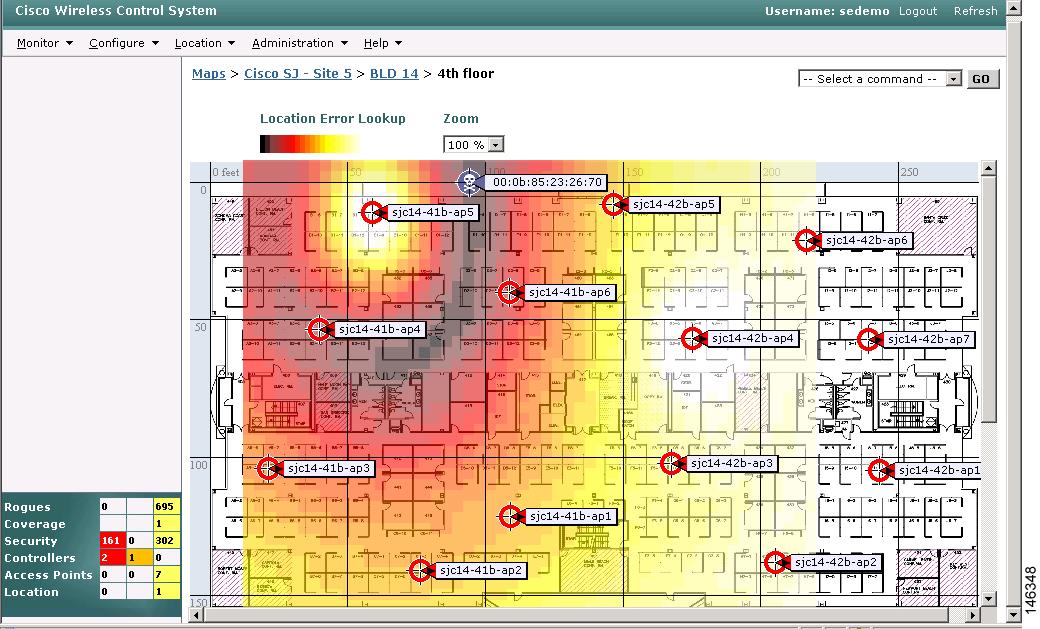
If you are using WCS Location, WCS compares RSSI signal strength from two or more access points to find the most probable location of the rogue access point and places a small skull-and-crossbones indicator at its most likely location. In the case of an underdeployed network for location with only one access point and an omni antenna, the most likely location is somewhere on a ring around the access point, but the center of likelihood is at the access point. If you are using WCS Base, WCS relies on RSSI signal strength from the rogue access point and places a small skull-and-crossbones indicator next to the access point receiving the strongest RSSI signal from the rogue unit. Figure 6-9 shows a map that indicates that location of a rogue unit.
Figure 6-9 Map Indicating Location of Rogue Unit
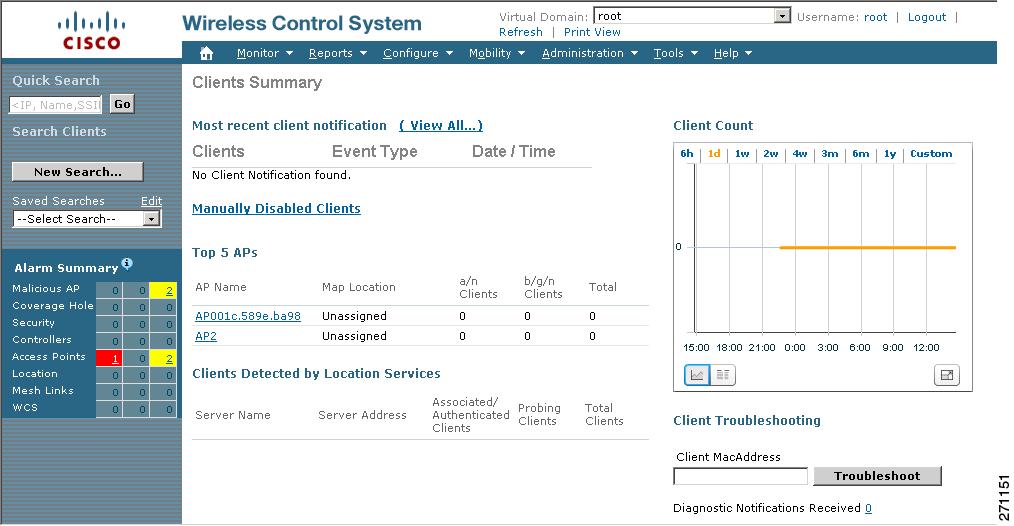
Monitoring Clients
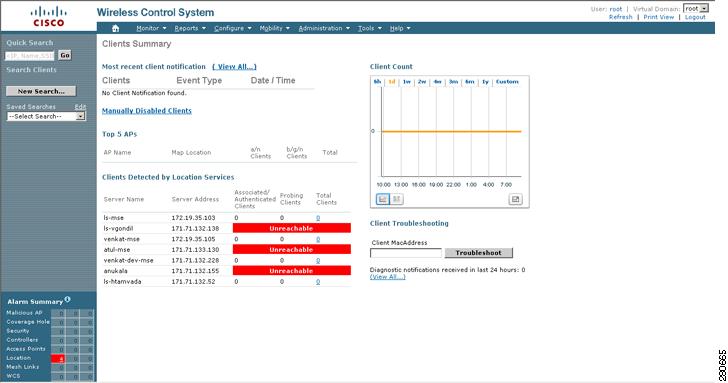
This section provides access to the controller clients summary details. The information assists in identifying, diagnosing, and resolving client issues. To monitor clients, choose Monitor > Clients. The Client Summaries window appears (see Figure 6-10).
Figure 6-10 Clients Summary
The Client Summaries window contains the following portions:
Most Recent Client Notification
•
•
•
Manually Disabled Clients
Choose Monitor > Clients and then click Manually Disabled Clients to access this page.
This page enables you to view manually disabled client template information.
•
•
Top 5 APs
The Top 5 APs section includes the following:
•
•
•
•
•
Clients Detected by Location Servers
Displays clients detected by location servers within the last 15 minutes.
•
•
•
Client Count
A graphic shows the associated clients during a given time frame.
Client Troubleshooting
Client—Enter the IP address, MAC address, or user-defined client name and click Troubleshoot to continue to the client details.
Diagnostic Notification Received—Indicates the number of diagnostic notifications received. Click the number to view the list of the diagnostic events.
WLAN Client Troubleshooting
The client reporting protocol is used by the client and the access point to exchange client information. Client reports are collected automatically when the client associates. Follow these steps to run diagnostic tests and reports and to view available logs:
Step 1
Step 2
Note
Step 3
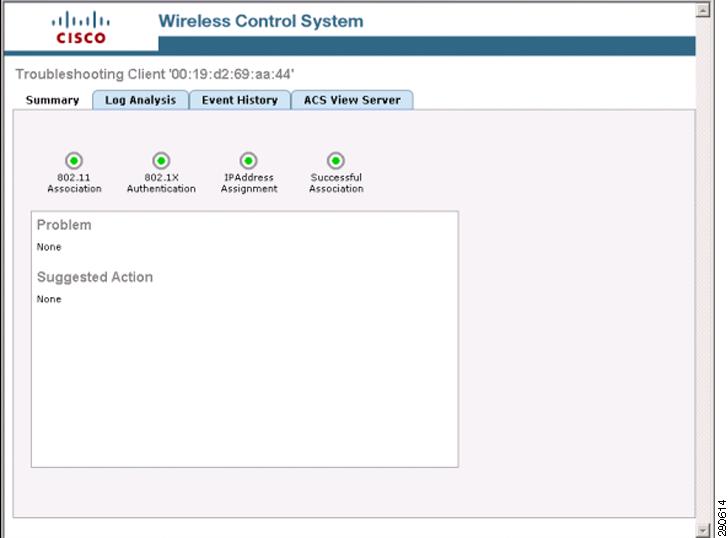
Figure 6-11 Troubleshooting Client Tab
The summary page displays a brief description of the problem and recommends a course of action to resolve the issue.
Note
Step 4
Step 5
Note
Step 6
•
•
•
•
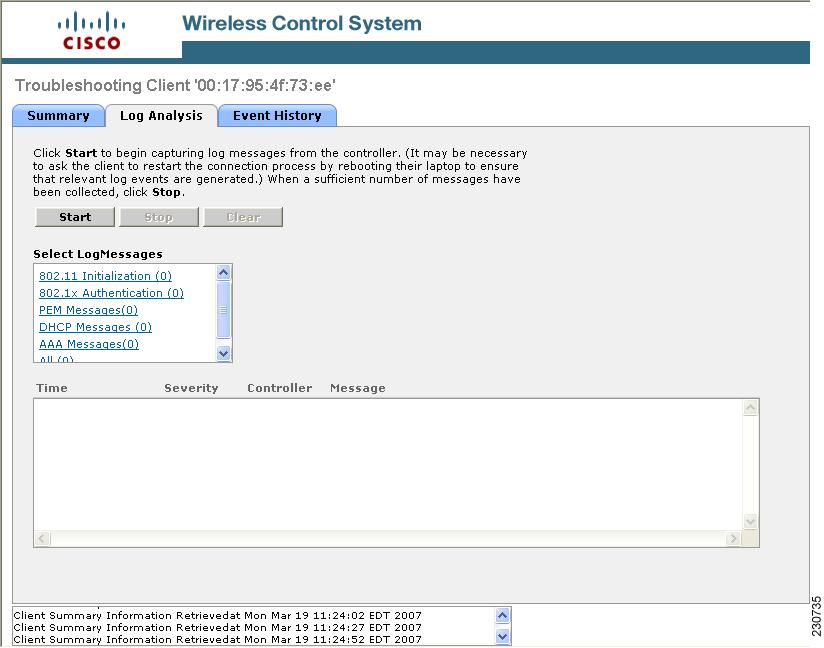
Figure 6-12 Log Analysis Tab
Step 7
This page displays client and access point events that occurred within the last 24 hours.
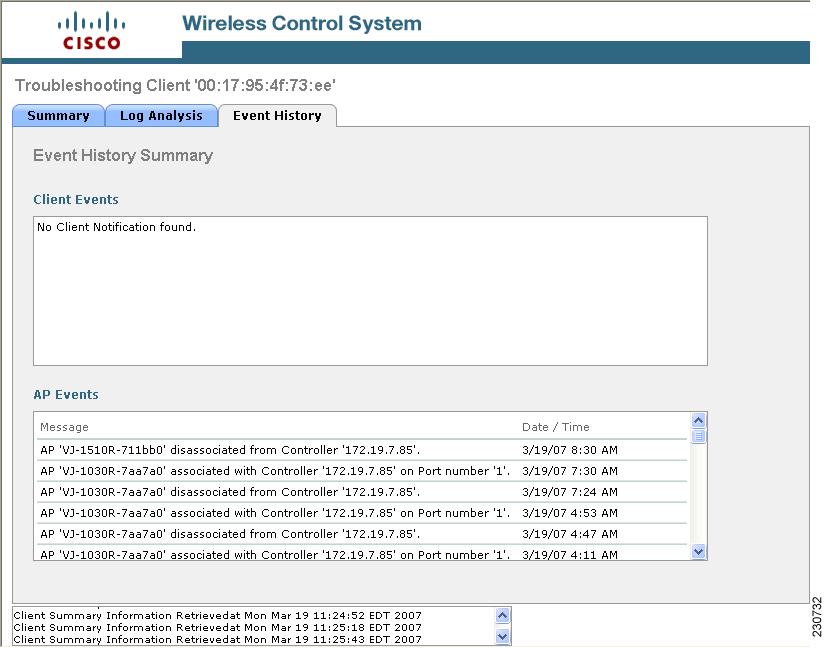
Figure 6-13 Event History Tab
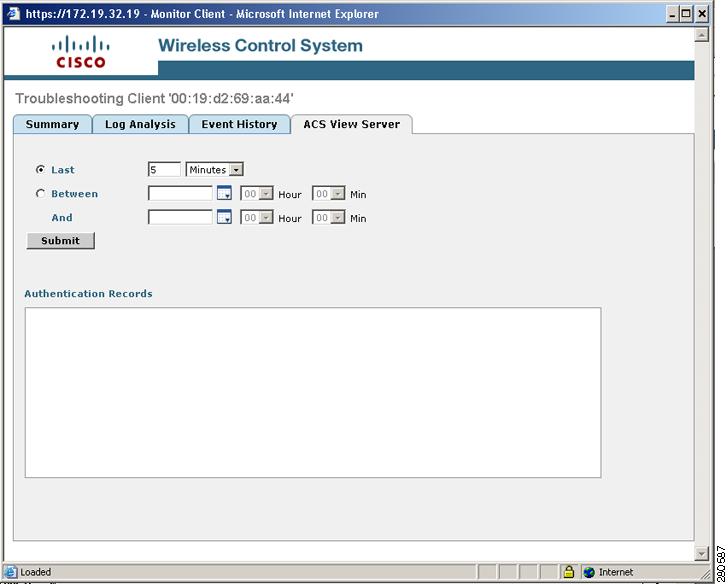
Step 8
This server provides WCS with aggregated client status information from multiple ACS servers. The client status information allows you to further troubleshoot client issues and determine if they are related to authentication or authorization. Enter the date and time ranges to retrieve the historical authentication and authorization information and click Submit. The results of the query are displayed in the Authentication Records portion of the window and is used as a filter for the userid logged into the client.
Figure 6-14 ACS View Server Window
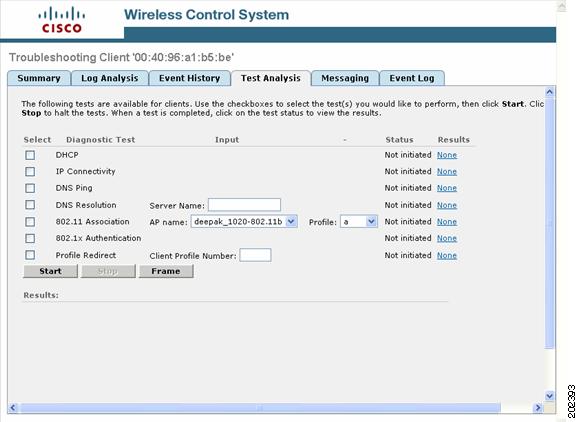
Step 9
Figure 6-15 Test Analysis Tab
Step 10
•
•
•
•
•
•
•
Note
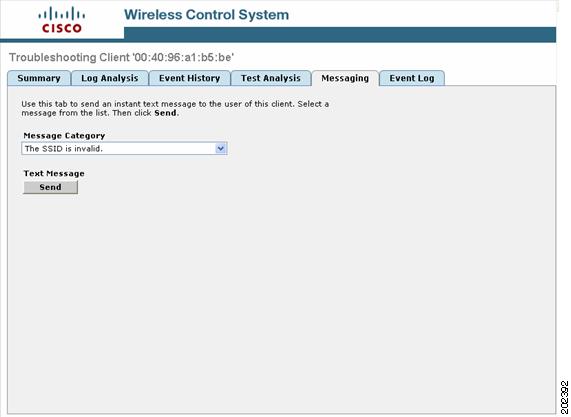
Step 11
Figure 6-16 Messaging Tab
Step 12
Step 13
a.
b.
c.
d.
e.
f.
g.
h.
i.
j.
k.
l.
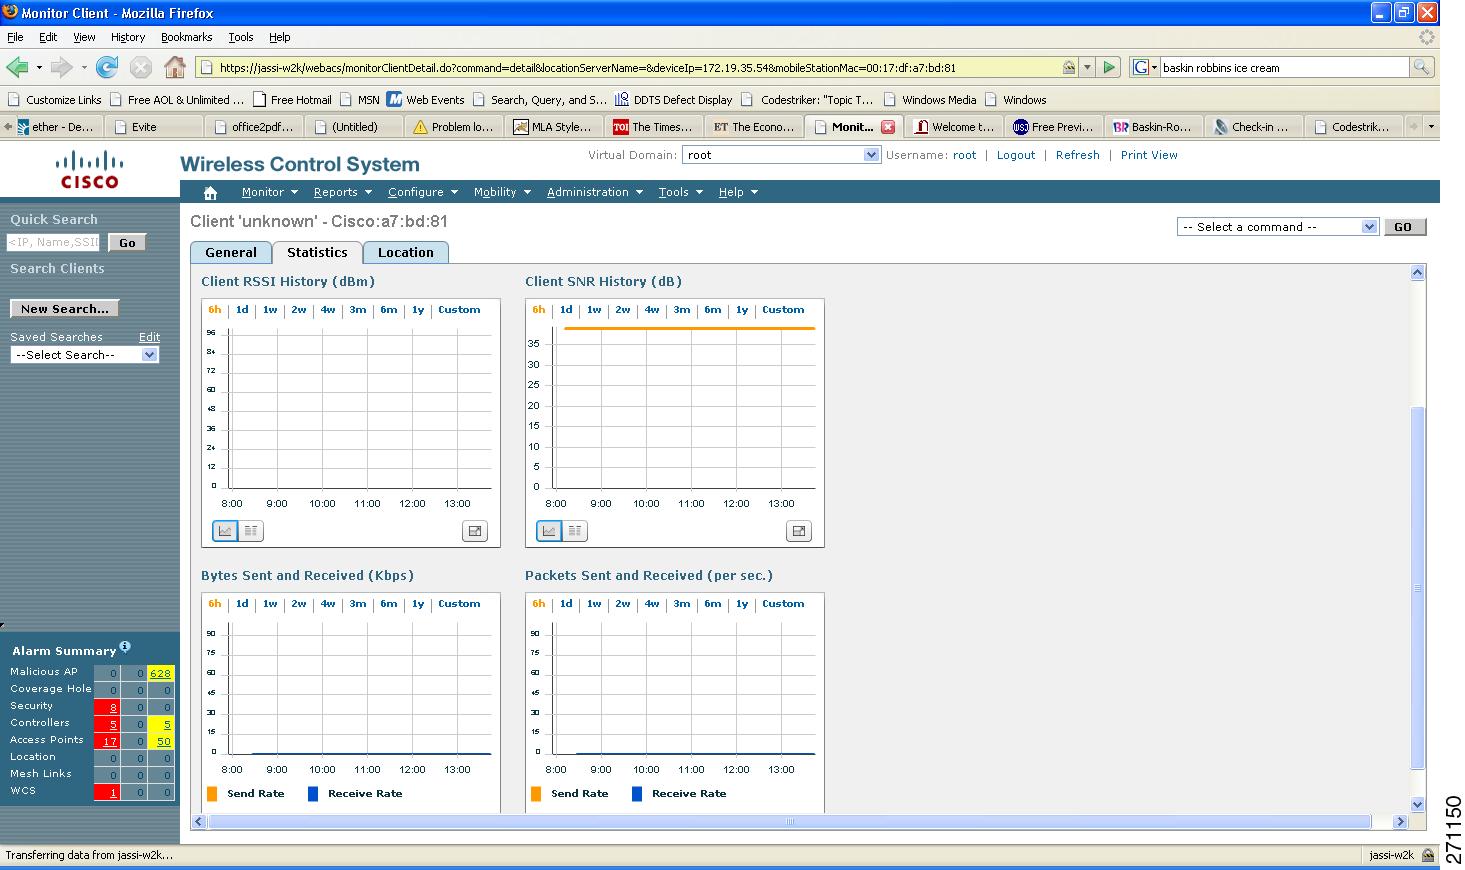
Step 14
This page displays four graphs:
•
•
•
•
Table 6-11 describes the fields displayed on this Statistics tab.
Figure 6-17 Statistics Tab
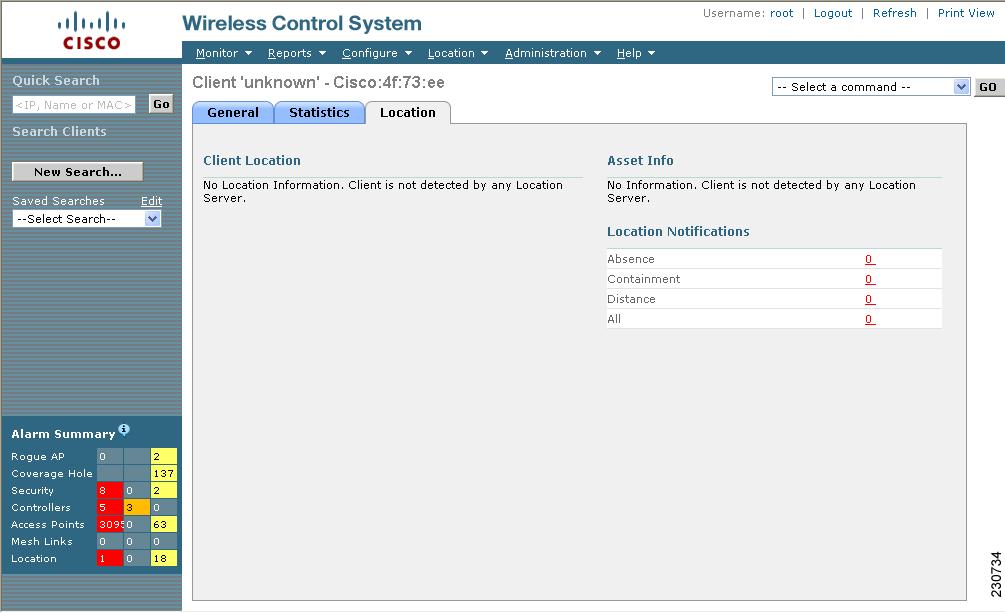
Step 15
Figure 6-18 Location Tab
Step 16
Note
•
Note
Table 6-14 describes the parameters displayed in the Cisco Compatibility Extensions (version 5) Capability Information portion of the tab.
Note
Step 17
Configuring ACS View Server Credentials
In order to facilitate communication between WCS and the ACS View Server and to access the ACS View Server tab, you must add a view server with credentials. Follow these steps to configure the ACS View Server Credentials.
Step 1
Step 2
Step 3
Step 4
Step 5
Enabling Automatic Client Troubleshooting
The Settings > Client page allows you to enable automatic client troubleshooting on a diagnostic channel. This feature is only available for Cisco Compatible Extension clients version 5.
Follow these steps to enable automatic client troubleshooting.
Step 1
Step 2
Step 3
Note
Step 4
Finding Clients
Follow these steps to use WCS to find clients on your wireless LAN.
Step 1
Step 2
•
•
•
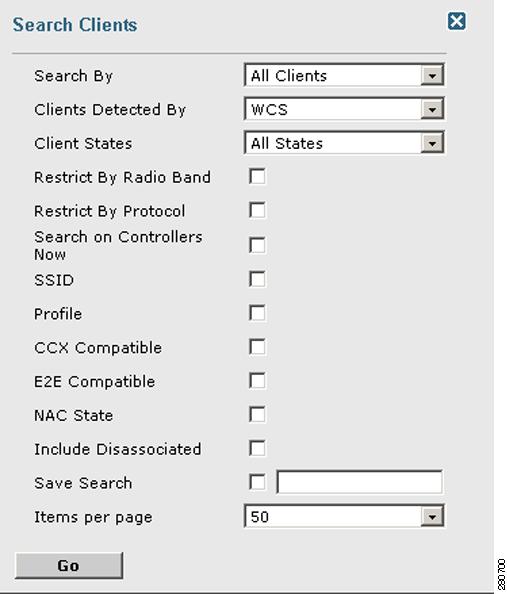
Step 3
Figure 6-19 Search Clients
You can configure the following parameters in the Search clients window:
•
•
•
•
•
•
•
•
•
•
•
•
•
•
Step 4
Note
Step 5
Note
Step 6
•
•
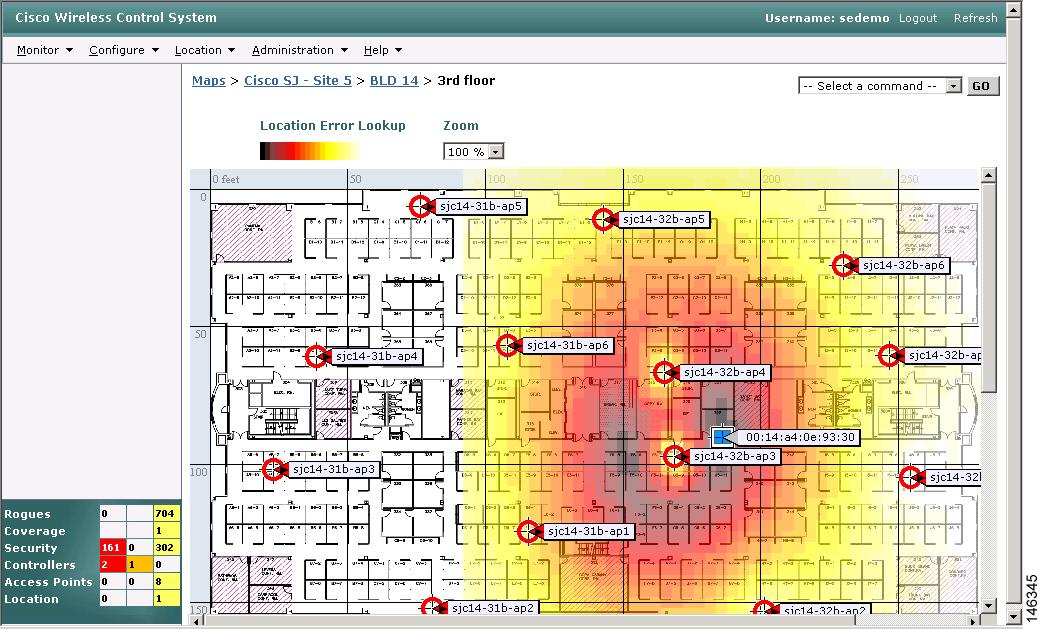
If you are using WCS Location, WCS compares the RSSI signal strength from two or more access points to find the most probable location of the client and places a small laptop icon at its most likely location. If you are using WCS Base, WCS relies on the RSSI signal strength from the client and places a small laptop icon next to the access point that receives the strongest RSSI signal from the client. Figure 6-20 shows a heat map that includes a client location.
Figure 6-20 Map with Client Location
Step 7
Step 8
Step 9
Step 10
Step 11
•
•
•
•
•
•
Receiving Radio Measurements
On the client window, you can receive radio measurements only if the client is Cisco Compatible Extensions v2 (or higher) and is in the associated state (with a valid IP address). If the client is busy when asked to do the measurement, it determines whether to honor the measurement or not. If it declines to make the measurement, it shows no data from the client.
Step 1
Step 2
Step 3
Step 4
•
–
–
–
–
–
–
–
–
•
–
–
–
–
•
–
–
•
–
–
Step 5
The measurements take about 5 msec to perform. A message from WCS indicates the progress. If the client chooses not to perform the measurement, that is also communicated.
Monitoring Mesh Networks Using Maps
You can access and view details for the following elements from a mesh network map in Cisco WCS:
•
•
•
Details on how this information is accessed and the information displayed for each of these items is detailed in the following sections.
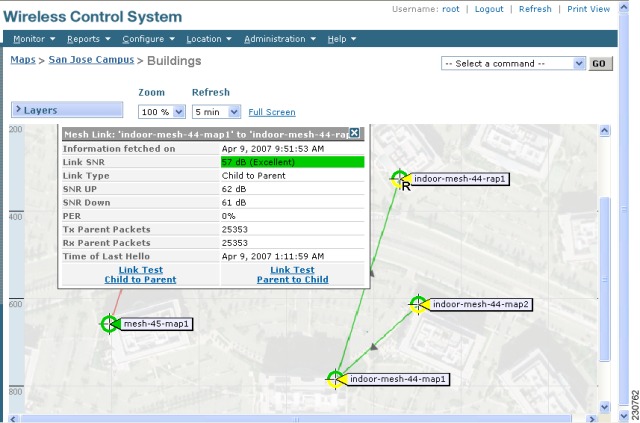
Monitoring Mesh Link Statistics Using Maps
You can view the SNR for a specific mesh network link, view the number of packets transmitted and received on that link, and initiate a link test from the Monitor > Maps display.
To view details on a specific mesh link between two mesh access points or a mesh access point and a root access point, do the following:
Step 1
Step 2
Step 3
Note
Figure 6-21 Mesh Link Details Window
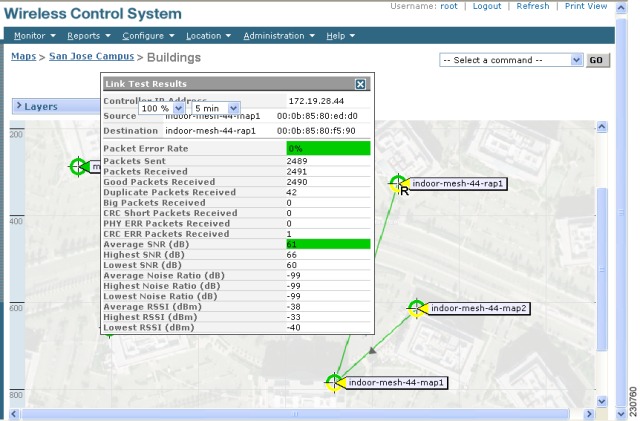
Step 4
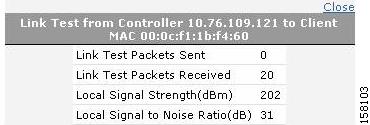
Note
Note
Figure 6-22 Link Test Results
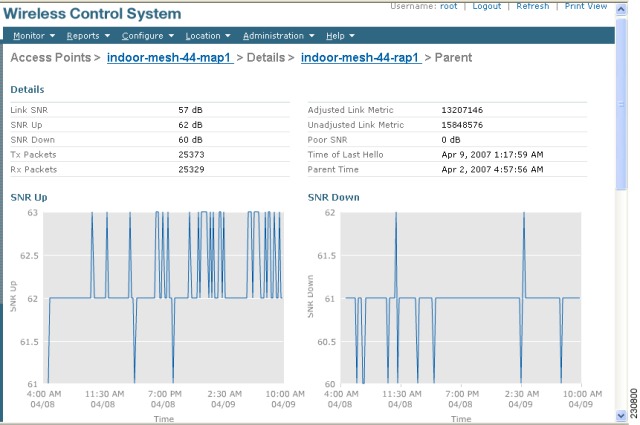
Step 5
The following graphs are displayed for the link:
•
•
•
•
•
Figure 6-23 Mesh SNR Graphs Page (Top)
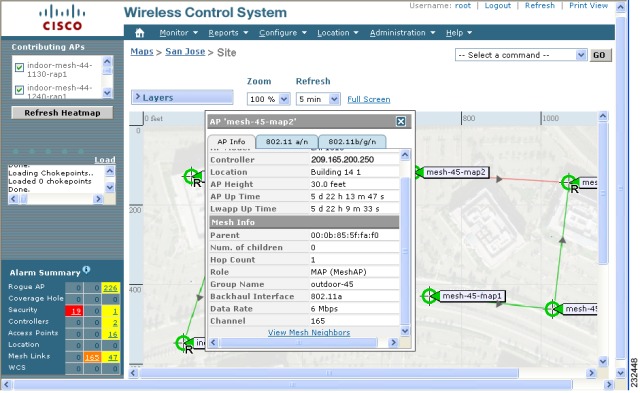
Monitoring Mesh Access Points Using Maps
You can view the following summary information for a mesh access point from a mesh network map:
•
•
•
•
•
•
•
•
Note
Note
To view summary and detailed configuration information for a mesh access point from a mesh network map, do the following:
Step 1
Step 2
Step 3
Figure 6-24 Mesh AP Summary Panel
Step 4
Note
Figure 6-25 Mesh AP Detail Window
Step 5
a.
Note
b.
c.
d.
Monitoring Mesh Access Point Neighbors Using Maps
To view details on neighbors of a mesh access point from a mesh network map, do the following:
Step 1
Step 2
Step 3
Step 4
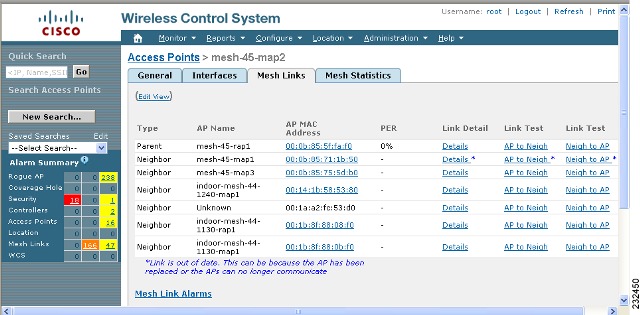
Figure 6-26 Access Points > Mesh Links Panel
Note
Note
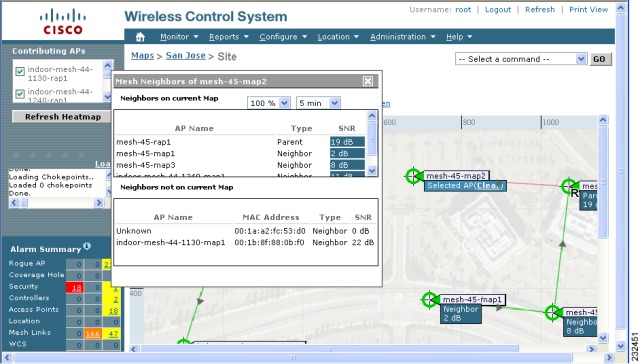
Figure 6-27 View Mesh Neighbors Panel
Note
Note
Monitoring Mesh Health
Mesh Health monitors the overall health of Cisco Aironet 1500 and 1520 series outdoor access points as well as Cisco Aironet 1130 and 1240 series indoor access points when configured as mesh access points, except as noted. Tracking this environmental information is particularly critical for access points that are deployed outdoors. The following factors are monitored:
•
•
•
•
•
Mesh Health information is displayed in the General Properties panel for mesh access points.
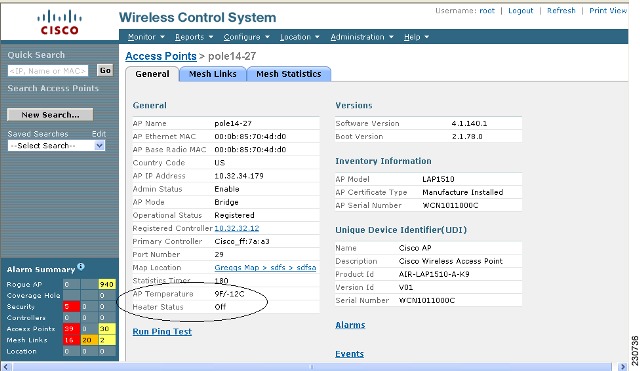
To view the mesh health details for a specific mesh access point, follow these steps.
Step 1
Note
Figure 6-28 Monitor > Access Points
Step 2
Note
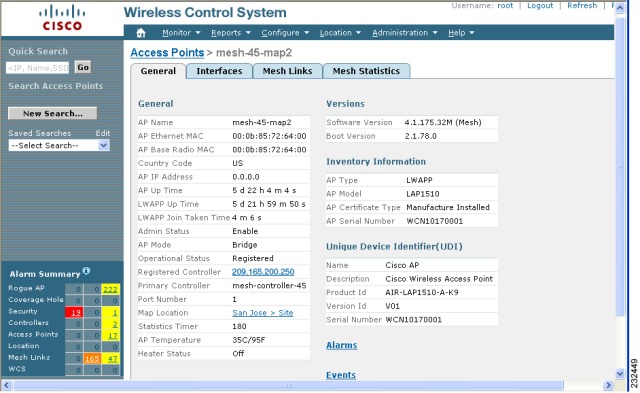
Figure 6-29 AP Name > General Properties Page
To add, remove, or reorder columns in the table, click the Edit View link. Table 6-17 displays optional access point parameters available from the Edit View window.
Mesh Statistics for an Access Point
Mesh Statistics are reported when a child mesh access point authenticates or associates with a parent mesh access point.
Security entries are removed and no longer displayed when the child mesh access point disassociates from the controller.
The following mesh security statistics are displayed for mesh access points:
•
•
•
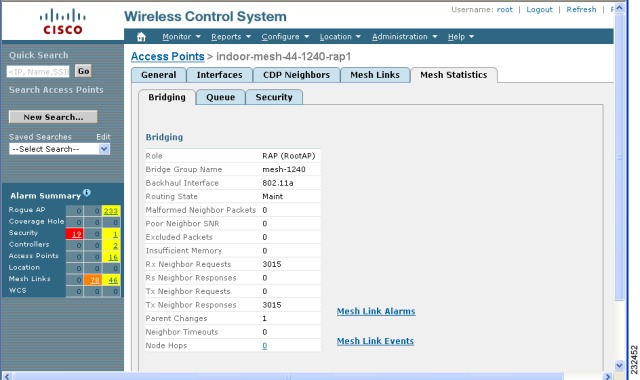
To view the mesh statistics for a specific mesh access point, follow these steps.
Step 1
Note
Step 2
A tabbed panel appears and displays the General Properties page for the selected access point.
Step 3
Note
Note
Figure 6-30 Monitor > Access Points > AP Name > Mesh Statistics
Summaries of the Bridging, Queue and Security Statistics and their definitions are provided in Table 6-18, Table 6-19 and Table 6-20 respectively.
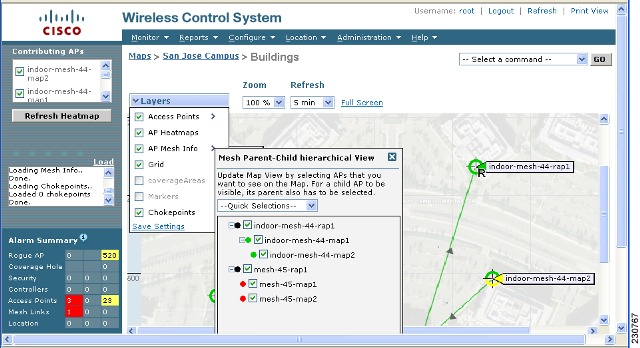
Viewing the Mesh Network Hierarchy
You can view the parent-child relationship of mesh access points within a mesh network in an easily navigable display. You can also filter which access points display on the Map view, by selecting only access points of interest.
To view the mesh network hierarchy for a selected network, do the following:
Step 1
Step 2
Step 3
Figure 6-31 Monitor > Maps > Selected Map
Step 4
Note
Step 5
Step 6
All subordinate mesh access points are displayed when a negative (-) sign displays next to the parent mesh access point entry. For example, in Figure 6-31, the access point, indoor-mesh-45-rap2, has only one child, indoor-mesh-44-map2.
Step 7
The color of the dot also provides a quick reference point of the SNR strength.
•
•
•
•
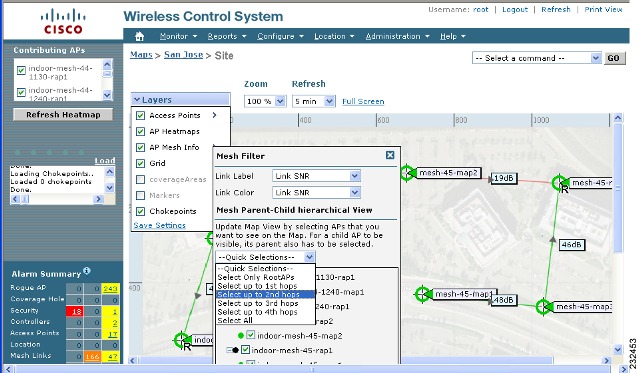
Using Mesh Filters to Modify Map Display of Maps and Mesh Links
In the mesh hierarchical window, you can also define mesh filters to determine which mesh access points display on the map based on hop values as well as what labels display for mesh links.
Mesh access points are filtered by the number of hops between them and their root access point.
To use mesh filtering, follow these steps:
Step 1
a.
b.
Note
Note
Step 2
a.
b.
c.
Note
Note
Figure 6-32 Mesh Filter and Hope Count Configuration Panel
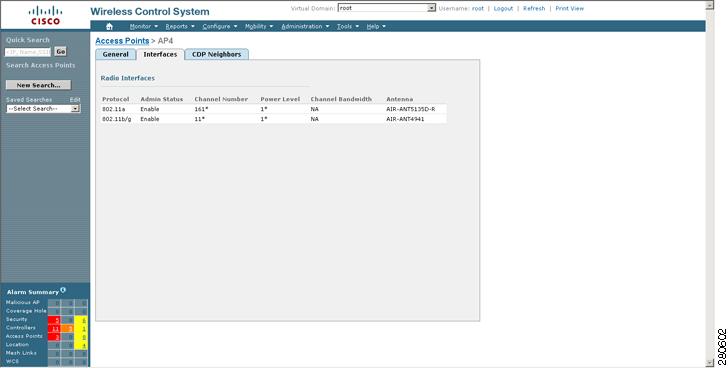
Monitoring Channel Width
Follow these steps to view the channel width.
Step 1
Step 2
Step 3
Figure 6-33 Interfaces Tab
Step 4
Table 6-24 Interfaces Tab Parameters
Protocol
802.11a or 802.11b/g.
Admin Status
Indicates whether the access point is enabled or disabled.
Channel Number
Indicates the channel on which the Cisco Radio is broadcasting.
Power Level
Access Point transmit power level: 1 = Maximum power allowed per Country Code setting, 2 = 50% power, 3 = 25% power, 4 = 6.25 to 12.5% power, and 5 = 0.195 to 6.25% power.
Channel Bandwidth
Indicates the channel width for this radio interface. See "Configuring 40-MHz Channel Bonding" section on page 10-15 for more information on configuring channel bandwidth.
Note
Antenna Name
Identifies the type of antenna.
Viewing Google Earth Maps
Follow these steps to view Google Earth maps. Refer to Chapter 18, "Google Earth Maps," for further information.
Step 1
Step 2
Step 3
Note
To view details for a Google Earth Map folder, follow these steps:
Step 1
Note
To delete the entire folder, select the check box next to Folder Name and click Delete. Deleting a folder also deletes all subfolders and access points inside the folder.Step 2
Google Earth Settings
Access point related settings can be defined from the Google Earth Settings window. To configure access point settings for the Google Earth Maps feature, follow these steps:
Step 1
Step 2
Step 3
Step 4
•
Caution
•
Note
–
Note
–
Note
–
Note
Step 5
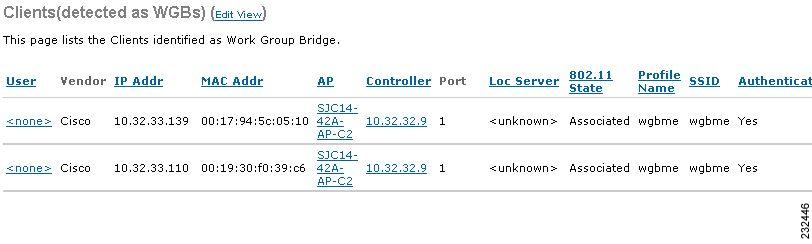
Viewing Clients Identified as WGBs
When you click Monitor > WGB, you get a list of all clients identified as a workgroup bridges (see Figure 6-34). WGB clients bridge wireless to wired. Any IOS access point can take on the role of a WGB, acting as a wireless client with a wired client connected to it. The information about this WGB is propogated to the controller and appears as a client in both WCS and WLC.
Figure 6-34 Monitor > WGBs
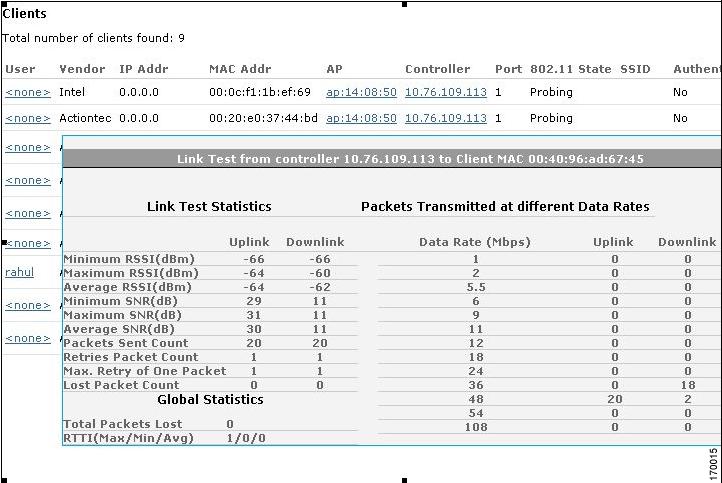
Running a Link Test
A link test uses a ping from parent-to-child or child-to-parent to test the link quality. The RF parameters of the ping reply packets received by the access point are polled by the controller to find the link quality. Because radio link quality can differ depending on the direction (client to access point versus access point to client), it is critical to have Cisco Compatible Extensions linktest support so that link quality is tested in both directions. It polls the controller every so many seconds until the row status indicates success or failure. During the link test, the table is populated. If the link test fails, the controller reverts to a ping test.
You can access the link test in one of two ways. The first option is described below.
Step 1
Step 2
Step 3
Step 4
Another method for accessing the link test is as follows:
Step 1
Figure 6-35 Clients Summary
Step 2
Step 3
Step 4
Figure 6-36 shows a sample Cisco Compatible Extensions link test result and Figure 6-37 shows a sample ping test result.
Figure 6-36 Cisco Compatible Extensions Link Test Result
Figure 6-37 Ping Test Result
Retrieving the Unique Device Identifier on Controllers and Access Points
The unique device identifier (UDI) standard uniquely identifies products across all Cisco hardware product families, enabling customers to identify and track Cisco products throughout their business and network operations and to automate their asset management systems. The standard is consistent across all electronic, physical, and standard business communications. The UDI consists of five data elements:
•
•
•
•
•
The UDI is burned into the EEPROM of controllers and lightweight access points at the factory and can be retrieved through the GUI.
Follow these steps to retrieve the UDI on controllers and access points.
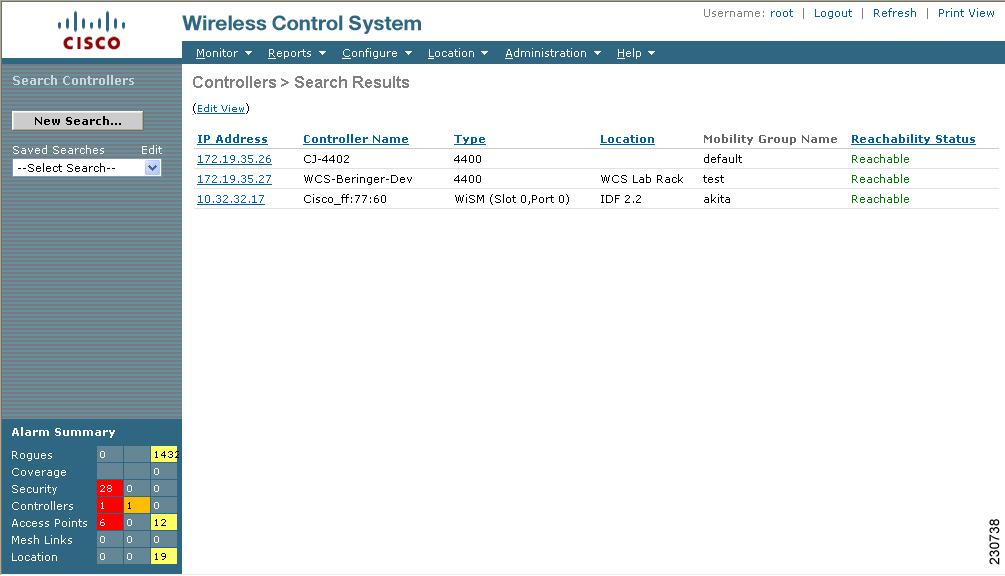
Step 1
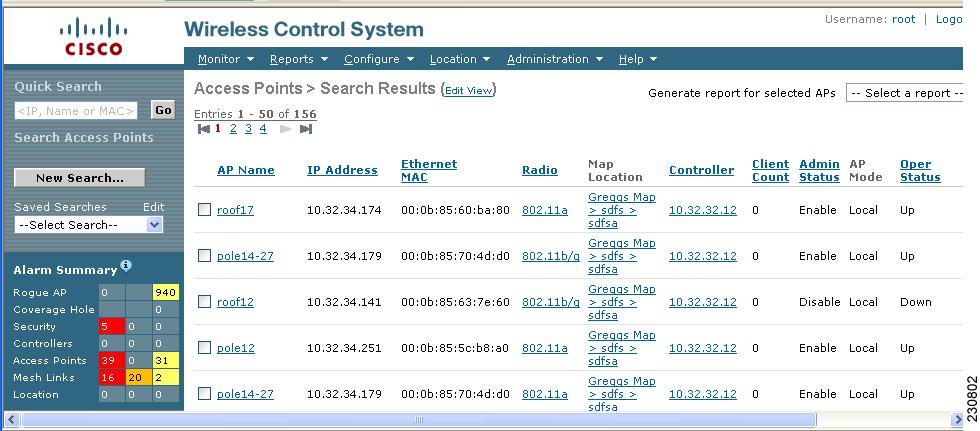
Figure 6-38 Controllers > Search Results
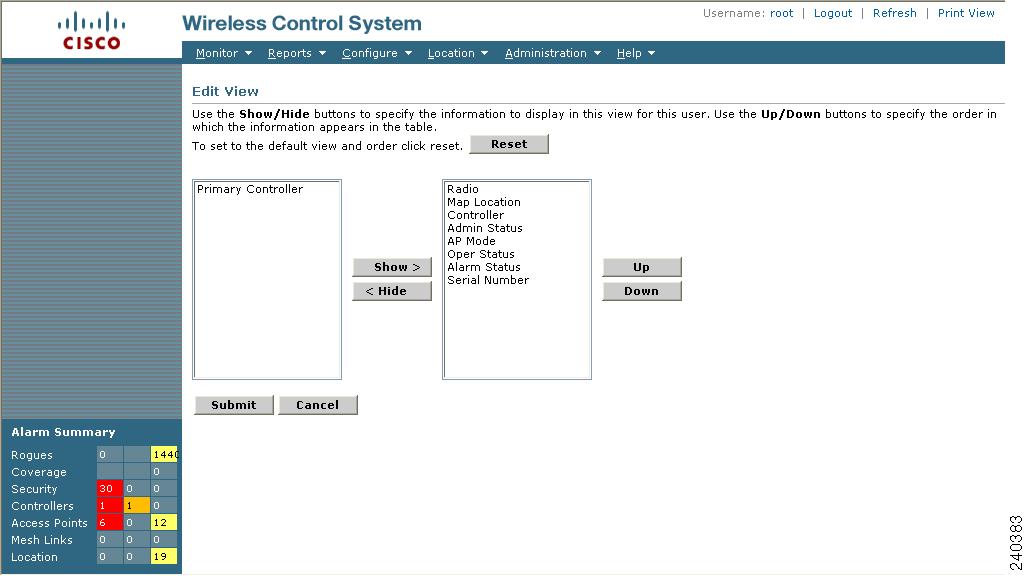
Step 2
Figure 6-39 Edit View Window
Step 3
Table 6-25 Controllers Summary
IP Address
Local network IP address of the controller management interface.
Name
User-defined name of the controller.
Type
The type of controller.
Note
UP Time
Time in days, hours, and minutes since the last reboot.
System Time
Time used by the controller.
Internal Temperature
The current internal temperature of the unit (in Centigrade).
Location
User-defined physical location of the controller.
Contact
The contact person for this controller, their textual identification, and ways to contact them. If no contact information is known, this is an empty string.
Total Client Count
Total number of clients currently associated with the controller.
Current LWAPP Transport Mode
Lightweight Access Point Protocol transport mode. Communications between controllers and access points. Selections are Layer 2 or Layer 3.
Power Supply One
Indicates the presence or absence of a power supply and its operations state.
Power Supply Two
Indicates the presence or absence of a power supply and its operation state.
Software Version
The operating system release, version.dot.maintenance number of the code currently running on the controller.
Description
Description of the inventory item.
Model No.
Specifies the machine model as defined by the Vital Product Data.
Serial No.
Unique serial number for this controller.
Burned-in MAC Address
The burned-in MAC address for this controller.
Number of APs supported
The maximum number of access points supported by the controller.
GigE Card Present
Displays the presence or absence of the optional 1000BASE-T/1000BASE-SX GigE card.
Crypto Card One
Displays the presence or absence of an enhanced security module which enables IPSec security and provides enhanced processing power. See Table 6-26 for information on the maximum number of crypto cards that can be installed on a controller.
Note
Crypto Card Two
Displays the presence or absence of a second enhanced security module.
Port 1
Up or Down
Port 2
Up or Down
Name
Product type. Chassis for controller and Cisco AP for access points.
Description
Description of controller and may include number of access points.
Product Id
Orderable product identifier.
Version Id
Version of product identifier.
Serial Number
Unique product serial number.
Coverage Hole
Coverage holes are areas where clients cannot receive a signal from the wireless network. The Cisco Unified Wireless Network Solution radio resource management (RRM) identifies these coverage hole areas and reports them to the WCS, enabling the IT manager to fill holes based on user demand.
WCS is informed about the reliability-detected coverage holes by the controllers. WCS alerts the user about these coverage holes. For more information on finding coverage holes, refer to the "Finding Coverage Holes" section on page 5-9.
Note
Monitoring Pre-Coverage Holes
While coverage holes are displayed as alarms, pre-coverage holes are displayed as events.
Follow these steps to view pre-coverage hole events.
Step 1
Step 2
The Pre-Coverage Hole Events window provides the information described in the following table:
Step 3
•
–
–
–
–
–
–
–
–
–
–
–
•
•
•
Viewing DHCP Statistics
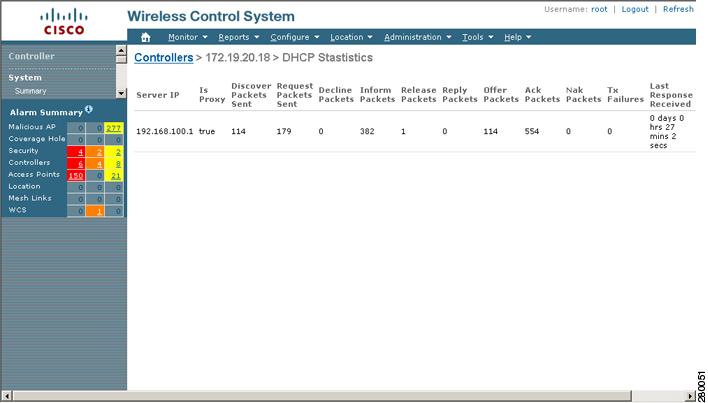
WCS provides DHCP server statistics for version 5.0.6.0 controllers or later. These statistics include information on the packets sent and received, DHCP server response information, and last request timestamp.
Follow these steps to view DHCP statistics.
Step 1
Step 2
Step 3
Figure 6-40 DHCP Statistics Window
The DHCP Statistics screen provides the following information:
RRM Dashboard
RRM automatically detects and configures new controllers and lightweight access points as they are added to the network. It then automatically adjusts associated and nearby lightweight access points to optimize coverage and capacity.
Lightweight access points can simultaneously scan all valid 802.11a/b/g channels for the country of operation as well as for channels available in other locations. The access points go "off-channel" for a period not greater than 60 ms to monitor these channels for noise and interference. Packets collected during this time are analyzed to detect rogue access points, rogue clients, ad-hoc clients, and interfering access points.
Note
Each access point spends only 0.2 percent of its time off-channel. This activity is distributed across all access points so that adjacent access points are not scanning at the same time, which could adversely affect wireless LAN performance. In this way, administrators gain the perspective of every access point, thereby increasing network visibility.
Prior to WCS software release 5.1, WCS would receive traps whenever a change in the transmit power of the access point or channel occurred. These trap events or similar events such as RF regrouping were logged into WCS events as informational and were maintained by the event dispatcher. The reason for the transmit power or channel changes (such as signals from neighboring access points, interference, noise, load balancing, and so on) were not evident. You could not view these events and statistics to then perform troubleshooting practices.
WCS software release 5.1 introduces a snapshot of the Radio Resource Management (RRM) statistics. It helps to identify trouble spots and provides possible reasons for channel or power level changes. The dashboard provides network-wide RRM performance statistics and predicts reasons for channel changes based on grouping the events together (access point performance, configuration mismatch between controllers in the same RF group, coverage holes that were detected by access points based on threshold, coverage holes that were detected by controllers, ratios of access points operating at maximum power, and so on).
Note
Channel Change Notifications
Two adjacent access points on the same channel can cause either signal contention or signal collision. In the case of a collision, data is simply not received by the access point. This functionality can become a problem, for example, when someone reading e-mail in a cafe affects the performance of the access point in a neighboring business. Even though these are completely separate networks, someone sending traffic to the cafe on channel 1 can disrupt communication in an enterprise using the same channel. Controllers address this problem by dynamically allocating access point channel assignments to avoid conflict and to increase capacity and performance. Channels are "reused" to avoid wasting scarce RF resources. In other words, channel 1 is allocated to a difference access point far from the cafe, which is more effective than not using channel 1 altogether.
The controller's dynamic channel assignment (DCA) capabilities are also useful in minimizing adjacent channel interference between access points. For example, two overlapping channels in the 802.11b/g band, such as 1 and 2, cannot both simultaneously use 11/54 Mbps. By effectively reassigning channels, the controller keeps adjacent channels separated, thereby avoiding this problem.
Notifications are sent to the WCS RRM dashboard when a channel change occurs. Channel changes depend on the dynamic channel assignment (DCA) configuration where the mode can be set to auto or on demand. When the mode is auto, channel assignment is periodically updated for all LWAPP access points which permit this operation. When the mode is set to on demand, channel assignments are updated based upon request. If the DCA is static, no dynamic channel assignments occur, and values are set to their global default.
In WCS software releases prior to 5.1, only radios using 20-MHz channelization are supported by DCA. In WCS software release 5.1, DCA is extended to support 802.11n 40-MHz channels in the 5-GHz band. 40-MHz channelization allows radios to achieve higher instantaneous data rates (potentially 2.25 times higher than 20-MHz channels.) In WCS software release 5.1, you can choose between DCA working at 20 or 40 MHz.
Note
When a channel change trap is received and a channel change had occurred earlier, the event is marked as Channel Revised; otherwise, the event is marked as Channel Changed. Each event for channel change can be caused by multiple reasons. The reason code is factored and equated to one irrespective of the number of reasons for the event to occur. For example, suppose a channel change is caused by signal, interference, or noise. When the reason code is received in the notification, the reason code is refactored across the reasons. If three reasons caused the event to occur, the reason code is refactored to 1/3 or 0.33 per reason. If ten channel change events are received with the same reason code, all of the three reasons are equally factored to determine the cause of the channel change.
Transmission Power Change Notifications
The controller dynamically controls access point transmit power based on real0time wireless LAN conditions. Normally, power can be kept low to gain extra capacity and reduce interference. The controller attempts to balance the access points' transmit power according to how the access points are seen by their third strongest neighbor.
The transmit power control algorithm only reduces an access point's power. However, the coverage hole algorithm can increase access point power, thereby filling a coverage hole. For example, if a failed access point is detected, the coverage hole algorithm can automatically increase power on surrounding access points to fill the gap created by the loss in coverage.
Notifications are sent to the WCS RRM dashboard when transmission power changes occur. Each event for transmit power changes is caused by multiple reasons. The reason code is factored and equated to one irrespective of the number of reasons for the event to occur.
RF Grouping Notifications
When RRM is run on the controller, dynamic grouping is done, and a new group leader is chosen. Dynamic grouping has two modes: on and off. When the grouping is off, no dynamic grouping occurs, and each switch optimizes only its own LWAPP access point parameters. When the grouping is on, switches form groups and elect leaders to perform better dynamic parameter optimization. With grouping on, configured intervals (in seconds) represent the period with which the grouping algorithm is run. (Grouping algorithms also run when the group contents change and automatic grouping is enabled.)
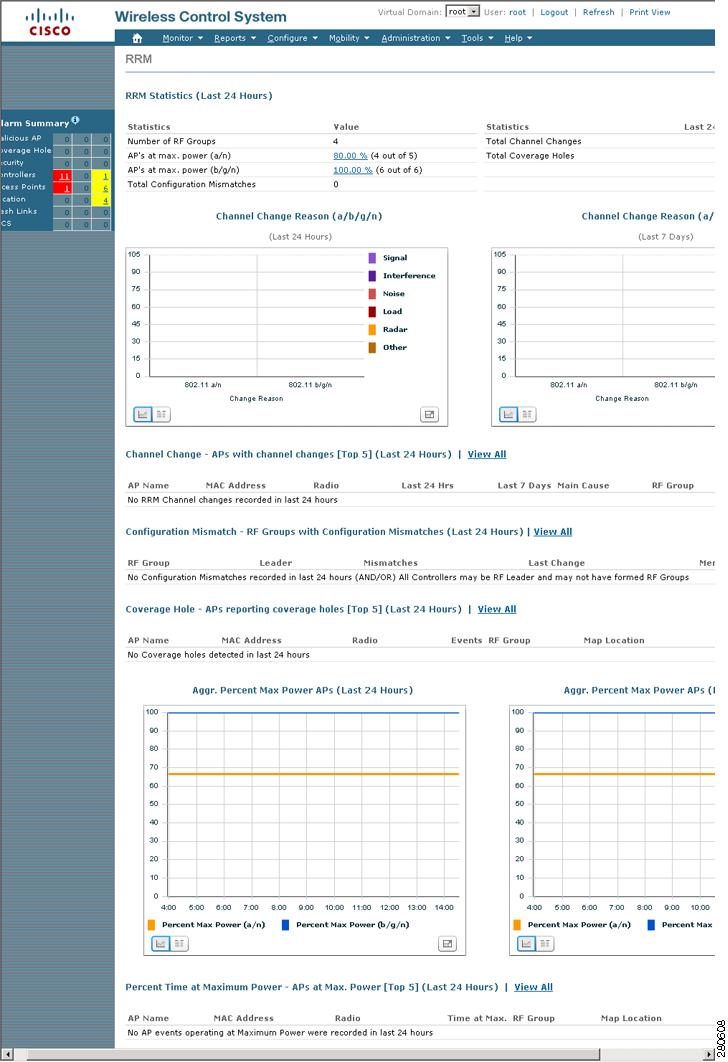
Viewing the RRM Dashboard
The RRM dashboard is accessed by choosing Monitor > RRM (see Figure 6-41).
Figure 6-41 RRM Statistics Dashboard
The dashboard is made up of the following parts:
•
•
•
•
•
•
The following statistics are displayed:
•
•
•
•
•
•
Note
•
•
•
•
Note
•
Note