Cisco TelePresence Recording Server Release 1.6 Administration Guide
Troubleshooting CTRS

Table Of Contents

Troubleshooting CTRS

CTRS Alarms and System Errors Messages

Log Files


Troubleshooting CTRS


Revised: November 2009

The following sections describe the Troubleshooting tools for the Cisco TelePresence Recording Server (CTRS):

CTRS Alarms and System Errors Messages

Log Files

CTRS Alarms and System Errors Messages

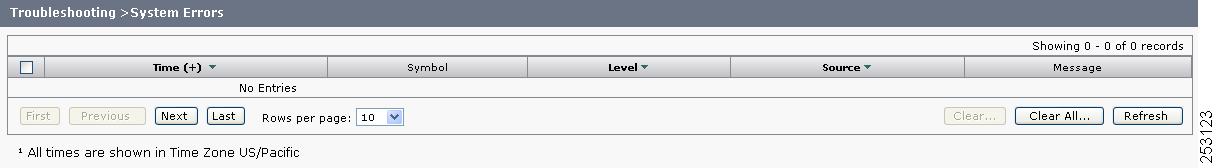
You can view CTRS alarms, systems error and system warning messages in one of two ways:

Click System Errors in the left menu (see Figure 6-1). The System Errors screen displays a list of all warning and error messages.

Figure 6-1 Troubleshooting > System Errors

From the System Status bar, click the icon for Warnings or Errors.

If you click the icon for Warnings, you will see endpoint alert information. Warnings are issued every 20 seconds when an endpoint crosses its packet loss threshold. If congestion continues for more than 40 seconds, the endpoint will be dropped.

If you click the icon for Errors, you will see endpoint drop information. Whenever an endpoint drops from high packet loss, an error is issued with the error code "CONGESTION."


The following table provides field descriptions for all system error and warning displays:

Table 6-1 System Error Field Descriptions

Field
Description

Select All

Check this box to select all system errors table entries listed.

Time

Displays the time at which this error occurred. Click the arrow to change the order (descending, ascending based on time) in which the errors are displayed.

Symbol

Text string (name) of the error message.

Level

Indicates the severity level of the error. There are eight severity levels as follows:

OFF

CRIT

ERROR

WARN

INFO

DEBUG

Click the arrow to change the order (descending, ascending based on level) in which the errors are displayed.

Source

Indicates the CTRS system process associated with this alarm or error message. Click the arrow to change the order (descending, ascending based on source) in which the errors are displayed.

Message

Message describing the error.


To display a defined number of table rows, click the down arrow next to Rows Per Page. Click to highlight and select predetermined amounts.

If there are multiple pages listing log files, click the First, Previous, Next, or Last button to navigate to the desired page.

To delete one of the system error messages, click the radio button to the left of the table entry, and then click Clear.

To delete all error messages displayed, click Clear All.

Log Files

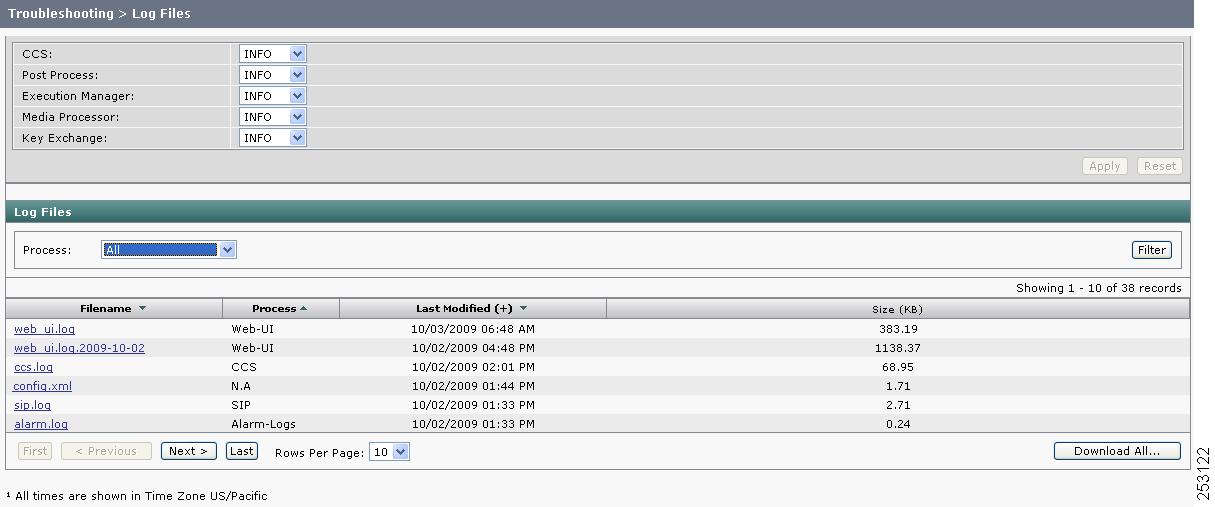
Click Log Files in the left menu to display or modify log information (see Figure 6-2).

Figure 6-2 Troubleshooting > Log Files

Use the Log File screen to set severity levels for alarms associated with specific system processes, to filter log files displayed, and to download log files.

Configuring the Severity Level of System Error Messages

To configure the severity level of system level error messages and alarms for specific process areas:


Step 1 Click Log Files under Troubleshooting in the left menu to access the Log Files screen.

Step 2 At the top of the Log Files screen, there is a table listing the following CTRS system processes:

CCS

Post Processor

Execution Manager

Media Processor

Key Exchange

To the right of each process is a drop-down list, listing the following severity levels:

OFF

CRIT

ERROR

WARN

INFO

DEBUG

Click the down arrow to display the drop-down list of defined levels of severity, and then highlight to select a specific severity level for all error messages and alarms associated a particular CTRS system process.


Note Log levels create varying amounts of data; for example, DEBUG creates more log entries than CRIT. Because verbose logs can impact system performance, use verbose logs only to track a problem.


Filtering the Log File Table Listings

To filter the log files displayed in the Log File Table:


Step 1 Click Log Files under Troubleshooting in the left menu to access the Log Files screen.

Step 2 At the middle of the Log Files screen, click the down arrow to the right of Processes to display a list of CTRS process areas, then click to highlight and select a specific process area on which to filter log files. Choices are the following:

All

CCS

Execution Manager

Media Processor

Post Process

Key Exchange

SIP

Web-UI

CDR Logs

Core

Alarm Logs

CTRS Sysop

Step 3 Click the Filter button to display the logs files associated with the selected process area in the Log Files table.


Downloading Log Files

To download log files from the Log File table:


Step 1 Click Log Files under Troubleshooting in the left menu to open the Log Files screen.

Step 2 At the bottom of the Log Files screen is the Log File table, which lists the available log files. The table is organized as described in Table 6-2.

Table 6-2 Log Table Field Descriptions

Field
Description

Filename

Filename of the log file. Click the arrow to change the order (descending, ascending based on alphabetical order of the filenames) in which the log files are displayed.

Process

CTRS system process area. Click the arrow to change the order (descending, ascending based on alphabetical order of the processes) in which the log files are displayed.

Last Modified

Time (Greenwich Mean Time, Pacific Standard Time) at which the log file was collected. Click the arrow to change the order (descending, ascending based on time) in which the log files are displayed.

Size

Size (in kilobytes) of the compressed log file.


Step 3 To display a defined number of table rows, click the down arrow next to Rows per Page. Click to highlight and select predetermined amounts. If there are multiple pages listing log files, click the First, < Previous, Next >, or Last button to navigate to the desired page.

Step 4 Click the filename of a log file to download that file. Click the Download All button to download all log files listed.