Table Of Contents
Monitoring CTRS System Processes
System Status
Process Status
Hardware Status
Monitoring CTRS System Processes
Revised: November 2009
The Monitoring screen contains tools that enable you to monitor the overall CTRS system state and the running state of individual processes. The following sections describe the monitoring tools:
•
System Status
•
Process Status
•
Hardware Status
System Status
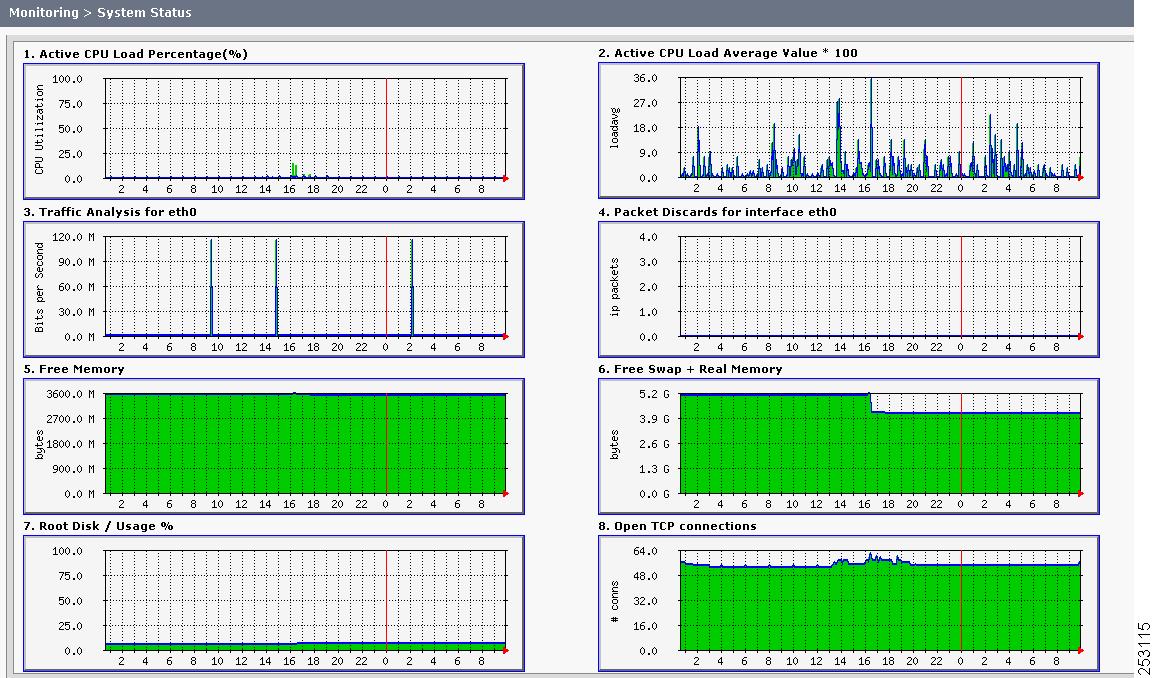
Click System Status in the left menu to display statistics that are related to system status (see Figure 7-1).
Figure 7-1 Monitoring > System Status
The System Status screen provides snapshots of the following:
•
Active CPU Load Percentage
•
Active CPU Load Average Value
•
Traffic Analysis for <interface>
•
Packet Discards for <interface>
•
Free Memory
•
Free Swap + Real Memory
•
Root Disk / Usage %
•
Open TCP Connections
Click each snapshot to reveal daily, weekly, monthly and yearly averages.
Process Status
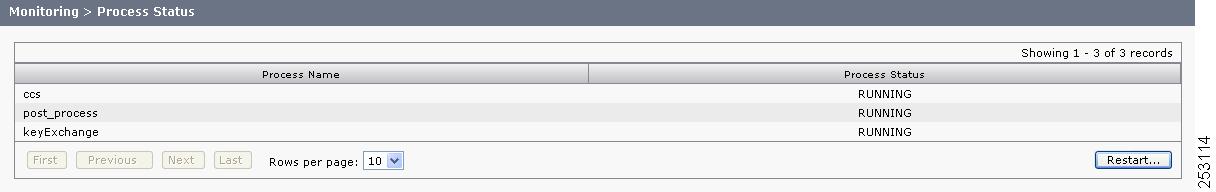
Click Process Status in the left menu to display processes that are currently running (see Figure 7-2).
Figure 7-2 Monitoring > Process Status
The Process Status screen displays a table that provides the following information:
Table 7-1 Process Status Table Field Descriptions
Field
|
Description
|
Process Name
|
Process name
|
Status
|
Status of this particular process.
|
•
To display a defined number of table rows, click the down arrow next to Rows per page. Click to highlight and select predetermined amounts.
•
If the number of static meetings exceeds the Rows per Page value, click First to view the meetings listed on the first page, Next to view the next page in sequence, Previous to view the preceding page, and Last to view the last page.
•
Click Restart to restart all of the processes.
•
The information in the Process Status screen automatically refreshes every 10 seconds.
Caution 
When you restart CTRS system processes, all active meetings are dropped. Check for active meetings before using this command.
Hardware Status
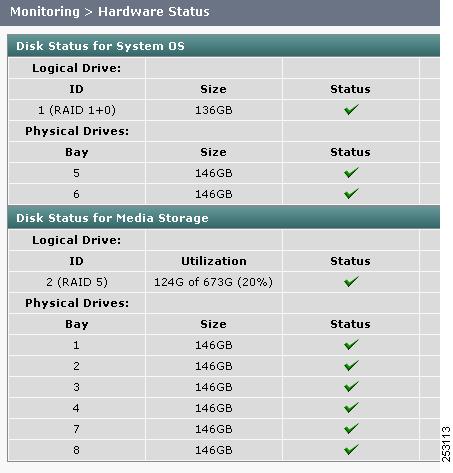
Click Hardware Status in the left menu to display hardware-related information (see Figure 7-3).
Figure 7-3 Monitoring > Hardware Status
The Hardware Status screen lists the status of CTRS hardware. The information in this screen automatically refreshes every 10 seconds.
Table 7-2 Hardware Status Field Descriptions
Field
|
Description
|
Disk Status for System OS
|
Logical Drive
|
ID
|
Identification number
|
Size
|
Size of the partition
|
Status
|
Current status of that area of the hard drive.
|
Physical Drives
|
Bay
|
Bay number
|
Size
|
Size of the partition
|
Status
|
Current status of that area of the hard drive.
|
Disk Status for Media Storage
|
Logical Drive
|
ID
|
Identification number
|
Utilization
|
Current utilization of the drive
|
Status
|
Current status of that area of the hard drive.
|
Physical Drives
|
Bay
|
Bay number
|
Size
|
Size of the partition
|
Status
|
Current status of that area of the hard drive.
|