Table Of Contents
Troubleshooting CTRS
Dashboard
Process Status
Hardware Status
System Information
System Status
CTRS Alarms and System Errors Messages
Log Files
Troubleshooting CTRS
October 2011
The following sections describe the Troubleshooting tools for the Cisco TelePresence Recording Server (CTRS):
• Dashboard
•Process Status
•Hardware Status
•System Information
•System Status
•CTRS Alarms and System Errors Messages
•Log Files
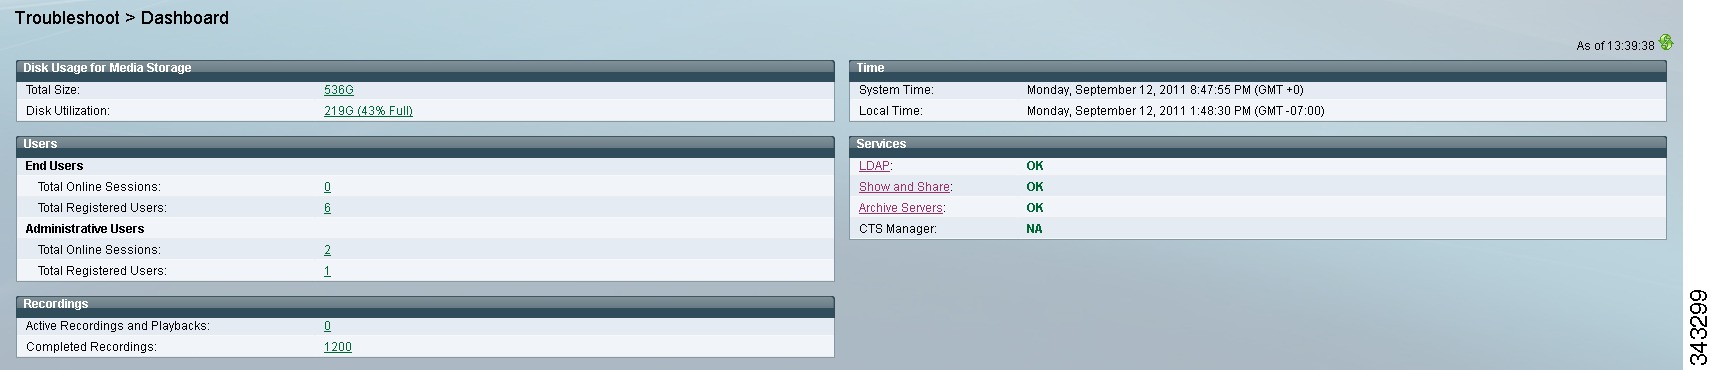
Dashboard
After you log into the CTRS Administrative UI, the Troubleshoot > Dashboard page appears. You can also access this page by clicking Dashboard in the left navigation.
As shown in Figure 6-1, the Troubleshoot > Dashboard page enables you to view high-level reports on the following aspects of the CTRS:
•Disk usage for media storage
•Users
•Recordings
•Time
•Services
Figure 6-1 Troubleshoot > Dashboard
Table 6-1 describes each Dashboard field. Each field name or entry is a link, which you can click to get more detailed information.
You can refresh the data in the Dashboard at any time by clicking the refresh icon in the upper right corner of the page.
Table 6-1 Dashboard Field Descriptions
Field
|
Description
|
Disk Usage for Media Storage
|
Total Size
|
Displays the total amount of disk space, in gigabytes, available to store videos.
For more information on disk status, click the link to access the Troubleshoot > Hardware Status page.
|
Disk Utilization
|
Displays the amount of disk space, in gigabytes and as a percentage of the total disk size, currently used for video storage.
For more information on disk status, click the link to access the Troubleshoot > Hardware Status page.
|
Users
|
End Users
|
|
Total Online Sessions
|
Displays the number of end users who are currently logged into the web-based Cisco TelePresence Video Portal.
For information on recordings currently being made or played back by a CTS endpoint, see the Active Recordings and Playbacks field, which is described later in this table.
For more information on end users who can access the Cisco TelePresence Video Portal, click the link to access the Configure > Access Management page, then click the End-user Portal tab.
|
Total Registered Users
|
Displays the number of end users who have accounts to access to the Cisco TelePresence Video Portal.
For more information on end users who can access the Cisco TelePresence Video Portal, click the link to access the Configure > Access Management page, then click the End-user Portal tab.
|
Administrative Users
|
|
Total Online Sessions
|
Displays the number of administrative users who are currently logged into the CTRS Administrative UI.
For more information on administrative users who can access the CTRS Administrative UI, click the link to access the Configure > Access Management page, Administrative Portal tab.
|
Total Registered Users
|
Displays the number of administrative users who have accounts to access to the CTRS Administrative UI.
For more information on administrative users who can access the CTRS Administrative UI, click the link to access the Configure > Access Management page, Administrative Portal tab.
|
Recordings
|
Active Recordings and Playbacks
|
Displays the number of recordings with the following status:
•Currently being made in Studio Mode or using Event Recording.
•Currently being played back by a CTS endpoint.
For more information on the active recordings, click the link to access the Manage > Active Recordings page.
|
Completed Recordings
|
Displays the number of completed recordings that are archived on the CTRS.
For more information on the completed recordings, click the link to access the Manage > Completed Recordings page.
|
Time
|
System Time
|
Displays the time determined by the value of the set timezone command in the CTRS command-line interface (CLI). (The default value of this command is Greenwich Mean Time (GMT)/Coordinated Universal Time (UTC)). This time typically corresponds to the location of the server running the CTRS application.
|
Local Time
|
Displays the time determined by the value of the Time Zone field, which you can access by clicking Preferences in the upper right corner of the CTRS Administrative UI. This time typically corresponds to the location of the CTRS administrator.
|
Services
|
LDAP, Show and Share, Archive Servers, and CTS-Manager
|
Displays the status of the LDAP, Show and Share, and archive servers, with which the CTRS could be registered. The status can be one of the following:
•OK—The CTRS is registered with a particular server, and the connection to the server is operational.
•Error—The CTRS is registered with a particular server, but the connection to the server is not operational.
•NA—You cannot register this version of CTRS with CTS-Manager. Only the Commercial Express version of CTRS can be registered with CTS-Manager.
For more information on a particular server, click the link to access the respective server page in the CTRS Administrative UI.
|
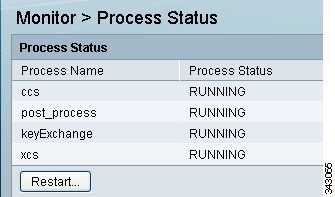
Process Status
Click Process Status in the left navigation to display processes that are currently running (see Figure 6-2).
Figure 6-2 Troubleshoot > Process Status
The Process Status page displays a table that provides the following information:
Table 6-2 Process Status Table Field Descriptions
Field
|
Description
|
Process Name
|
Process name
|
Process Status
|
Status of this particular process.
|
•Click Restart to restart all of the processes.
•The information in the Process Status page automatically refreshes every 10 seconds.
Caution When you restart CTRS system processes, all active meetings are dropped. Check for active meetings before using this command.
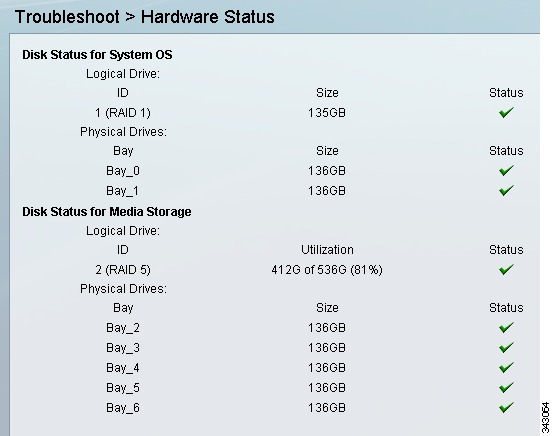
Hardware Status
Click Hardware Status in the left menu to display hardware-related information (see Figure 6-3).
Figure 6-3 Troubleshoot > Hardware Status
The Hardware Status page lists the status of CTRS hardware. The information in this page automatically refreshes every 10 seconds.
Table 6-3 Hardware Status Field Descriptions
Field
|
Description
|
Disk Status for System OS
|
Logical Drive
|
ID
|
Identification number
|
Size
|
Size of the partition
|
Status
|
Current status of that area of the hard drive.
|
Physical Drives
|
Bay
|
Bay number
|
Size
|
Size of the partition
|
Status
|
Current status of that area of the hard drive.
|
Disk Status for Media Storage
|
Logical Drive
|
ID
|
Identification number
|
Utilization
|
Current utilization of the drive
|
Status
|
Current status of that area of the hard drive.
|
Physical Drives
|
Bay
|
Bay number
|
Size
|
Size of the partition
|
Status
|
Current status of that area of the hard drive.
|
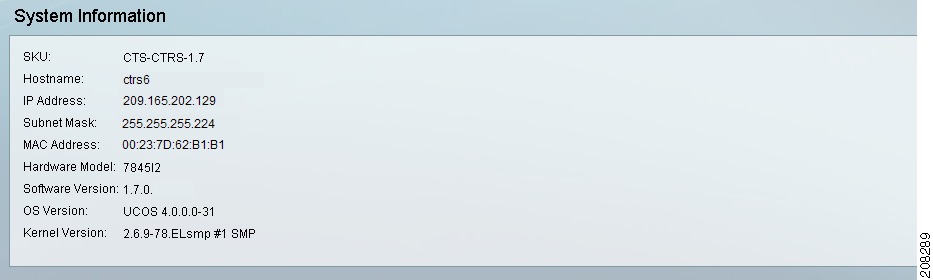
System Information
Click System Information in the left navigation to view information about the CTRS (see Figure 6-4). The information displayed under System Information is configured during CTRS software installation.
Figure 6-4 Troubleshoot > System Information
•SKU
•Hostname: Hostname of the CTRS.
•IP Address and subnet mask: IP address and corresponding subnet mask of the Cisco TelePresence Recording Server.
•MAC Address: MAC address of the Cisco MCS 7800 Series Media Convergence Server on which the Cisco TelePresence Recording Server is running
•Hardware Model: Model number of the Cisco MCS 7800 Series Media Convergence Server on which the Cisco TelePresence Recording server is running.
•Software Version: Version of CTRS Administration software currently installed.
•Operating System (OS) Version
•Kernel Version
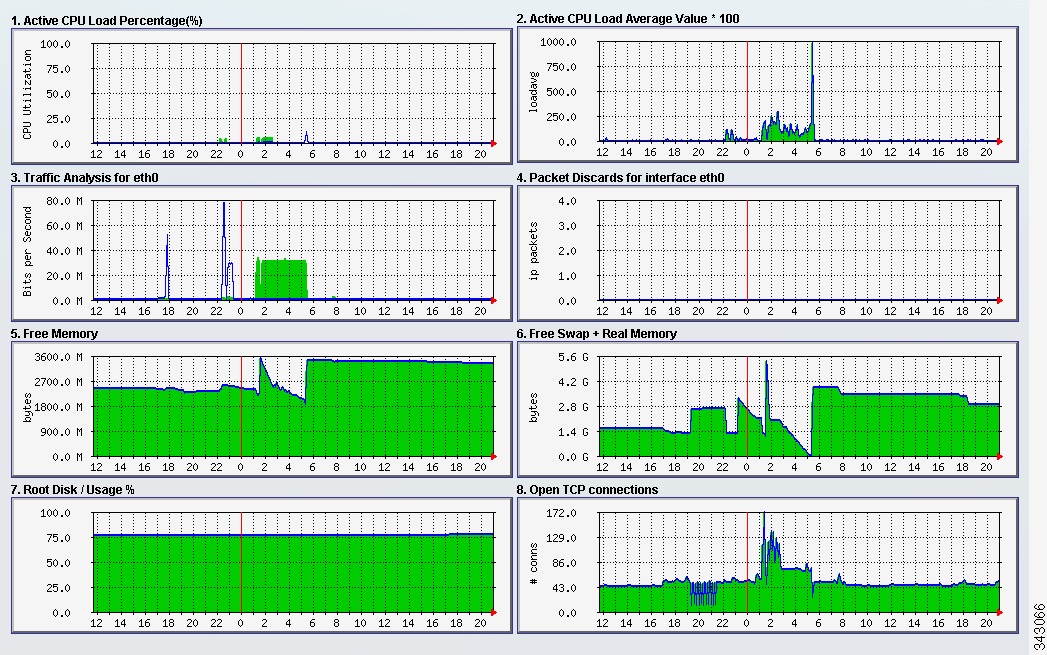
System Status
Click System Status in the left navigation to display statistics that are related to system status (see Figure 6-5).
Figure 6-5 Troubleshoot > System Status
The System Status page provides snapshots of the following:
•Active CPU Load Percentage
•Active CPU Load Average Value
•Traffic Analysis for <interface>
•Packet Discards for <interface>
•Free Memory
•Free Swap + Real Memory
•Root Disk / Usage %
•Open TCP Connections
Click each snapshot to reveal daily, weekly, monthly and yearly averages.
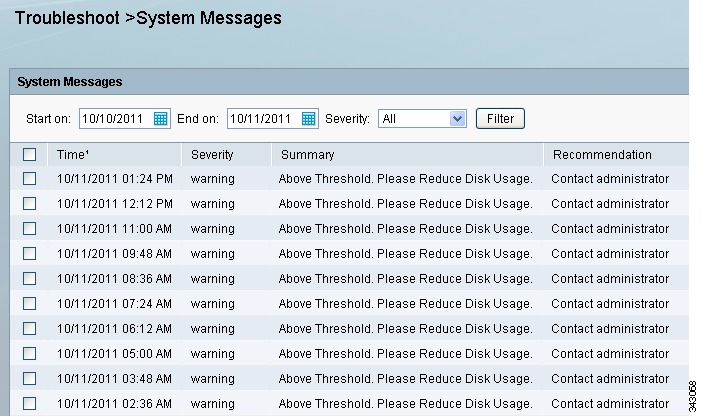
CTRS Alarms and System Errors Messages
You can view CTRS system messages in one of two ways:
•Click System Messages in the left navigation (see Figure 6-6). The System Messages page displays a list of messages.
Figure 6-6 Troubleshoot > System Messages
•From System Status at the bottom of the left navigation, click the icon for Warnings or Errors.
|
If you click the icon for Warnings, you will see endpoint alert information. Warnings are issued every 20 seconds when an endpoint crosses its packet loss threshold. If congestion continues for more than 40 seconds, the endpoint will be dropped.
|
|
If you click the icon for Errors, you will see endpoint drop information. Whenever an endpoint drops from high packet loss, an error is issued with the error code "CONGESTION."
|
The following table provides field descriptions for all system error and warning displays:
Table 6-4 System Error Field Descriptions
Field
|
Description
|
Time
|
Displays the time at which the condition occurred.
|
Severity
|
Indicates the severity level of the error. There are eight severity levels as follows:
•Emergency
•Alert
•Critical
•Error
•Warning
•Notice
•Info
•Debug
|
Summary
|
Message describing the error.
|
Recommendation
|
Recommended action to deal with the condition.
|
•To delete one of the system error messages, click the radio button to the left of the table entry, and then click Clear.
•To delete all error messages displayed, click Clear All.
Log Files
Click Log Files in the left menu to display or modify log information (see Figure 6-7).
Figure 6-7 Troubleshoot > Log Files
Use the Log File page to set severity levels for alarms associated with specific system processes, to filter log files displayed, and to download log files.
Configuring the Severity Level of System Error Messages
To configure the severity level of system level error messages and alarms for specific process areas:
Step 1 Click Log Files under Troubleshooting in the left menu to access the Log Files page.
Step 2 At the top of the Log Files page, there is a table listing the following CTRS system processes:
•CCS
•Post Processor
•Execution Manager
•Media Processor
•Key Exchange
•Transcode Processor
To the right of each process is a drop-down menu with these severity levels:
•CRIT
•DEBUG
•ERROR
•INFO
•OFF
•WARN
Click the down arrow to display the defined levels of severity. Choose the level at which logs are captured.
Note Log levels create varying amounts of data; for example, DEBUG creates more log entries than CRIT. Because verbose logs can impact system performance, use verbose logs only to track a problem.
Filtering the Log File Table Listings
To filter the log files displayed in the Log File Table:
Step 1 Click Log Files under Troubleshooting in the left menu to access the Log Files page.
Step 2 Click the down arrow to the right of Processes to display a list of CTRS processes. Click a specific process on which to filter log files. Choices are the following:
•All
•Alarm-Logs
•CCS
•CDR-Logs
•Core
•CTRS-Sysop
•Exe-Exchange
•Media-Processor
•Post-Process
•SIP
•Web-UI
•Transcode-Processor
Step 3 Click the Filter button to display the logs files associated with the chosen process.
Downloading Log Files
To download log files from the Log File table:
Step 1 Click Log Files under Troubleshooting in the left navigation.
Step 2 At the bottom of the Log Files page is the Log File list. The table is organized as described in Table 6-5.
Table 6-5 Log Table Field Descriptions
Field
|
Description
|
Filename
|
Filename of the log file. Click the arrow to change the order (descending, ascending based on alphabetical order of the filenames) in which the log files are displayed.
|
Process
|
CTRS system process area. Click the arrow to change the order (descending, ascending based on alphabetical order of the processes) in which the log files are displayed.
|
Last Modified
|
Time (Greenwich Mean Time, Pacific Standard Time) at which the log file was collected. Click the arrow to change the order (descending, ascending based on time) in which the log files are displayed.
|
Size
|
Size (in kilobytes) of the compressed log file.
|
Step 3 Click the filename of a log file to download that file. Click the Download All button to download all log files listed.

 Feedback