-
Converged Plantwide Ethernet (CPwE) Design and Implementation Guide
-
Preface
-
Converged Plantwide Ethernet Overview
-
Converged Plantwide Ethernet Solution
-
CPwE Solution Design—Cell/Area Zone
-
Solution Design—Manufacturing and Demilitarized Zones
-
Implementing and Configuring the Cell/Area Zone
-
Plant Network Security and the Demilitarized Zone
-
Testing the CPwE Solution
-
CIP Motion
-
CIP Sync Sequence of Events
-
DHCP Persistence in the Cell/Area Zone
-
Key Terms and Definitions
-
Test Result Analysis
-
Complete Test Data
-
Configurations
-
Reference Documents
-
Table Of Contents
Impact of the Number of Switches (RMC8 vs. RMC16)
Spanning Tree Protocol Comparison (RMC8 vs. RPC8)
Topology/Resiliency Protocol Analysis
Topology/Resiliency Protocol Analysis—Copper Uplinks (RMC8, SMC8, SEC8, SFC8)
Topology/Resiliency Protocol Analysis—Fiber Uplinks (RMF8, SMF8, SEF8, SFF8)
Media Analysis—Copper vs Fiber (RMC8 vs. RMF8 & SMC8 vs. SMF8)
End-Devices (MAC Addresses) Impact Analysis
End-Device Impact on Network Convergence for Spanning Tree Test Suites
End-Device Impact on Network Convergence for EtherChannel and FlexLinks Test Suites
Application Latency (Screw-to-Screw) Analysis
Test Result Analysis
This appendix provides some comparison and analysis of the test results in "Complete Test Data." The analysis summarizes and compare test cases from a variety of test suites to draw conclusions. These conclusions and the overall test approach are described in Chapter 7, "Testing the CPwE Solution." The key analysis includes the following:
•
Impact of the number of switches on network convergence in a ring topology (8 versus 16 switches)
•
•
•
•
•
•
The summary of the test case includes the following:
•
•
All of this information is valuable. As the purpose of this section is to compare the test results and draw conclusions, it is useful to compare some information between the test cases. Cisco and Rockwell Automation chose to use the MaxAvg as the best representation of network convergence between the test suites on which to draw conclusions. The minimum and maximum numbers, although informative, were not useful as a basis to analyze and draw conclusions. The average of the set of test iterations was also not used as this number varies significantly when some measurement points are more impacted than others depending on the test suite. The MaxAvg, therefore, was determined to be a better representation of network convergence when analyzing and drawing conclusions.
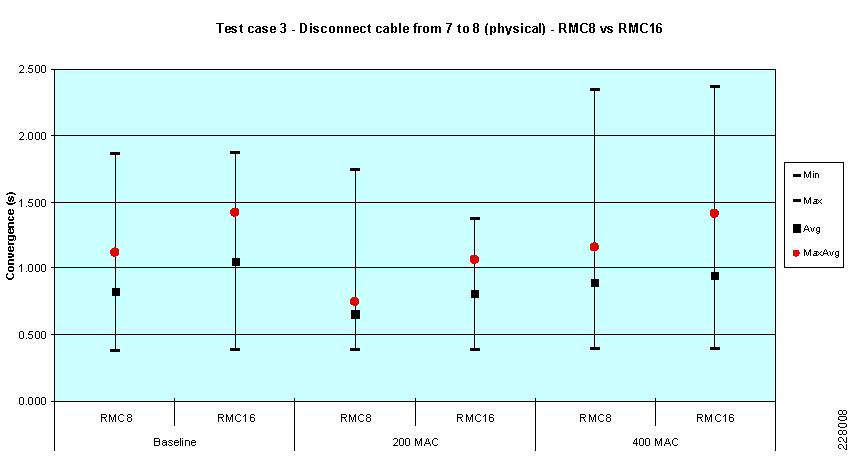
Impact of the Number of Switches (RMC8 vs. RMC16)
This section compares the network convergence for the 8- and 16-switch ring topologies with copper uplinks and MSTP as the resiliency protocol based on peer-to-peer (UDP unicast) traffic streams. This section provides tables that compare the following:
•
•
•
•
Note
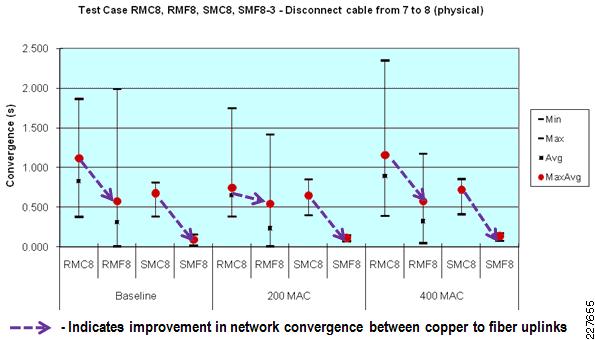
Figure B-1 shows the trend for physical cable disconnection (test case 3) between 8- and 16-switch ring topologies. In all cases, the number of switches slowed the network convergence of the STP. The same trend can be seen in the following failure test cases:
•
•
•
•
Figure B-1 Impact of Number of Switches—Test Case 3 Disconnect Cable
The key findings were as follows:
•
•
•
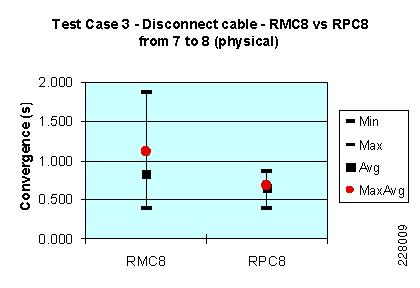
Spanning Tree Protocol Comparison (RMC8 vs. RPC8)
This section compares the MSTP and rapid PVST+ (RPVST+) STPs in 8-switch ring topologies with copper uplinks. This section provides tables that compare the following:
•
•
•
•
Table B-9 Test Case 1 - Bring link 7 to 8 down (software) - RMC8 vs RPC8
Table B-10 Test Case 2 - Bring link 7 to 8 up (software) - RMC8 vs RPC8
Table B-11 Test Case 3 - Disconnect cable from 7 to 8 (physical) - RMC8 vs RPC8
Table B-12 Test Case 4 - Reconnect cable from 7 to 8 - RMC8 vs RPC8
Table B-13 Test Case 5 - Root bridge down (physical) - RMC8 vs RPC8
Table B-14 Test Case 6 - Root bridge up (physical) - RMC8 vs RPC8
Table B-15 Test Case 7 - Stack Master down - RMC8 vs RPC8
Table B-16 Test Case 8 - Adding switch back to the stack - RMC8 vs RPC8
Figure B-2 shows the trend for physical cable disconnection (test case 3) for each compared test suite.
Figure B-2 Disconnect cable
The key findings are as follows:
•
•
In general, network convergence was fast enough in reestablishing links and restoring a switch in the switch-stack test cases to avoid peer-to-peer application timeouts. This suggests restoring connectivity may not require planned downtime for peer-to-peer applications. I/O (multicast-based) applications were not tested. See the "Restore Impact Analysis" section for more information.
Topology/Resiliency Protocol Analysis
This section compares the test results from the various topology and resiliency protocol test suites. The analysis is split into two sections to compare the copper and fiber media-uplink test suites. This section provides tables that compare the following:
•
•
•
•
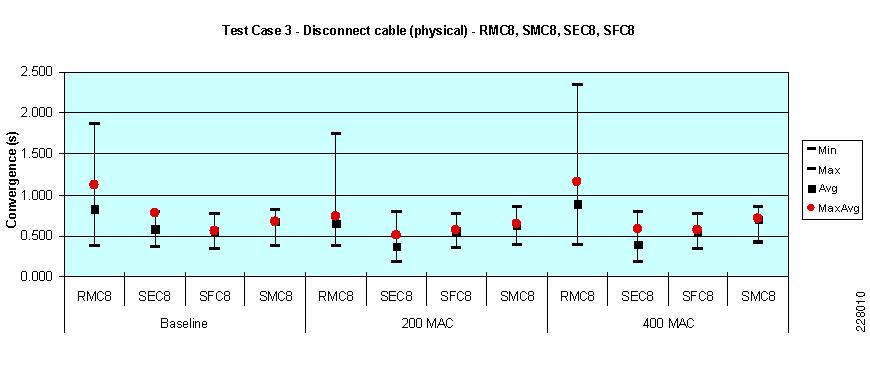
Topology/Resiliency Protocol Analysis—Copper Uplinks (RMC8, SMC8, SEC8, SFC8)
This section compares the topologies and resiliency protocols (MSTP, EtherChannel, and Flex Links) in 8-switch topologies with copper uplinks based on peer-to-peer (UDP unicast) traffic streams.
Figure B-3 shows the trend for physical cable-disconnection for the test suites compared.
Figure B-3 Disconnect Cable (Test Case 3)
NoteThe key findings are as follows:
•
•
•
•
•
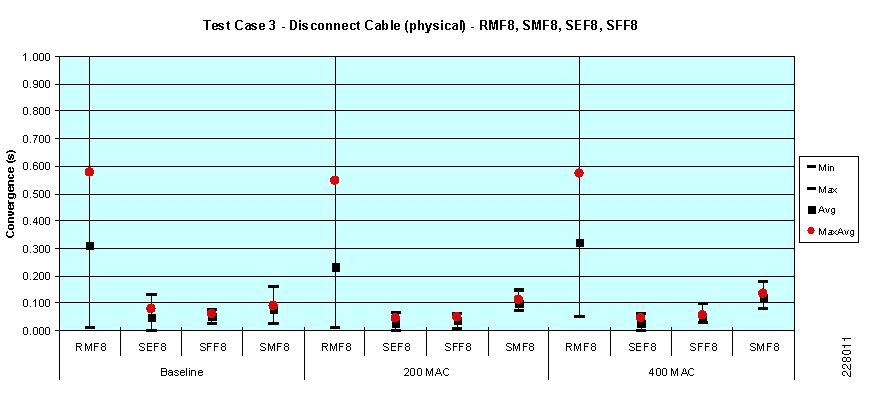
Topology/Resiliency Protocol Analysis—Fiber Uplinks (RMF8, SMF8, SEF8, SFF8)
This section compares the network convergence between topologies and resiliency protocols (MSTP, EtherChannel, and Flex Links) in 8-switch topologies with fiber uplinks based on peer-to-peer (UDP unicast) traffic streams followed by IO (UDP multicast) traffic streams.
Table B-34 shows the maximum measured convergence per test-iteration average (MaxAvg) for both unicast and multicast test streams and the frequency of application timeouts for each test case in EtherChannel and Flex Links test suites.
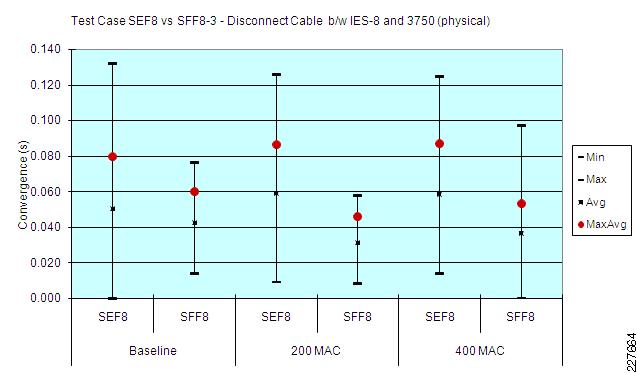
Figure B-4 shows the trend for physical cable-disconnection for the compared test suites with unicast test streams.
Figure B-4 Test case 3 - Disconnect Cable for RMF8, SMF8, SEF8 & SFF8 with Unicast Traffic
Figure B-5 shows the EtherChannel and Flex Links test results for test case 3 (disconnect cable with multicast test streams). In Figure B-5, the average network convergence is less than 100 ms, noting that in some test iterations the EtherChannel topology did converge >100 ms.
Figure B-5 Test Case 3 - Disconnect cable for SEF8 & SFF8 with Multicast Traffic
The key findings were as follows:
•
–
–
–
•
•
Media Analysis—Copper vs Fiber (RMC8 vs. RMF8 & SMC8 vs. SMF8)
This section compares the network convergence between copper and fiber uplinks when topologies (ring and redundant star) and resiliency protocol (MSTP) are the same, in 8-switch topologies based on peer-to-peer (UDP unicast) traffic streams. Only the link disruption test cases were compared as the other test cases were not conducted in all test suites (root switch failure) or not relevant (stack master failure) to the comparison. The results for the disconnect-cable were graphed to display the trend. This case was chosen to be the most representative of an outage. This section provides tables that compare the following:
•
•
•
•
Figure B-6 shows the trend for physical cable disconnection (test case 3) for copper versus fiber for MSTP in both a ring and redundant star topology. In each case, the fiber topology converged significantly faster, usually in the range of 0.5 seconds. This is an expected result as the standards for copper media allow for more tolerance in identifying a link outage than in a fiber media.
Figure B-6 Disconnect cable RMC8, RMF8, SMC8 and SMF8
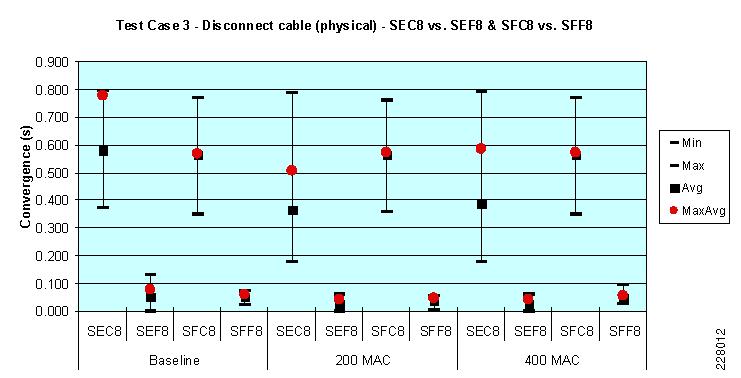
Figure B-7 shows the trend for network convergence after physical cable disconnection (test case 30) copper versus fiber in redundant star topologies with EtherChannel and Flex Link resiliency protocols. The impact of media type is more apparent with copper topologies converging nearly 0.5 seconds slower than fiber topologies.
Figure B-7 Disconnect cable SEC8 vs. SEF8 & SFC8 vs. SFF8
The key findings are as follows:
•
End-Devices (MAC Addresses) Impact Analysis
The analysis the impact the number of end-devices (or MAC addresses) have on the network is analyzed in this section. The analysis will review the trend based on the three MAC addresses cases tested: baseline, 200 MACs inserted, and 400 MACs inserted across the various test suites and test cases. The comparison is based on the "worst case convergence" result, which is the maximum measured convergence from each test run averaged for the set of test runs (MaxAvg). This section analyzes the test results for Spanning Tree test suites separately from the EtherChannel and Flex Links test suites.
End-Device Impact on Network Convergence for Spanning Tree Test Suites
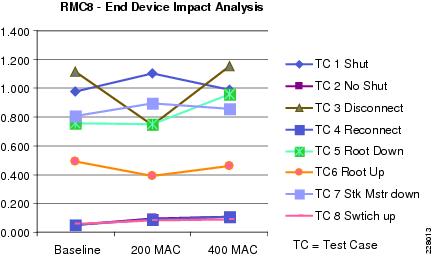
This section provides relevant test results from each Spanning Tree test suite in which test runs were conducted with varying amounts of MAC addresses inserted by the network traffic generator. For each test suite, a table of the maximum measured convergence from each test iteration (MaxAvg) is used and a graph of those numbers is included.
Figure B-8 RMC8 Trend of MAC Address Impact on Network Convergence
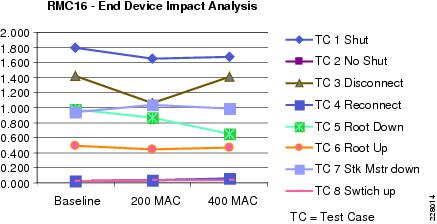
Figure B-9 RMC16 Trend of MAC Address Impact on Network Convergence
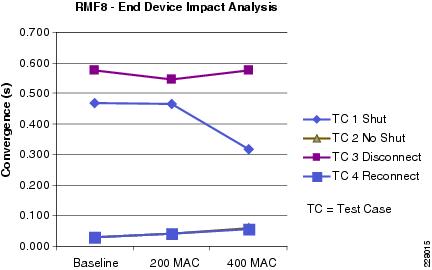
Figure B-10 RMF8 Trend of MAC Address Impact on Network Convergence
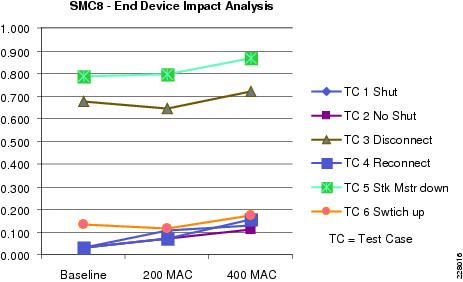
Figure B-11 SMC8 Trend of MAC Address Impact on Network Convergence
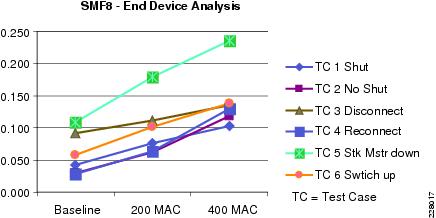
Figure B-12 SMF8 Trend of MAC Address Impact on Network Convergence
Based on the above graphs, only SMF8 shows a clear trend of increasing network convergence with increasing number of MAC addresses. Based on how STP works and the need to rebuild switching tables (which are MAC-based), there is an expectation that the number of MAC addresses increases the network convergence. The fact that this result is best seen in this test is explained in that redundant star with fiber uplinks has the lowest network convergence, where the MAC address impact is more readily observed. The tests suggest that this impact is not as significant as the media uplink and topology considerations and is somewhat overshadowed by the variance introduced by the topology and media uplink (especially copper).
End-Device Impact on Network Convergence for EtherChannel and FlexLinks Test Suites
This section provides relevant test results from each EtherChannel and Flex Links test suite, where test runs were conducted with varying amounts of MAC addresses inserted by the network traffic generator. For each test suite, a table of the maximum measured convergence from each test iteration (MaxAvg) and a graph of those numbers are included.
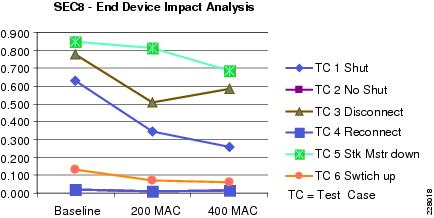
Figure B-13 SEC8 Trend of MAC Address Impact on Network Convergence
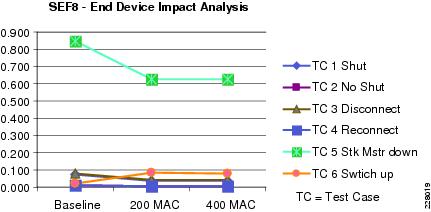
Figure B-14 SEF8 Trend of MAC Address Impact on Network Convergence
In the above EtherChannel examples, the test cases with link disruption (TC1 and TC2) showed the baseline, one MAC address in the measured test streams, to have a higher network convergence than in the other cases. That is to be expected as the link disrupted was the link on which the EtherChannel load balancing (based on source MAC address) was choosing for those single-MAC test streams. In the other test streams, the EtherChannel load balancing was balancing the traffic across both available links as multiple MAC addresses were used in the test streams, thereby lowering the measured network convergence as some of the traffic is not impacted by the link loss.
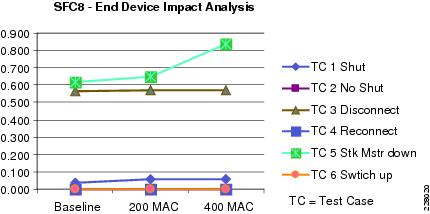
Figure B-15 SFC8 Trend of MAC Address Impact on Network Convergence
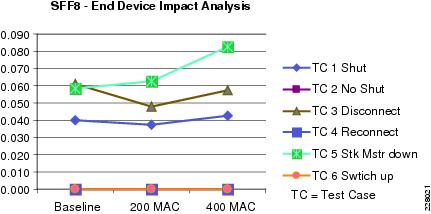
Figure B-16 SFF8 Trend of MAC Address Impact on Network Convergence
Based on the above figures, the number of end-devices has little or no impact on the network convergence. Based on how Flex Links and EtherChannel work and that no specific switching tables are rebuilt after a network event, there is an expectation that the number of MAC addresses has limited impact on the network convergence. In fact, in EtherChannel, due to the load balancing across the multiple links based on MAC address (either source or destination), a stream with a single MAC address versus with many MAC addresses converged more slowly as only one link is used to carry the stream with a single MAC address.
Note that this does not take into consideration an increase in overall network traffic, as the test streams used were at a constant packets per second rate.
The key findings are as follows:
•
•
Restore Impact Analysis
This section analyzes the network convergence and application timeout percentage for the restore test cases in each test suite. The test cases include the following:
•
•
•
In one RMC8 testing environment, the safety I/O devices were configured to timeout in much less than 100 ms, causing the increase in application timeouts. In this test suite, the measured average network convergence suggests much fewer time-critical application timeouts would have been measured if the devices were configured differently.
The key findings are as follows:
•
•
•
Application Latency (Screw-to-Screw) Analysis
The various test runs of the screw-to-screw tests are summarized in Table B-53. The table shows that the application latency and jitter due to additional IE switches are relatively insignificant compared to the overall IACS network application latency and jitter. The additional latency per-switch hop was approximately 10 µs in the test cases. Table B-53 lists the test results from the screw-to-screw test runs.
The key findings are as follows:
•