-
Cisco Prime Performance Manager User Guide, 1.4
-
Preface
-
Prime Performance Manager Overview
-
Managing Gateways and Units Using the Command Line Interface
-
Managing the Web Interface
-
Integrating Prime Performance Manager with Prime Central
-
Discovering Network Devices
-
Managing Users
-
Managing Reports and Dashboards
-
Managing Devices
-
Managing Network Alarms and Events
-
Managing Thresholds
-
Displaying System Properties, Statuses, Messages, and Logs
-
Managing Gateways and Units
-
Configuring Prime Performance Manager for Firewalls
-
Backing Up and Restoring Prime Performance Manager
-
Prime Performance Manager and IPv6
-
Commands Reference
-
Predefined Thresholds
-
Glossary
-
Index
-
 Feedback
Table Of Contents
Managing Reports, Dashboards, and Views
Displaying Network and Device Reports
Creating Custom Device Star Graphs
Changing the Master Report Settings
Enabling and Disabling Reports
Exporting Reports in 3GPP XML Format
Editing Report Policy Parameters
Assigning Devices to Report Policies
Displaying Data Center Reports
Displaying Data Center Tenant Reports
Importing Tenants into Prime Performance Manager
Displaying Tenant Details and Reports
Displaying Data Center Resource Allocation and Trend Analysis
Setting up collectd Performance Monitoring
Setting Up Bulk Statistics Reports
Creating the Device Bulk Statistics Configuration
Removing Bulk Statistics Device Configurations
Adding New Bulk Statistics Schemas or Counters
Updating the Prime Performance Manager Bulk Statistics Schema File
Creating and Managing Custom Report Views
Adding Views to the Navigation Tree
Managing Large Numbers of Views
Creating and Managing Report Groups
Managing Reports, Dashboards, and Views
Prime Performance Manager provides over 4300 reports and dashboards covering many different network device hardware and software elements. You can change how report data is displayed, enable and disable reports, and create customized report policies for specific devices or groups of devices. In addition, you create your own custom report views and groups. These and other report features and functions are described in the following topics:
•
Changing the Master Report Settings
•
•
•
•
•
•
Displaying Reports
After Prime Performance Manager device discovery is completed (see Chapter 5 "Discovering Network Devices"), you can display reports by either choosing Reports from the Performance menu to display network reports or drill down to a device and display the device reports.
Note
Tip
At the network report level, the following report categories are displayed in the navigation area:
•
•
•
•
•
•
•
•
•
•
•
•
•
•
•
•
•
•
•
•
•
•
•
•
By default, all reports are disabled except for the following:
•
–
–
–
•
–
–
–
–
–
–
–
•
–
•
–
–
–
–
•
–
–
–
•
–
To enable reports, see Enabling and Disabling Reports.
At the device report level, only the report categories containing reports generated for the device are displayed. As you navigate through Prime Performance Manager reports, keep the following in mind:
•
•
•
The device time zone displayed in reports is obtained from one of the following:
1.
2.
3.
4.
For bulk statistics reports (Moble StarOS Statistics), the following notes apply:
•
•
•
Version-1.4.0,172.18.20.168,20120912-153526,20120912-113526,EDT,-0400,120912-11:35,
private
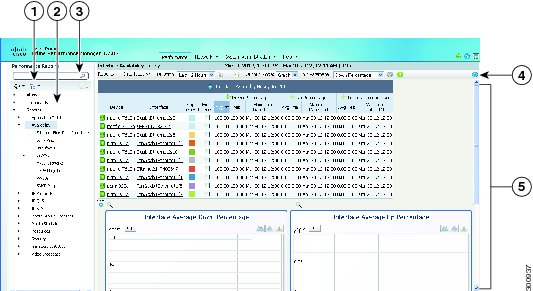
Figure 7-1 shows the Prime Performance Manager reports window with the Interface Availability report displayed in graph output format. Window elements include:
•
•
Note
•
Figure 7-1 Reports Window
Navigation tree display tools
Menu bar
Navigation tree
Content area (graph view)
Search field
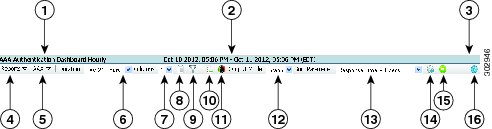
Reports Menu Bar
The reports window and menu bar (Figure 7-2) provide many tools and functions that allow you to display individual reports specific to your needs and interests. The window title bar displays the report name and report period. The report time period shows the time zone in TTT format (where TTT is the time zone, for example, EDT) for all network-level reports when the Display Device Level Data in Device Time Zone user preference is disabled. When the preferences is enabled and the report or dashboard is device level, the time zone is shown in GMT + hh:mm format. The duration is relative to the server or device time zone. For information about setting user preferences, see Customizing the GUI and Information Display.
The Reports menu bar allows you change the report presentation in many different ways to meet your personal preferences or to highlight data that is of special interest. The menu bar is context sensitive; items that appear depend on the report category and selected report. Menu bar report options include:
•
•
•
–
–
–
–
–
–
Note
•
Tip
•
–
–
–
–
Note
•
•
•
•
The Go Live option is not available for the following:
–
–
–
•
•
–
–
Note
•
•
–
–
•
•
•
Figure 7-2 Reports Menu Bar
Displaying Network and Device Reports
Displaying network and device reports is accomplished using very similar procedures. Prime Performance Manager allows you to easily navigate up and down the report hierarchy, from network-wide views to individual device and device element reports.
Note
Network-Wide Device Reports
To view a network-wide report:
Step 1
Step 2
The content area displays the default network report for the report category you selected. The default report is based on the sort weight Prime Performance Manager assigns to the report. For example, if you choose Availability > MPLS Networks, the MPLS Interface Availability hourly network report is displayed. If you choose Resources > CPU, the network CPU Utilization report is displayed.
Reports are displayed in graph format by default. For practicality, only ten devices are displayed in graph views by default. If more are available, the report includes Top N in the title. To view the other devices, switch to table view or use the Graph Series Editor described in Step 4 to add and remove devices.
To change the Top N display, you have two options:
•
•
•
Step 3
•
•
•
Note
Note
Step 4
•
–
–
–
–
–
–
•
•
•
–
–
Note
•
–
–
Note
•
Step 5
Individual Device Reports
Displaying device reports is similar to network device reports, with some navigation and option differences. To display a report for an individual device:
Step 1
All the devices polled by Prime Performance Manager are displayed.
Step 2
The content area displays the default report for the device you selected. The default is based on the sort weight Prime Performance Manager assigns to the report.
Reports are displayed in graph format by default.
Step 3
•
•
Step 4
•
–
–
–
–
–
–
•
–
–
–
–
–
–
•
•
–
–
•
–
–
–
Live mode continues as long as you remain on the device page, or until you click End Live Mode. If you move away from the device window to another window, Live Mode stops. To start it, return to the device report and click Live Mode.
Note
Note
Note
•
–
Note
–
•
Step 5
Related Topics
Changing the Master Report Settings
Customizing Report Display
Prime Performance Manager provides many options to control the report information and how it is presented. The Graph report output provides options that allow you to customize the display to highlight report data or to suit your personal preferences. For example:
•
•
•
•
Note
•
•
Tip
•
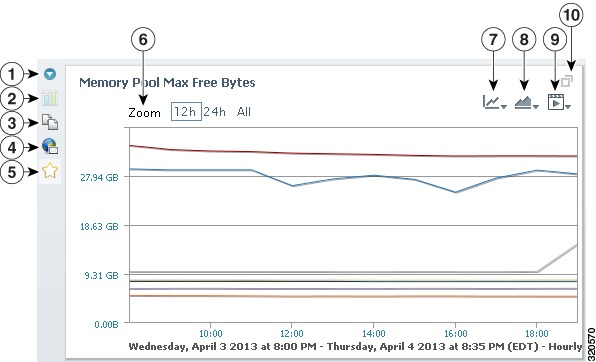
Inside the graphs are tools you can select to modify the graph display:
•
–
–
–
–
–
•
–
–
–
–
–
–
–
–
–
–
–
–
•
Figure 7-3 Graph Display Options
Hide Row
Zoom
Toggle Related Threshold
Aggregate lines
Copy to Clipboard
Graph style options
Email report
Export graph options
Add to Star Graph
Show Graph in Fullscreen
For example, you can choose whether you want the minimum, maximum, average, total, and current data values displayed in graphs and summary tables. In other words, for any data item, the minimum value for the report period, maximum value, average, total, and current values can be displayed. In addition, you can enable or disable the graph vertical data point bar, change the graph height, or display only one graph column per report.
Tip
The time span bar is another option you can use to reduce the time span within a graph so you can view intervals of interest in greater detail. By default, the time span bar is displayed in all full screen graphs. However, it can be enabled so that it appears on all report graphs.
To display the time span bar:
Step 1
The graph is displayed in full screen.
Step 2
These and many other options are provisioned in the User Preferences window. For information, see Customizing the GUI and Information Display.
Creating Custom Device Star Graphs
At the device report level, you can pick individual report graphs and add them to the Star Graphs tab to create a customized, device-level report view.
To create a custom device hot graph:
Step 1
Step 2
Step 3
The report is displayed in graph output format by default.
Step 4
The graph is automatically added to the Star Graphs tab.
Step 5
Note
Step 6
Report items in the Star Graphs view remain until you delete them.
Step 7
Filtering Report Information
You can filter report information to display data within certain numeric or alphabetic parameters, for example, to display a down percentage 80 and higher.
Note
To filter report information:
Step 1
Step 2
Step 3
•
Note
•
–
–
–
–
–
–
•
–
–
–
Note
Step 4
Step 5
The report displays the filtered information.
Step 6
a.
b.
c.
d.
The report displays the full report information.
Emailing Reports
You can set up schedules to have Prime Performance Manager automatically email report, view, or dashboard graph image to individuals. The emails can be sent at regular intervals on an ongoing basis, or they can be sent for a set number of times.
To email reports, complete the following procedures:
Creating a Mail Report
You can create report emails for report graphs or tables in the views, dashboards, network or device reports, or star graphs. Creating a report email creates a schedule for sending a report, view, or dashboard graph to individuals by email. Graphs can be included as attachments or embedded in the email in PNG, JPG, GIF, or PDF format.
To create a report email:
Step 1
a.
b.
Step 2
Step 3
Step 4
•
•
Step 5
General Information—Provides general report information:
•
•
•
•
•
–
–
For example, if your gateway server is gateway_123, your ReportMail is named SampleReport, and you type $name from $server in the Subject field, the email subject will be SampleReport from gateway_123.
Output—Defines the report output and email delivery.
•
–
–
–
–
PNG produces the best overall results, depending on the graph complexity, so is the format you should generally use. PDF is not recommended for complex reports or views with multiple graphs, GIF image quality is lower overall.
•
•
•
Note
Applicable—Defines the report timeframe or frequency.
•
–
–
–
–
–
•
•
Beneath the Start Date, choose the days you want the report run. The days selected are another way to restrict when emails are sent. If the day is selected, emails are sent. If the day is not selected, no emails are sent.
In other words, all selected criteria must be met for an email to be sent. The day must be selected, the date has to be in range (if dates are specified), the time of day has to be between the times specified (if they are not set to the same time).
•
•
•
Note
Note
Step 6
The report is added to the Network Report Mail Editor screen.
Step 7
Related Topics
Managing Mail Reports
You can manage mail reports from the Network Report Mail Editor. The editor displays all the mail reports that have been created in Prime Performance Manager and allows you to view, edit, enable, disable, and delete individual reports:
To manage email reports:
Step 1
Step 2
•
•
•
•
•
•
•
•
Tip
For parameter descriptions, see Creating a Mail Report.
Step 3
•
•
The Duplicate Report Mail dialog appears. All entries are identical to the original report, but "_duplicate" is appended to the report name. Edit any parameter, including the provided default name, which must be should be unique, then click OK to create the new report. For parameter descriptions, see Creating a Mail Report.
•
•
•
Changing the Master Report Settings
You can provision report intervals and report aging parameters and apply them to all Prime Performance Manager reports from the Performance > Reports > Administration Report Settings window. The master report settings allows you to set up the broad rules for report generation and management. These rules can be overridden at the individual report level, for example, you might decide not to enable 1-minute reports as a global setting, but enable 1-minute reports for certain critical areas.
To provision the master report general and aging settings:
Step 1
The Administration Report Settings window displays the general and aging report settings.
Step 2
Step 3
Step 4
Step 5
Table 7-1 Historical Statistics Report Settings
General Settings
Reports Directory
Directory where Prime Performance Manager stores reports. The default is /opt/CSCOppm-gw/reports. You cannot edit this field. To change the reports directory, use the ppm repdir command. See ppm repdir.
Time Mode
The report time mode, either 12-hour or 24-hour (default).
Master Report Flag
Enables or disables report generation for all reports:
•
•
1 Min Report Flag
If enabled, 1-minute reports are generated. If you enable 1-minute reports, you must:
•
This field is disabled by default.
5 Min Report Flag
If enabled, 5-minute reports are generated. This field is disabled by default.
15 Min Report Flag
If enabled (default), 15-minute reports are generated.
Hourly Report Flag
If enabled (default), hourly reports are generated.
Daily Report Flag
If enabled (default), daily reports are generated.
Weekly Report Flag
If enabled (default), weekly reports are generated.
Monthly Report Flag
If enabled (default), monthly reports are generated.
Export Reports
If enabled, automatically generate reports in CSV and 3GPP XML format and stores them in the /opt/CSCOppm-gw/reports directory. This field is disabled by default.
Note
Generate DB Reports
If enabled (default), automatically generate reports and stores report data in the report database.
Export Hourly 5 Minute CSV Reports
If enabled, automatically generates hourly 5-minute reports in CSV format and stores them in the /opt/CSCOppm-gw/reports directory. This field is disabled by default.
Export Hourly 15 Minute CSV Reports
If enabled, automatically generate hourly 15-minute reports in CSV format and stores them in the /opt/CSCOppm-gw/reports directory. This field is disabled by default.
Perform Disk Space Checking
Enables or disables disk space checking. Disk space usage increases with every enabled report. The increase depends on the report, the number of devices, and their configurations. Monitor disk space usage and disable the reports for specific devices or decrease the aging value to delete old reports frequently.
Aging Settings1
1 Min Stats Aging (Days)
Database aging value for 1-minute statistics. The default is 2 days.
5 Min Stats Aging (Days)
Database aging value for 5-minute statistics. The default is 4 days.
15 Min Stats Aging (Days)
Database aging value for 15-minute statistics. The default is 7 days.
Hourly Stats Aging (Days)
Database aging value for hourly statistics. The default is 7 days.
Daily Stats Aging (Days)
Database aging value for daily statistics. The default is 94 days.
Weekly Stats Aging (Days)
Database aging value for week statistics. The default is 730 days.
Monthly Stats Aging (Days)
Database aging value for monthly statistics. The default is 1825 days.
1 Min CSV Aging (Days)
Database aging value for 1-minute CSV statistics. The default is 2 days.
5 Min CSV Aging (Days)
Database aging value for 5-minute CSV statistics. The default is 3 days.
15 Min CSV Aging (Days)
Database aging value for 15-minute CSV statistics. The default is 7 days.
Hourly CSV Aging (Days)
Database aging value for hourly CSV statistics. The default is 14 days.
Daily CSV Aging (Days)
Database aging value for daily CSV statistics. The default is 94 days.
Weekly CSV Aging (Days)
Database aging value for weekly CSV statistics. The default is 730 days.
Monthly CSV Aging (Days)
Database aging value for monthly CSV statistics. The default is 1825 days.
Bulk Stats Aging (Days)
Specifies the aging value for bulk statistic files in the drop directory. The age is the age of files received, not a database age. The default is 14 days.
1 When records exceed the specified value, they are aged out of the database.
Enabling and Disabling Reports
While you can apply report settings to all Prime Performance Manager reports (see Changing the Master Report Settings), you can also apply many of the same settings to the report categories and individual reports. For example, you might want to enable and disable all Application Traffic reports or all Availability reports. Within a report category, you can enable or disable reports at specific intervals. Report intervals include 1-minute, 5-minute, 15-minute, hourly, daily, weekly, and monthly intervals. All reports and report intervals are enabled by default except for 1-minute and 5-minute reports, which are disabled by default.
Report data options include the ability to generate report data in CSV format, and the ability to indicate whether report data should be storied in the database.
When modifying reports and report intervals, keep the following in mind:
•
•
•
To enable or disable reports or change report intervals:
Step 1
The Administration Reports Status table displays the high-level report categories and their status: enabled (check box left of the report category is checked) or disabled (check box is not checked).
Step 2
Step 3
•
Note
Note
Note
•
–
–
Table 7-2 lists the report data options.
•
•
Step 4
Step 5
Note
Capability Polling
The Prime Performance Manager capability polling feature polls devices to see what MIBs the device supports, then determines the reports the device is capable of supporting. Capability polling occurs once a day. It also occurs when users request a poll, or when a device is rebooted or has a configuration change, such as a new card installation.
By default, capability polling is enabled in optimized mode. This means capability polling is only conducted for device reports that are enabled at the master or individual device report levels. This means when you display individual device reports, only the reports that are enabled at the master or individual device report levels are displayed.
For performance, leaving capability polling optimization enabled is recommended. However, in certain scenarios, for example, in a lab environment where device configurations and capabilities change frequently for testing, you can use the ppm optimizecapabilitypoll command to disable capability polling optimization. This would allow users to see what set of reports could be enabled for a given device as well as the reports that are enabled. For information, see ppm optimizecapabilitypoll.
Exporting Reports in 3GPP XML Format
CSV is the default format for exported Prime Performance Manager reports. You can change the format to 3rd Generation Partnership Project (3GPP) XML format. To change CSV to 3GPP XML:
Step 1
Step 2
/opt/CSCOppm-gw/bin/ppm statreps csvnames 3gpp/opt/CSCOppm-gw/bin/ppm statreps expformat xmlStep 3
Step 4
Step 5
Step 6
Step 7
Step 8
•
•
•
•
•
•
•
Creating Report Policies
You can create report policies to customize report attributes for certain device types or individual devices. For example, you might decide if you want to enable or disable reports based on the device type, or set custom report intervals to a device type or specific devices. Devices discovered during device discovery are assigned the standard report policies. However, you can:
•
•
Related Topics
•
•
Editing Report Policy Parameters
By default, all devices are assigned to a report policy created for the device type. To edit the parameters of an existing report policy:
Step 1
Step 2
The Administration Report Policies tab displays the existing report policies.
•
–
–
–
•
Step 3
The Edit Report Policy: devicegroup window appears. This is the same window that is displayed when you click the Report Status tab. However, changes that you make here only apply to the device group that you selected, whereas changes made in the Report Status tab apply to all devices.
Step 4
•
•
–
–
–
–
–
–
–
Note
Tip
Step 5
Creating a New Report Policy
To create a new report policy:
Step 1
Step 2
Step 3
Step 4
Step 5
Step 6
Assigning Devices to Report Policies
By default, Prime Performance Manager creates device type report policies and assigns devices to them based on their device type. You can create custom report policies and reassign the devices to them.
To assign a device to a custom report policy:
Step 1
Step 2
Step 3
Step 4
Step 5
•
•
•
•
Step 6
Displaying Report Definitions
Prime Performance Manager cover many networking devices and technologies. To view the underlying XML definitions for a report, from the Help menu, choose Reports, then click Report XML Definitions. The README-Reports-system.html file is displayed. It provides the MIB tables and the fields that are polled to retrieve data from the device. It also describes the fields that are mapped to the report columns.
README-Reports-system.html is located in the /opt/CSCOppm-gw/etc/pollers/system or /opt/CSCOppm-gw/etc/pollers/user directories. Administrator access is required to edit the report definitions.
Should the provided Prime Performance Manager reports not meet all of your needs, you can create new ones using the provided reports as examples. For information about creating new reports, see the Cisco Prime Network 1.4 Integration Developer Guide.
Note
Displaying Data Center Reports
Prime Performance Manager supports many data center networking, computing, storage, virtualization, and management devices and technologies. To display data center reports, from the Performance menu, choose Views. Supported data center devices and technologies are displayed in a Data Center view. Table 7-3 lists the data center devices and technologies that Prime Performance Manager supports.
In the Prime Performance Manager GUI, data center features are listed under Views and Reports. Under Views, a default Data Center view is provided. It includes:
•
–
–
–
•
–
–
–
–
–
–
•
Under Reports, the following data center report categories are provided:
•
–
–
–
–
–
•
–
–
–
–
In addition, Prime Performance Manager supports a number of Data Center technologies that require special setup procedures, described in the following topics:
•
•
Displaying Data Center Tenant Reports
Prime Performance Manager supports multitenant software architectures and technologies including Cisco Network Segmentation Manager (NSM) and OpenStack. NSM integrates VMware vCloud Director 1.5 with the Cisco Nexus 1000V for networking management. OpenStack is a cloud operating system that controls large pools of compute, storage, and networking resources throughout a data center.
To display tenant reports, perform the following tasks:
•
•
•
•
Importing Tenants into Prime Performance Manager
To import tenants into Prime Performance Manager and display the tenant reports:
Step 1
ppm manage datacenter statusIf the status is inactive, complete the following steps:
a.
ppm manage datacenter enableb.
Step 2
Step 3
Step 4
•
•
Step 5
•
•
•
•
•
•
•
Step 6
The Tenant Sync in Progress message appears. The import takes a few minutes to complete. To check on its progress, from the System menu, choose Messages. The status is displayed as OpenStack Sync Task and NSM Sync Task messages. Completion is indicated with: OpenStack (or NSM) Inventory Import: Task successfully completed. If the import fails, a dialog appears with the details.
Displaying Tenant Details and Reports
To display tenant details and reports:
Step 1
Step 2
The System Tenants window displays the tenants that are integrated with Prime Performance Manager.
Step 3
The tenant name, description, type, and last successful import data are displayed on the Tenant Details tab.
Step 4
The Tenants Reports tab displays reports specific to the selected tenant.
Step 5
•
Provides a unified structure for each tenant even if tenants were imported from different cloud systems.Tenant performance data is divided into Network and Compute categories. Essentially, Views > Tenants provides a visual map for tenants management.
•
Lists all Prime Performance Manager tenant reports. In this release, ESXi, VLAN, VRFs reports are available. Reports list the Top 10 (by default) tenants data.
Note
Displaying Data Center Resource Allocation and Trend Analysis
The data center group report allows you to see a profile of your network data center VMWare vCenter servers and perform trend analysis to predict future capacities, availabilities, and other resource allocations. vCenter allocations that you can track and analyze future trends for include:
•
•
•
•
–
–
–
•
–
–
–
–
To display data center resource allocation:
Step 1
a.
b.
c.
Step 2
Step 3
•
•
•
•
•
•
These reports are enabled by default. If they are not enabled, check the Enabled checkbox then choose Enable Selected Groups from the Actions menu.
Step 4
Step 5
a.
Wait until enough data is aggregated in the group reports. A minimum of 12 data points are needed in these reports.
b.
c.
Setting up collectd Performance Monitoring
collectd is a computer background process that collects system performance statistics. These statistics can be used for performance analysis and capacity planning.
To monitor collectd statistics in Prime Performance Manager, you must first complete the following steps,
Step 1
•
•
•
Step 2
PATH=$PATH: /opt/rrdtool-1.4.7/binStep 3
LoadPlugin rrdtool<Plugin rrdtool>DataDir "/var/lib/collectd"CacheTimeout 120CacheFlush 900RRARows 1RRATimespan 3600</Plugin>The DataDir parameter must be configured with /var/lib/collectd by default. If you want to change the default rrdtool data output directory, change DataDir here and then modify the XMP_PAL.properties under $PPM_INSTALLATION/properties/. You must modify this file both on gateway and unit, then restart them.
# collectd base directory to store the rrd filesCOLLECTD_BASE_DIR = /var/lib/collectd/Step 4
LoadPlugin apache<Plugin apache><Instance "local">URL "http://localhost/server-status?auto"</Instance></Plugin>LoadPlugin mysql<Plugin mysql><Database example>Host "localhost"Socket "/var/lib/mysql/mysql.sock"User "root"Password ""Database "example"</Database></Plugin>Step 5
Step 6
Step 7
Setting Up Netflow Reports
Prime Performance Manager can generate Netflow data reports. NetFlow is a push model. Devices are configured to export IP packets to the Netflow collector on the Prime Performance Manager unit. The unit processes incoming Netflow packets and generates data for reports. Prime Performance Manager supports:
•
•
•
The IP address of the NetFlow collector and the destination UDP port must be configured on the sending router. The IP address of the NetFlow collector is the IP Address of the unit server. The destination UDP port needs to a port available on the unit. All configured devices must send NetFlow packets to the same single unit UDP port.
Note
Note
To set up Prime Performance Manager for Netflow reports:
Step 1
Step 2
Step 3
Step 4
Step 5
•
•
•
Step 6
Step 7
a.
b.
c.
Note
Setting Up Bulk Statistics Reports
Prime Performance Manager retrieves report data for most devices using SNMP to poll the device MIBs containing the performance data. Some devices, such as the Cisco ASR 5000 and Cisco ASR 5500, provide less SNMP support and few MIBs, so few statistics can be gathered using SNMP. However, you can generate reports for these devices using bulk statistics. Bulk statistics are statistics collected in a groups, called schemas, at regular intervals. The device sends the schemas to a specified location as comma separated value (CSV) files. Prime Performance Manager picks up the files and generates the reports. Each schema contains many performance data variables called counters.
The Cisco ASR 5000 and ASR 5500 devices can be configured to collect bulk statistics and FTP them to a collection server (remote folder). To generate reports from the bulk statistics, you must configure the device to generate the bulk statistics in the specific format expected by Prime Performance Manager and set up Prime Performance Manager so it can read the CSV files generated by the device.
To set up Prime Performance Manager for bulk statistics:
Step 1
Step 2
Step 3
Note
Note
Step 4
The drop location for the files is configured in the device config using the CLI "remotefile" format. Verify the devices actually FTP the bulk statistics CSV file to this location. If files are not received at the drop directory, verify the directory has the proper permissions and the login user name and password provided in the device configuration is valid.
Tip
Step 5
The example schema definitions below show incomplete counters at the end.
PPM,system,systemSch55,1349867400,20121010,071000,1702713,0,,%dPPM,system,systemSch56,1349867400,20121010,071000,1702713,,0,%disc-reasonPPM,system,systemSch6,1349867400,20121010,071000,1702713,,,,,0,606734,%sess-s
Tip
Bulk statistics samples with complete counter names enclosed within % symbols are acceptable. These are counters that are obsolete and not supported in the current Star OS version. Prime Performance Manager ignores these counters and used the default data type value for processing. For example, %cpu3-cpuused-user% is an obsolete or unsupported counter in the following:
PPM,card,cardSch3,1346768700,20120904,142500,928325,1,0,0,0,%cpu3-cpuused-user%,0.00,0.00,
0.00,0.00,0.00,0.00,0.00,0.00,0.00,0.00,0.00,0.00,0.00,0.00,0.00,0.00,0.00,
Step 6
/opt/CSCOppm-unit/bin/ppm csvdrop [dir]When you install the unit, the default drop directory location is /opt/CSCOppm-unit/csvdrop/. Use the ppm csvdrop command to point to the directory where bulk statistics samples are received from the Cisco ASR 5000 and Cisco ASR 5500 devices. The command updates the CSV_DROP_DIR property in BulkStats.properties located in /opt/CSCOppm-unit/properties. Restarting the unit is not necessary; the property changes takes effect automatically.
Use the same drop directory for all Cisco ASR 5000 and Cisco ASR 5500 devices in the network. The %host% variable in the filename helps to uniquely identify each device.
Step 7
Prime Performance Manager might raise bulk statistics alarms. See Bulk Statistics Alarms for alarm descriptions and actions to resolve them. The unit console and message log files in /opt/CSCOppm-unit/logs/ are also be a good place to view possible errors.
Step 8
a.
b.
c.
d.
–
–
–
Prime Performance Manager processes new files in the drop directory when they arrive. If the file name format is valid, Prime Performance Manager processes the new files for enabled Star OS reports.
If parameters are missing in the file name or the headers and footers in the bulk statistics samples do not match the property file values, marker files are created in the drop directory. The files have zero size and have the same name as the file in error but are appended with an error extension.
If multiple sample files are collected in the drop directory, Prime Performance Manager processes from the oldest to latest sample. Prime Performance Manager processes about 50 files at a time until it catches up with the recent files. Daily statistics can be looked up for older time range if necessary.
Note
Step 9
a.
b.
c.
PPM,system,systemSch71,%epochtime%,%localdate%,%localtime%,%uptime%,%disc-reason-490%,
%disc-reason-491%,%disc-reason-492%,%disc-reason-summary%,,,,,%swversion%,%peak-cpuusa
ge%,%peak-memusage%,,%system-capacity-usage%,%session-capacity%,%session-capacity-usag
e%,%npu-capacity%,%npu-capacity-usage%,%sess-max-lastreset-time%,,,,
PPM,system,systemSch71,1349964000,20121011,100000,3595,0,0,0,,,,,,14.0,15.61,11291412. 00,,0.06,10137600,6095,1207959552,608208,Never,,,,
Creating the Device Bulk Statistics Configuration
The ppm starbuild command builds the StarOS bulk statistics device configuration with the desired schemas and counters. Prime Performance Manager requires bulk statistics files to be in a very specific format. This command generates the device configuration in the format that Prime Performance Manager expects. The command generates the configuration that you must copy to the Cisco ASR 5000 and Cisco ASR 5500 devices. The command format is:
/opt/CSCOppm-gw/bin/ppm starbuild <schemafilename>The input, schemafilename, is the CSV file with the bulk statistics schema and counters that need to be configured on the devices. Prime Performance Manager includes a full schema file for StarOS 14.0 that supports all the EPC counters. It is located in the install directory:
/opt/CSCOppm-gw/install/ASR5K_BulkStats_Schemas_Counters-staros14-epc.csv
Prime Performance Manager expects the filenames to be in the following format:
%host%_bulkstats_%localdate%_%localtime%_%localtz%_5_5.csv%host%, %localdate%, %localtime%, %localtz% are common bulk statistics counter variables.
Prime Performance Manager uses the %host% variable to identify the device. This is usually the device sysName. The "_5_5" at the end of the file name is the sample and transfer interval set on the device.
To build the StarOS device configuration:
Step 1
Step 2
/opt/CSCOppm-gw/bin/ppm starbuild
/opt/CSCOppm-gw/install/ASR5K_BulkStats_Schemas_Counters-staros14-epc.csv
Step 3
Enter the IP Address of Prime Performance Manager unit To Send Files To:Step 4
Note
Enter File Directory On Prime Performance Manager unit To Drop Files To:Step 5
Enter Output Filename To Write StarOS 14.0 Config To: staros14-bulkstats-config.txt
Note
Removing Bulk Statistics Device Configurations
To remove bulk statistics configurations from a device on a per schema basis:
Step 1
Step 2
/opt/CSCOppm-gw/bin/ppm starbuild
/opt/CSCOppm-gw/install/ASR5K_BulkStats_Schemas_Counters-staros14-epc.csv -no
The output configuration file is created in /opt/CSCOppm-gw/bin/ folder by default. The file contains the delete CLIs for all the available schemas.
Adding New Bulk Statistics Schemas or Counters
If config needs to be generated for a smaller subset of schemas or if new schemas need to be added, modify the spreadsheet included in the install directory.
/opt/CSCOppm-gw/install/ASR5K_BulkStats_Schemas_Counters-staros14-epc.xlsxAfter the changes are complete, update the CSV file in the install folder by saving the spreadsheet in comma separated format and execute the ppm starbuild command to generate the revised configuration.
Note
Updating the Prime Performance Manager Bulk Statistics Schema File
To add a new schema or counter to an existing Prime Performance Manager report or to a new report, you must update the gateway schema file. Prime Performance Manager looks up this schema file to identify the format in which the devices are configured.
Note
To generate the schema file for Prime Performance Manager:
Step 1
Step 2
/opt/CSCOppm-gw/bin/ppm starbuild
/opt/CSCOppm-gw/install/ASR5K_BulkStats_Schemas_Counters-staros14-epc.csv -ppm
Step 3
Enter Output Filename To Write PPM Schema:staros14-ppm-bulkstatsschema.csvPPM Schema File Written To: staros14-ppm-bulkstatsschema.csvThe output schema file is created in /opt/CSCOppm-gw/bin/ folder by default.
Step 4
/opt/CSCOppm-gw/etc/bulkstatsschema.csvStep 5
/opt/CSCOppm-gw/bin/ppm reloadbulkstats
Bulk Statistics Alarms
Bulk statistics alarms you might see are listed below. You can view BulkStats.properties in /opt/CSCOppm-unit/properties to see values shown in the alarm generation.
•
This is an Informational alarm. Examples:
Unit: ppm-ucs-vm13 - Bulk Statistics available for RTPZ5SVCGW01 but device not
discovered.
•
This is an Informational alarm. If parameters are missing in the file name, Prime Performance Manager stops processing the file. New files with zero size are created in drop directory with same name as the original file appended with extension, skipped. Examples:
Unit: ppm-ucs-vm13 - Missing parameters in filename:
_bulkstats_20120419_152500_EDT_5_5.csv Missing Hostname.
Unit: ppm-ucs-vm13 - Missing parameters in filename: Prime5k_bulkstats_20sds120419_155500_EDT_5_5.csv Unparseable date: "20sds120419155500EDT" format:yyyyMMddHHmmssz value: 20sds120419155500EDT.Unit: ppm-ucs-vm13 - Missing parameters in filename: Prime5k_bulkstats_20120419_160000_EDT.csv Missing Sample Interval.If necessary the following properties can be modified in BulkStats.properties
FILENAME_SUBSTR = _bulkstats_
FILENAME_DELIMITER = _
DATE_VARIABLE_FORMAT = yyyyMMdd
TIME_VARIABLE_FORMAT = HHmmss
•
The header is the first line in the bulk statistics samples. A missing header indicates the file is incomplete. Cisco ASR 5000 and 5500 devices maintain a buffer while collecting the samples until the time when it can transfer the CSV file to the drop directory. The header is the first information stored in the buffer. If the buffer allocated on the device is too small for the sample and transfer interval, the old data in the buffer is overwritten, so the header and some collected data might be removed.
The footer is the last line in the bulk statistics samples. A missing footer also indicates the file is incomplete. The file might be in the transfer process or FTP transfer issues might exist. The header and footer are required for processing. If necessary, the following properties can be modified in BulkStats.properties.
HEADER_LINE_PREFIX = Version
FOOTER_LINE_PREFIX = EndOfFile
If header and footer is missing in the filename, Prime Performance Manager stops processing the files. New files of zero size are created in drop directory with same name as the original file appended with extension, noheader or nofooter. Examples:
Unit: ppm-ucs-vm13 - Bulk statistics skipped. File
Prime5k_bulkstats_20120419_161500_EDT_5_5.csv received with no header information.
Unit: ppm-ucs-vm13 - Bulk statistics skipped. File Prime5k_bulkstats_20120419_161500_EDT_5_5.csv received with no footer information.If a footer is unavailable, Prime Performance Manager waits for a specified interval to see if the transfer gets completed. If no footer exists after the specified interval, Prime Performance Manager creates the zero size file and raises the NoFooter alarm. If necessary the following property can be BulkStats.properties to control the wait duration:
FOOTER_WAIT_TIME = 3
•
This is a Major alarm. Check if the drop directory is correct in BulkStats.properties. Also check device configurations. Example:
Device 172.18.53.231 has no bulk statistics.•
This is a Minor alarm. Check if device is being reloaded. Example:
Device 172.18.20.166 failed to receive 4 bulk statistics. Last received time is Apr
19, 2012 5:12:00 PM.
•
This is a Major alarm. Examples:
Device 172.18.20.166 failed to receive 17 bulk statistics. Last received time is Apr
19, 2012 5:39:57 PM.
•
This is a Normal alarm. Examples:
Device 172.18.53.231 receives bulk statistics as of Apr 19, 2012 5:12:00 PM.•
This is a Major alarm. Examples:
Unit ppm-ucs-vm13 - 2 devices failed to receive bulk statistics. Devices are:
Prime5k,RTPZ5SVCGW02,
If necessary, modify the following properties in BulkStats.properties to control when to raise alarms.
MINOR_ALARM_COUNT = 1
MAJOR_ALARM_COUNT = 5
NODES_FAIL_COUNT = 5
Managing Dashboards
Prime Performance Manager dashboards present data from different sources on a single page. For example, the ICMP (Internet Control Message Protocol) application dashboard presents the ICMP hourly packet rates, total errors, total echoes, and echo replies. The CPU/Memory dashboard presents the hourly CPU average and peak utilization as well as the top nn hourly memory pool average and peak utilization. Many dashboards are provided with the Prime Performance Manager package. High-level dashboard categories include:
•
•
•
•
•
•
•
•
•
•
•
•
Because dashboards are presented in graph output, only the top 10 report items are presented. You can change this number with the ppm topxxsize command. For information, see ppm topxxsize.
You can modify the provided Prime Performance Manager dashboards or create new ones. For information, see the Cisco Prime Performance Manager Integration Developer Guide.
Displaying Dashboards Status
Be default, all Prime Performance Manager dashboards are enabled. System-level dashboards depend upon the regular report to define what data to poll and monitor for the dashboard report. This is done by the regular report that the dashboard draws from. Disabling the report that actually defines the data for the dashboard will cause that data to stop being gathered, so the dashboard will only have data up to the time that the associated report was disabled. However, you can create a poller definition within the dashboard XML to enable the dashboard to draw the data independently from any reports.
You cannot enable or disable dashboards from that dashboard status page. The Dashboard Status page is a static list showing you which dashboards are on or off. The dashboard state is based on the status of its reports. If none of the reports used for the dashboard are enabled, the dashboard is disabled automatically.
To display dashboard status:
Step 1
Step 2
Step 3
Editing Dashboard Display
You can change the dashboard information display using options in the Dashboard menu bar. Menu bar items include:
•
•
–
–
–
–
–
–
•
•
–
–
–
–
–
–
•
•
•
•
•
•
•
To change a dashboard display:
Step 1
Step 2
Step 3
Step 4
Step 5
•
•
•
•
•
Note
•
•
•
Step 6
Step 7
•
•
•
•
Creating and Managing Custom Report Views
Prime Performance Manager allows you to create custom report views, for example, to monitor a particular function on selected devices or interfaces. You can attach devices to custom views and view all device information from menus within the view.
Creating and managing custom report views are described in the following topics:
•
•
View Permissions
Views allow individuals to create their own perspective on the network. Whether other users can view or edit an individual's view depends on multiple factors, including user permissions, roles, and abilities.
Permissions
Views have two permissions:
•
•
Roles
View have three roles:
•
•
•
Abilities
Users can have view and/or edit abilities on a particular view. They can also have the ability to create views, and can own views:
•
•
•
•
View Actions
View actions are divided into three areas:
•
•
•
View actions include:
•
The system administrator, view owner, and group members can perform the following actions to public and group views:
•
•
•
•
•
•
•
•
Note
Creating a Custom Report View
You can create a custom report view to monitor specific performance data and functions across selected devices and interfaces. These graphs and tables update automatically to show the most recent data from the server.
To create a custom report view:
Step 1
Step 2
Step 3
•
•
–
–
–
•
–
–
–
Note
•
Tip
•
Step 4
If you checked Go to New View, the new custom report view appears in the View Editor window with the text, "No entries found." If you did not check this option, the window displays the last-displayed view.
Step 5
a.
b.
Step 6
Tip
Step 7
Step 8
Step 9
You can copy multiple graphs to the clipboard before you need to click the Paste Graphs from Clipboard. so you do not need to go back and forth. For example, you can copy six graphs from six individual reports, then paste them into the view at one time.
Step 10
Step 11
Adding Views to the Navigation Tree
Views navigation tree behavior differs from the Reports, Dashboards, and Groups navigation trees because of the following:
•
•
•
•
•
Views represent the way you want to see the devices and reports are laid out hierarchically. When you select Views in navigation tree, a list of views you are allowed to see is presented in the content area. To display the views in the navigation tree, click Views, then click the folder icon of the view you want to add. Prime Performance Manager adds the view to the navigation tree.
If user access is enabled, you only need to perform this step once per user. If user access is not enabled, the user is the hostname of the device communicating with Prime Performance Manager. Whenever you switch hostnames, for example, if you go from wired to Wi-Fi, or from office to home, Prime Performance Manager will consider you a different user and you will need to repeat the step.
Copying and Pasting Views
An alternate method for creating new views is to copy an existing view and paste it into another one. This is often easier if an existing view will meet your needs with some modifications.
To copy and paste a view:
Step 1
Step 2
Step 3
The view appears under the view you selected.
Note
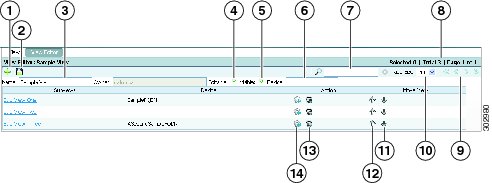
Figure 7-4 Copying and Pasting Views
Options icon
Move View Up
Edit View
Move View Down
Copy View
Delete view
Paste View
Create View fields
To modify the copied view, see Modifying Custom Report Views and Editing Views.
Modifying Custom Report Views
Your ability to modify custom views depends upon the permissions you were assigned. By default, System Administrator users can view and edit any custom view. If you are not a system administrator, you can modify custom views only when you are a Views Administrator and the view permissions allow you to edit the view.
To modify a custom report view:
Step 1
Step 2
Step 3
These actions affect all graphs contained in the view. Not all toolbar tools will be available, depending on the read and write permissions for the view.
•
•
•
•
•
•
•
•
•
•
•
Note
Note
Figure 7-5 Main View Toolbar
Home View
Compact Mode
Paste from Clipboard
Merge Selected Graphs
Columns
Lock Page
Graph Mode
Email Report
Table Mode
Refresh
Show Graph Legends
Step 4
These actions affect only the individual graph. Not all toolbar tools will be available, depending on the read and write permissions for the views.
•
•
•
•
•
•
•
•
•
•
Note
Inside each view graph, the following options are available:
•
•
•
•
These are the same options that are available for report graphs. See Customizing Report Display, for descriptions of these options.
Step 5
•
•
•
•
•
•
•
•
For descriptions of the device menus, see Displaying Device Information at the Device Level.
Merging View Graphs
Merging graphs in views can be useful to create a composite view of similar data within similar times. For example, graphs for TE tunnels between two provider edge (PE) devices could be merged into one graph to give a composite view of traffic between the two PEs, for example:
ifInOctects TE_Tunnel_1000_PE_A__PE_B
ifOutOctects TE_Tunnel_1000_PE_A__PE_B
ifInOctects TE_Tunnel_1001_PE_B__PE_A
ifOutOctects TE_Tunnel_1001_PE_B__PE_A
To merge graphs:
Step 1
Step 2
Step 3
Step 4
The merged report appears beneath the other graphs.
When creating merged graphs, keep the following points in mind:
•
•
Editing Views
You can edit any view to which you have edit permission and which have the Editable attribute turned on.
To hide or display views, and perform other view management tasks:
Step 1
Step 2
Tip
Step 3
Step 4
•
•
–
–
–
•
–
–
–
•
Step 5
a.
b.
c.
Step 6
•
•
Note
Step 7
Figure 7-6 View Editor
Managing Large Numbers of Views
Two user preferences (see Customizing the GUI and Information Display) help you manage large numbers of views:
•
•
These settings control the number of views displayed on a view tree. If number of items on a view tree reaches maximum setting, the top subview item is rolled out and new view item is added at the bottom. This allows you to scroll through a large set of views while keeping screen real estate manageable. Other view management elements include:
•
•
•
To clean up views and return to the default order, that is, the top 10, you can:
•
•
Working with Data Center Views
Prime Performance Manager delivers many Data Center views. When working with these views, keep the following in mind.
•
•
•
•
Creating and Managing Report Groups
Prime Performance Manager allows you to generate reports based on groups of network objects, for example, devices, interfaces, CPUs, or a combination of devices and device elements. You create the group by providing a list of network objects that you want included, or by providing an algorithm that is used to search the network and return objects that meet the provided criteria.
Creating new groups might require you to create new group reports. Information for creating group reports is provided in the Cisco Prime Performance Manager 1.4 Integration Developer Guide. Prime Performance Manager includes example groups in four categories: Mobile IOS Statistics, Mobile StarOS Statistics, Transport Statistics, and Video Broadcast.
Group elements that you work with in the Prime Performance Manager GUI include:
•
•
•
•
•
If(Contains(ifDescr,"To_Rome") || Contains(ifDescr,"To_Venice"),true,false)•
Node=<host or IP>,<other keys as defined in the corresponding report XML file>
Examples:
Node=em1941kbf.cisco.comNode=10.74.125.210Node=em1941kbf.cisco.com,ifDescr=FastEthernet0/0Node=10.74.125.210,CPUSlot=0,CPUNum=0,processorIndex=1The objects contained in this list are included in the group processing. Objects are returned if they meet the criteria specified in the algorithm or items in the Objects list.
•
The following topics describe how to create, manage, and display group reports:
Provided Groups
Prime Performance Manager includes sample groups that are shipped in the disabled state. You can use these as standalone groups to generate network-level statistics or you can copy them and add algorithms to aggregate similar objects at different level. For example, you might want to aggregate statistics to the network level as well as regional, group, or device levels.
Provided groups include:
•
•
•
•
•
•
•
•
•
The following groups aggregate data for the StarOS running on Cisco ASR 5000 platforms. The aggregated statistics are the similar to those collected through the apn, pdngwApn, sgwApn, and spgwApn groups listed above.
•
•
•
•
•
•
Creating a Report Group
To display grouped reports within the Prime Performance Manager GUI:
•
To create a new grouped report:
Step 1
Step 2
Step 3
The default system groups are displayed:
Step 4
Step 5
Step 6
The Group Details window is displayed.
Step 7
•
To create a new processing set, click +, then enter the new processing set name in the dialog that appears and click OK. Conversely, to delete a processing set, click -.
•
•
•
Step 8
•
•
Node=<host or IP>,<other keys as defined in the corresponding report XML file>
Examples:
Node=em1941kbf.cisco.comNode=10.74.125.210Node=em1941kbf.cisco.com,ifDescr=FastEthernet0/0Node=10.74.125.210,CPUSlot=0,CPUNum=0,processorIndex=1To validate the algorithm, click Validate.
Step 9
The new group is added to the Prime Performance Manager grouped reports list.
Managing Report Groups
After you create report groups, you can edit, enable, disable, duplicate, and delete them at any later time.
To edit, enable, disable, duplicate, or delete a grouped report:
Step 1
Step 2
Step 3
Step 4
Step 5
•
•
•
•
•
To edit algorithms, you can:
–
–
•
For field descriptions and entry examples, see Creating a Report Group.
Step 6
a.
b.
c.
–
–
–
–
d.
Displaying Group Reports
Group reports are displayed following steps similar to the display of non-group reports. To display a group report:
Step 1
Step 2
Step 3
The group report appears on the content area. For information on managing the report display, see Customizing Report Display.
Creating Web Reports
Prime Performance Manager allows you to define a new report by using report metrics that are already in place for existing reports. This feature allows you to choose report metrics that are defined in current report ProcessDBSummary tables, but not from the report Poll sections. Fundamentally, you can create WebReport sections using the following report elements:
•
•
•
•
•
–
–
–
•
–
–
–
–
To create a web report:
Step 1
Step 2
Step 3
Note
Step 4
•
–
–
After you choose the data source the Report Preview is automatically updated with the report XML for the chosen data source.
•
•
•
–
–
•
•
•
•
Step 5
Step 6
•
•
•
•
•
Step 7
Step 8
•
After you enter the graph title, the Readable Graph Title, Column Name Tag, and Readable Column Name are automatically populated with the graph title.
•
•
•
•
•
•
•
•
•
–
–
–
–
–
If you choose ipAddr, a checkbox appears allowing you to indicate whether it is a key.
•
•
•
•
•
•
•
•
•
•
•
Step 9
The graph is added to the report. The Graph View Properties window displays the key properties.
Step 10
Step 11
•
•
Step 12
Step 13
Step 14
Step 15
Step 16
The new report is added to Prime Performance Manager.