Cisco Prime Performance Manager User Guide, 1.4
Managing the Web Interface

Table Of Contents

Managing the Web Interface

Launching the Web Interface

Information Available from the Help Menu

Checking Your Web Browser

Customizing the GUI and Information Display

Customizing GUI Page Sizes

Changing System Configuration Settings

Adding and Removing Properties from Property Views

Sorting Tables

Displaying Prime Performance Manager Information


Managing the Web Interface


The Cisco Prime Performance Manager web interface is the primary method for displaying network reports and managing network devices and information. The following topics tell you how to launch the Prime Performance Manager web interface and customize web interface display and polling:

Launching the Web Interface

Customizing the GUI and Information Display

Customizing GUI Page Sizes

Changing System Configuration Settings

Adding and Removing Properties from Property Views

Sorting Tables

Displaying Prime Performance Manager Information

Launching the Web Interface

The Prime Performance Manager web interface requires one of the following web browsers with JavaScript enabled:

Microsoft Internet Explorer version 8.0, 9.0, or greater.

Mozilla Firefox 18.0 or greater

Safari—Not formally tested but widely used.

Chrome—Not formally tested but widely used.

In addition, your browser must have cookies enabled. If cookies are not enabled, enable them following procedures appropriate for your browser.


Note If you open Cisco Prime Performance Manager in an unsupported browser, a warning is displayed. If the browser does not have JavaScript enabled, the Prime Performance Manager web interface cannot function.


To access the Cisco Prime Performance Manager web interface:


Step 1 Enter the following in the browser URL field:

http://ppm-server:4440

Where ppm-server is the name of the server where Prime Performance Manager is installed and Port 4440 is the default port.


Note If SSL is enabled, use https instead of http. You can enable SSL using the ppm ssl command. For information, see Enabling SSL on Gateways and Units and ppm ssl.


Note If you connect the gateway with its literal IPv6 address, enclose the address with brackets, for example, http://[2011::2:21b:78ff:febd:9e16]:4440.


Step 2 If user access is enabled (see Setting Up User Access and Security), the Prime Performance Manager login screen appears. The screen displays:

Username—Enter your username.

Password—Enter the password for the username entered.

Log In—Starts the login.

Cookies—Indicates whether cookies are enabled on your browser. If cookies are disabled, enable cookies following procedures for your browser before you log in.

Hostname—The gateway hostname where you are logging in.

Change Password—Allows you to change your password. To change your password, enter your current username and password, then click Change Password. Enter the new password in the Change Password dialog box.

Authorized users message—Appears at the bottom of the login window. This message can be modified by administrators. See Creating Messages of the Day.

Step 3 After you enter your username and password, click Log In.

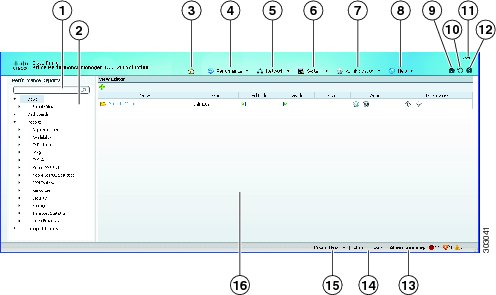
The Cisco Prime Performance Manager GUI application launches. By default, the Performance Reports View Editor is displayed (Figure 3-1). The View Editor allows you to create custom views with report data pulled from different reports and devices. It allows you to view the network performance areas that are of special interest. For more information, see Creating and Managing Custom Report Views.

The GUI window is comprised of the following elements:

Main menus—Prime Performance Manager provides five main menus that appear in all windows: Home, Performance, Network, System, Administration, and Help. Submenus displayed from each main menu are described in Table 3-1.


Note The System and Administration menus are only displayed for Administrator users.


Toolbar options—Standard toolbar options include:

Quick Start—Displayed for Administrator users, the popup window provides links to administration, network, and reports areas. The Quick Start appears at startup, but can be turned off by checking Do not shows this on startup. Getting Started can be displayed at any time by clicking to flag tool.

User Preferences—Allows users to customize Prime Performance Manager display. For information, see Customizing the GUI and Information Display.

Refresh—Refreshes the currently-displayed window.

Send Announcement—Allows you to send messsages to online users. For information, see Sending Messages to Online Users.

Page Help—Displays the online help topic for the currently-displayed window.

Navigation area—The navigation area is displayed in some, but not all, Prime Performance Manager views. It appears for all performance functions (Views, Dashboards, and Reports), and includes a search field that you can use to quickly find specific reports, dashboards, or views.

Content area—The lower right portion of the GUI displays content selected from the main menus and navigation area items.

Popup Device Browser, Alarm Browser, and Alarm Summary—The bottom of the window contains the global toolbar, which contains:

Device Browser—Lists all network devices and allows you to perform actions on them. The window contains a subset of properties that are displayed when you choose Network > Devices. For information, see Displaying Device Properties at the Network Level.

Alarm Browser—Lists all network alarms by the occurrence date and time. The browser contains the same information that is displayed when you choose Network > Alarms/Events. For information, see Displaying Alarm and Event Properties.

Alarm Summary—Shows the number of alarms by device. This window is intended as a quick reference. The number of alarms displayed corresponds to the device history limit user preference. For information, see Customizing the GUI and Information Display.

The Device and Alarm Browser and the Alarm Summary appear whenever you move your cursor over them. You can turn off this feature. For information, see Customizing the GUI and Information Display.

Figure 3-1 Prime Performance Manager Window

1

Performance Reports search field

9

User Preferences

2

Performance Reports navigation area

10

Refresh tool

3

Home

11

Information about Prime Performance Manager

4

Performance menu

12

Context help tool

5

Network menu

13

Alarm Summary

6

System menu

14

Alarm Browser

7

Administration menu

15

Device Browser

8

Help menu

16

Content area


Table 3-1 lists the Prime Performance Manager navigation menus and submenus, and provides topics where more information about the menu function is provided.

Table 3-1 Navigation Menus 

Menu
Submenu
For information, see...

Home

N/A

Modifying Custom Report Views

Performance

Views

Creating and Managing Custom Report Views


Dashboards

Managing Dashboards


Reports

Displaying Reports

Network

Network Overview


Devices

Chapter 8 "Managing Devices"


Tenants

Importing Tenants into Prime Performance Manager


Alarms/Events

Chapter 9 "Managing Network Alarms and Events"


Network Administration


SNMP Editor

Adding SNMP Credentials


Polling Group Editor

Creating and Editing Device Polling Groups


Telnet/SSH Editor

Adding Telnet and SSH Credentials


Threshold Editor

Managing Thresholds


Report Mail Editor

Emailing Reports


Discovery

Chapter 5 "Discovering Network Devices"

System

System Information

Gateway/Units

Chapter 12 "Managing Gateways and Units"

Status

System Properties, Statuses, Logs, and Messages Overview

Logs

Displaying System Logs

Messages

Displaying Information and Error Messages

Security Messages

User Actions

Displaying User Actions

Administration

System Administration


Prime Central Integration

Chapter 4 "Prime Central Integration"


Prime Network Integration

Importing Devices From Prime Network


Tenant Integration

Importing Tenants into Prime Performance Manager


Users/Security

Chapter 6 "Managing Users and Security"


Unit Editor

Managing Device-to-Unit Assignments


Alarms/Events Editor

Configuring Upstream Alarm Hosts and Tuning Event and Alarm Parameters


Group Editor

Managing Report Groups


Web Report Editor

Creating Web Reports


System Settings

Displaying System Properties and Settings


Reports Administration


Report Settings

Displaying Reports Settings


Report Status

Enabling and Disabling Reports


Report Policies

Creating Report Policies


Information Available from the Help Menu

The Help menu provides in-depth information about Prime Performance Manager reports and commands, and other application details that can be useful for those seeking a deeper understanding of Prime Performance Manager. Help menu items include:

PPM Help—Displays the Prime Performance Manager online help. The online help is based on the Prime Performance Manager User Guide, and covers all product operations and procedures.

Browser Check—Checks your browser for compatibility with Prime Performance Manager. For additional information, see Checking Your Web Browser.

Readmes and CLI Commands—Includes product readmes and CLI command descriptions:

Readme—Describes Prime Performance Manager system requirements and installation procedures.

Changes—Lists the changes, bug fixes, and new features in the 1.4 release.

Devices Info—Displays a list of devices that have been used with Prime Performance Manager by customers and in labs.

CLI Commands—A summary list of Prime Performance Manager commands.

CLI Commands Help—More detailed command information from the Prime Performance Manager online help.

Release Notes—Displays system release note information.

Quick Start—Displays quick start steps to help you get up and running quickly.

Reports—Displays Prime Performance Manager system and report information:

System Reports Readme—Displays the contents of README-Reports-system.html. This file contains report information including the MIB variables Prime Performance Manager polls, the formulas used in metric calculations, the format of CSV export files, and other report details.

User Reports Readme—Displays contents of README-Reports-user.html. This file contains user-created report information including the MIB variables polls, the formulas used in metric calculations, the format of CSV export files, and other report information.

Report XML Definitions—Provides the XML, properties, and notes for Prime Performance Manager reports.

Reports List Readme—Displays an alphabetical list of all Prime Performance Manager reports.

IETF RFCs—Provides links to industry-standard RFCs supported by Prime Performance Manager.

SNMP MIBs—Provides the SNMP MIBs supported by Prime Performance Manager.

System Capability Definitions—Displays the SystemCapability.xml file (located in /opt/CSCOppm-gw/etc/), which defines the Prime Performance Manager system capabilities used for enabling and disabling reports.

User Capability Definitions—Displays the UserCapability.xml file (located in /opt/CSCOppm-gw/etc/), which defines any user-created report functions.

Installation Guide—Displays the Prime Performance Manager Installation Guide on Cisco.com.

User Guide—Displays the Prime Performance Manager User Guide on Cisco.com.

Integration Developer Guide—Displays the Prime Performance Manager Integration Developer Guide on Cisco.com.

Supported Devices—Displays a list of devices that Prime Performance Manager officially supports on Cisco.com.

Release Notes—Displays the Prime Performance Manager Installation Guide release notes on Cisco.com.

Checking Your Web Browser

After you display the Prime Performance Manager web interface, you can check your web browser and screen settings:


Step 1 From the Help menu, choose Browser Check.

Step 2 Review the browser information:

Browser—The name and version of the browser you are using.

Browser User Agent—A text string that identifies the user agent to the server. This generally includes the application name, version, host operating system, and language.

Platform—The platform type, for example, Win32.

Cookies Enabled—Indicates whether cookies are enabled on the browser (Yes or No). For Prime Performance Manager, cookies must be enabled

JavaScript Enabled—Indicates whether JavaScript is enabled (Yes or No). For Prime Performance Manager, JavaScript must be enabled.

AJAX Component—Asynchronous JavaScript and XML (AJAX) sends asynchronous HTTP update requests. The Prime Performance Manager web application is only accessible to web browsers that have an AJAX component enabled. Typical values include XMLHttpRequest.

Size—Indicates the resolution of the display, for example, 1600 x 1200. To ensure that you can view all Prime Performance Manager GUI elements, your screen should be set to a minimum of 1280 x 1024 pixels.

Color Depth—Indicates the depth of the color display, for example, 16.

System Information—Includes Dojo and XWT Version. This internal data is used by Cisco TAC for customer support.


Customizing the GUI and Information Display

Prime Performance Manager provides many options that allow you to change the information that is displayed and how it is displayed in the Prime Performance Manager GUI. The options help you tailor the GUI to your individual needs and preferences.

User preferences apply only to the individual user. How they are applied depend upon whether the gateway has user security enabled:

User security enabled—User preferences apply only to the currently logged-in user. They apply any time the user logs in, regardless of the client machine. For information about user security, see Setting Up User Access and Security.

User security not enabled—Preferences apply to only the client machine, as identified by its host name or IP address. Any user logging in from that client will see the user preferences that are applied from it. If you log in from a different client, the preferences will not be applied.

To customize the Prime Performance Manager GUI and information display:


Step 1 On the right side of the main menu bar, click Preferences. (If user security is enabled, you can also choose User Preferences from the user ID at the top of the window.)

Step 2 In the User Preferences window, modify the following, as needed:

Device Display Settings—Indicates how devices are identified in the Prime Performance Manager GUI. Choose one of the following:

Show DNS or User-Defined Names (default)—Identifies devices by their DNS or user-defined names.

Show IP Address in Name Field—Identifies devices by their IP addresses.

Show System Name—Identifies devices by their system name.

Show Sync Name—Identifies devices by their sync name.

Show Business Tag—For devices imported from Prime Network, identifies devices by their business tag.

Show Business Tag - DNS Name—For devices imported from Prime Network, identifies devices by their DNS Name business tag.

Show Business Tag - System Name—For devices imported from Prime Network, identifies devices by their System Name business tag.

Show Business Tag - Sync Name—For devices imported from Prime Network, identifies devices by their business tag.

Additionally, complete the following device display attributes as needed:

Show Device Domain Names—If checked, displays the device domain names. This option is not enabled by default.

Display Device Level Data in Device Time Zone—If checked, displays device time stamps in the device time zone. These include report title time stamps, calendar popup selections, summary table maximum date strings, graph date strings, tooltip hover information, the Timestamp column in report table format, and the Timestamp values in exported CSV files.The device time zone is determined from one of the following: the time zone provisioned by the user. (see Editing a Device Name, Web Port, Time Zone, and Location), the device time zone provided when the device is imported from Prime Network, or by querying the device running configuration. If this option is not enabled, device times are displayed in gateway server time zone.

Show Deleted Device Data—If checked, Prime Performance Manager displays deleted devices in device windows without hyperlinks, so the device data can be viewed but not accessed. This option is not enabled by default.

Device History Limit—Sets the device history limit, that is, the number of devices displayed in the Network Devices window (Network > Devices > Device Summary). The default is 20. The range is 5 to 100.

Details Displayed on Device Links—Sets the information that appears when you move your mouse over device links. None turns off this feature. Mouse Hover Details Popup displays device information as a popup when you move your cursor over the device link. Mouse Click Device View displays the 360 Network Device View window. This window includes detailed device information including alarms, events, availability, collector status, and polling information. For information on the 360 Network Device View window, see Displaying the 360 Device Details View.

Graph Color Settings—Allows you to edit the colors used in report and group graphs including graph data, plot area, borders, and text. Twenty colors are available. To edit a color, you can edit the color hex # directly in the color sample, or click Open Color Picker in the right side of the color sample. In the Color Picker dialog box, edit any of the following attributes:

H (hue), S (saturation), and V (value) percentages (0-100).

R (red) G (green), or B (blue) values (0 to 255).

Hex value: #000000-#ffffff.

Alternatively, you can pick colors visually from either of the color selection areas; the HSV, RGB, hex values will populate automatically. The new and existing colors are displayed side-by-side. Click OK when you complete your edits.


Note The default colors are web-safe and selected to provide the highest differentiation on report charts. If you edit them, verify that they meet web requirements and do not reduce data differentiation on reports. To return to the default colors, click Revert to Default Colors.


Use Bold Fonts in Graph Text—Displays all graph text in bold. This is enabled by default. Uncheck this box if you do not want chart text displayed in bold.

Utilization Color Settings—Allow you to define the ascending and descending utilization ranges to assign to green, gold, orange and red colors in report charts to make utilization values in various states of criticality easier to distinguish. Default values:

Ascending

Green—00.00 > 50.00

Gold—50.01 > 70.00

Orange—70.01 > 90.99

Red—91.00 > 100.00

Descending

Green—100.00 > 99.91

Gold—99.90 > 99.51

Orange—99.50 > 99.01

Red—99.00 > 00.00

Text Color—Defines whether the chart text color will be displayed in green, orange, and red based on the utilization values:

On—Turns on the utilization colors for text.

Off—Turns off the utilization colors for text.

Red/Orange/Gold Only—Turns on utilization colors for text only red, gold, and orange colors.

Background Color—Defines whether the chart table cell background color is displayed in green, orange, and red when the utilization values are reached:

Reports—Turns on the utilization colors for report chart table cells.

Dashboards/Views—Turns on the utilization colors for dashboard and view chart table cells.

Both—Turns on utilization colors for reports, dashboards, and view chart table cells.

Off—Turns off utilization colors for chart backgrounds.

General Display Settings—Check any of the following display options:

Optimize GUI for Slow Connections—If you are using a low-speed connection, for example, a dial-up modem or long-distance VPN connection, check this box to turn off the row index count that is displayed in the upper right corner of a report title area. If enabled, this option displays the row number as you mouse over a table, and also displays the number of table pages and table entries. The option does not perform well in low-speed connections. This option is not displayed by default.

Show Last Login Date/Time After Login—If checked (default), displays the user's last login date and the time after login in the GUI window.

Enable Global Toolbar—If checked (default) displays the global toolbar.

Show Icons With Labels—If checked (default), shows icons with labels.

Color Highlight TCAs—If checked (default), color highlights TCAs in reports.

Screen Refresh Interval—Specifies how frequently Prime Performance Manager refreshes the web pages. The range is 180 to 900 seconds. The default is 180 seconds. The valid range and default settings can be changed in the Server.properties file to change the settings for all users.

Default Number of Views Per View Level—Sets the default number of views per view level.

Maximum Number of Views Per View Level—Sets the maximum number of views per view level. For information about the default and maximum view entries, see Managing Large Numbers of Views.

Report Settings—Changes report display elements.

Show Min Values in Graphs and Summary Tables—If checked, displays the minimum values in the graph output mode summary tables and chart legends. This option is not enabled by default.

Show Avg Values in Graphs and Summary Tables—If checked (default), displays the average values in the graph output mode summary tables and chart legends.

Show Max Values in Graphs and Summary Tables—If checked (default), displays the maximum values in the graph output mode summary tables and chart legends.

Show Total—If checked (default), displays the total values in the graph output mode summary tables and chart legends. This option is not enabled by default.

Show Current—If checked (default), displays the current values in the graph output mode summary tables and chart legends.

Override Report Definitions—If checked, overrides report definitions that have been set up at the individual report level and assigns the report definitions defined in the Reports Status window. For information, see Enabling and Disabling Reports.

Show Values with K/KB, M/MB, and G/GB—If checked (default), appends kilobyte, megabyte, and gigabyte data with one of the following: K or KB, M or MB, G or GB.

Display Device Alarm Severity Icon—By default, Prime Performance Manager displays the alarm severity icon for the device's highest alarm. Use this option to turn that feature off.

Auto Expand Report Summary Tables—If checked (default), automatically expands the report graph summary tables. Reports with Dashboard in their titles, for example in the AAA Authentication Dashboard Hourly report, collapse the summary tables by default. This preference expands the summary tables automatically.

Display End of Time Period in Timestamps—If selected, changes the timestamp shown in graph and table reports to the end of the report interval. By default, graph and table reports display the start time for all time intervals. For example, in an hourly report, the polling time is 6H.00M.00S to 7H.00M.00S. By default, reports display the start time, which is 6H:00M:00S. If this option is enabled, reports will display the report interval end time. In the hourly interval example, this would be 6H:59M:59S.

Disable Dashboards—If enabled, hides the Prime Performance Manager dashboards from the reports navigation tree. Dashboards are enabled by default. Disabling them might be useful if you do not use them.

Disable Graph Decoration and Styling—Hides the display of the Zoom, Aggregate Lines, Graph Styles, and Export Graphs tools displayed inside charts. Additionally, the chart border is hidden and chart title reduced in size. Enabling this option reduces the overall chart size and increases screen real estate. You can toggle chart decorations and styling at the individual chart level.

Always Display All Report Data Intervals—If enabled, displays all intervals in the device-level report Duration menu even if the intervals are disabled at the network or device levels. This allows you to see report data for intervals that might exist in the past but are currently disabled, or to see TCA data for a time period that is disabled at the device or network levels. Device-level report durations include: 5 minute, 15 minute, hourly, daily, weekly, monthly.

Export All CSV Data With Report Export—Exports all CSV data with report exports.

Show Live Mode Report Data For—Allows you to change the amount of data available for Go Live reports: Last Hour (default), Last 12 Hours, Last Day, Last 3 Days. Go Live reports display data every 15 seconds. For more information, see Displaying Network and Device Reports.

Number of Digits of Precision After Decimal—Specifies the level of precision for numeric values in reports. For example, if set to 2 (default), reports will display a numeric as ...nnnnn.nn. If set to three, the numeric is displayed as ...nnnnn.nnn. The level of decimal precision is also controlled by the decimalPrecision report element. Prime Performance Manager displays the highest level set either in User Preferences or by the decimalPrecision element. For information about the decimalPrecision element, see the Cisco Prime Performance Manager 1.4 Integration Developer Guide.

Maximum Number of Data Series Per Report—Allows you to specify the number of items displayed in graph output mode tables and charts. This number cannot be higher than the number specified in the Maximum Top XX Entries specified on the System Configuration tab. The default is 10. For information about system configuration parameters, see Changing System Configuration Settings.

Bytes in Megabytes—Allows you to set the number of bytes displayed in megabytes, either 1000 or 1024.

Show Critical/Major/Minor/Normal TCAs in Graphs—Options to show or hide critical, major, minor, or normal TCAs in report graphs. All alarm levels are checked by default.

Graph Settings—Change display options in report, dashboard, and view graphs:

Show Hover Info—Turns hover information on (default) or off. Hover information is the device details that appear when you move your cursor over a device link.

Show Vertical Bar Over Data Series—Turns the vertical bar displayed in charts on (default) or off. The vertical bar helps you see data points through all data items.

Show One Graph Column Per Report—Allows you to display one graph per screen column instead of the default two columns. This option is not enabled by default.

Show Vertical Graph Grid—Allows you to display vertical and horizontal lines in charts. By default, only horizontal lines are displayed in charts. This option is not enabled by default.

Enable Graph Time Span Bar—Displays the full screen graph adjustable time span bar on all report graphs including graphs in views and dashboards. The time span bar allows you to bring period of time within the report period into higher focus on the chart. This option is not enabled by default.

Show Graph as Default Output Mode in Dashboards/Stargraphs—Makes graph output the default for dashboards and star graphs. This option is not enabled by default.

Enable Legends by Default—Enables legend display for all graphs.

Default Graph Title/Date Font Size (Pixels)—Allows you to change the graph title and font size in reports. The default is 12 pixels. The range is 12 to 18 pixels.

Default Graph Height (Pixels)—Allows you to change the height of graphs in reports. The default is 300 pixels. The range is 250 to 750 pixels.

Margins—Allows you to set the width of the graph margin: No Margins, Narrow Margins, or Wide Margins.

Step 3 After you complete your changes, return to the previous Prime Performance Manager window.

Step 4 To view the new settings, click Reload Report on the report toolbar (if a report is displayed), or click Reload Page on the main toolbar at the top of the Prime Performance Manager window.


Customizing GUI Page Sizes

Information in the Prime Performance Manager GUI is generally presented in tables, including summary tables, report tables, and editors. You can customize the number of table entries using the Page Size field. This field is located in the toolbar of every page allowing customization.

Prime Performance Manager retains your entry for each table. For example, you can set the page size for the Devices window to 400 if you prefer to see all device data at one time, and set the page size for SNMP Editor to 25, if you want that screen to load quickly instead of seeing a large volume of data at once.

Page size values are maintained across user sessions.

Table 3-2 shows the Prime Performance Manager windows where you can adjust the page size.


Note The Page Size field maximum is controlled by the Maximum Rows for Table Pages in the Administration Configuration Settings window. For information, see Changing System Configuration Settings.


Table 3-2 Page Size 

Area or Menu
Submenu or Window
Page

Views

Subview


Event History


Active Alarms


Dashboards


Reports (Table output mode)


Grouped Reports (Table output mode)


Network

Devices

Devices

Types

Alarms By Device

Alarms By Device Type

SNMP Timeouts

Poll Response

Ping Response

Uptime

Data Collection

Software

Contact/Location

Vendor

Prime Style

Tenants


Alarms/Events

Active Alarms


Event History

Alarms By Device

Alarms By Device Type

SNMP Editor


Polling Group Editor


Telnet/SSH Editor


Threshold Editor


System

Gateway/Units


Administration

Groups Editor


Changing System Configuration Settings

In addition to user preferences (see Customizing the GUI and Information Display), system administrators can change a number of system settings that control disk space monitoring and warnings, the number of days to archive message logs, maximum number of Top XX entries, as well as HTML page and table sizes. These settings apply to all users. You must be a System Administrator user to change them.

To change system configuration settings:


Step 1 Log into Prime Performance Manager as a System Administrator user.

Step 2 From the Administration menu, choose System Settings.

The System Configuration tab is displayed.

Step 3 Modify the following, as needed:

System Configuration Settings

Display Device Location in Google Maps—If enabled, converts the provisioned device location into a Google Maps hyperlink. The hyperlink is displayed in the device Location property. When selected, Google Maps displays the device location in a separate browser session. This property is disabled by default.


Note Prime Performance Manager displays the location that is provisioned on the device unless you edit the location in Prime Performance Manager. (For information, see Editing a Device Name, Web Port, Time Zone, and Location.) If you enable this feature, verify that enough location information is entered for the device to display its location accurately in Google Maps. Location abbreviations or notations might not display the device location accurately.


Default Map Zoom Level—Sets the default Google Maps zoom level, 0 (global view) to 21+ (street level view). The default zoom value is 13.

TCA Warning Severity—If enabled, TCA alarms are generated when the warning threshold is reached.

TCA Informational Severity—If enabled, TCA alarms are generated when the information threshold is reached.

Disk Space Monitor Checking—If enabled, the Prime Performance Manager installed directories disk space monitor script runs every ten minutes to check the disk space. Alarms are raised when disk space reaches the thresholds defined in the next to parameters.

Warning Disk Space Remaining—Defines the disk space threshold when a warning alarm is generated, and disk cleanup begins. 30 MB is the default.

Critical (Shut Down) Disk Space Remaining—Defines the disk space threshold when a critical alarm is generated, and disk cleanup begins. 29 MB is the default.


Note Disk space monitoring and thresholds can also be set with the ppm diskmonitor command. For information, see ppm diskmonitor.


Maximum Days for Message Log Archives —Sets the maximum number of days to archive message logs. 31 days is the default. You can also set the maximum using the ppm msglogage command. For information, see ppm msglogage.

Maximum Entries for Top XX Output—Sets the maximum number of entries in Top XX reports. 10 is the default. The range is 5-20. You can also set the maximum using the ppm topxxsize command. For information, see ppm topxxsize.


Note Users can set their own preference for this item in User Preferences. However, their preference cannot be greater than the value entered here. For information about user preferences, see Customizing the GUI and Information Display.


Maximum Rows for Table Pages—Sets the maximum browser page size for Prime Performance Manager tables. Effectively, this sets the maximum users can select from the Page Size field. The default value is 800. The range is 1-5000. You can also set the maximum using the ppm maxpagesize command. For information, see ppm maxpagesize. For more infomation, see Customizing GUI Page Sizes.

Maximum Simultaneous Report Queries—Sets the maximum number of simultaneous report queries. The valid range is 1-50. 0 disables function so no maximum is set. You can also set the maximum using the ppm maxrepqueries command. For information, see ppm maxrepqueries.

Interface Name Format—Defines the format for displaying interface names in the Prime Performance Manager GUI:

Alias—The interface alias is displayed.

Description—The interface description is displayed.

Both—Both the interface alias and description are displayed.

You can also set this parameter using the ppm ifnameformat command. For information, see ppm ifnameformat.

SMTP Mail Server—Sets the SMTP mail server for report emails. For information, see Emailing Reports.

System Backup Settings

Database Backups—Enables or disables database backups.

Reports Backups—Enables of disables reports backups

Zipping Old Backups—If enabled, zips old backups instead of deleting them.

Number of Days to Save Backup Files—Configures the number of days to save old backups. The default is 1. The rang is 1 to 365 days.

Minimum Free Disk Space to Attempt Backups—Sets the amount of disk space, in megabytes, that must be free before a backup is attempted. The default is 300 megabytes. The range is 1 to 1000 megabytes.

System Polling Threads

Displays the number of slow and fast polling threads, and the interval between the slow and fast threads. Polling threads prevent slow polling devices from blocking the processing of fast polling devices. The fast interval determines the thread a device is assigned to based on how long it took to poll all report data for the device. If polling time is less time than the fast interval, the device is assigned to the fast polling thread. If not, it is assigned to the slow polling thread.

The fast interval might need tuning if the average poll time for the majority of devices is greater than the 15-second default. The number of threads assigned to each pool might need tuning if it takes longer to process all devices than the lowest enabled report interval. Polling threads and intervals can be modified using the following commands:

ppm numfastthreads

ppm numslowthreads

ppm fastinterval


Note Polling thread and interval modification should only occur at the direction of Cisco support.


Step 4 After you complete your changes, return to the previous Prime Performance Manager window.

Step 5 To view the new settings, click Reload Report on the report toolbar (if a report is displayed), or click Reload Page on the main toolbar at the top of the Prime Performance Manager window.


Adding and Removing Properties from Property Views

Prime Performance Manager displays many properties and attributes in tables, including Devices, Alarms by Device, SNMP Timeout Alarms, and many others. Most tables have properties that are not displayed by default. To display hidden properties, or to hide ones that are displayed:


Step 1 Right-click a property table header.

Step 2 In the list of properties that appears, check the properties that you want display; uncheck ones that you want to hide.

Step 3 At the bottom of the property list, click Apply.

If many properties are available, for example in the Devices table, scroll the Prime Performance Manager window to display the Apply button.


Note If you do not click Apply, the change will not appear in the table.


Note Changes to displayed table properties will persist from user session to user session.


Sorting Tables

You can easily sort any Prime Performance Manager table display, for example, Devices, Alarms by Device, and many others.

To sort a property table, left-click the column heading. Prime Performance Manager alpha-numerically sorts the table from top to bottom based on the data in the chosen column. To sort the table in reverse order, left-click the column heading again.

Icons in the column heading indicate the column on which the table is sorted and the sort direction:

Triangle icon—Ascending sort order (1-9, A-Z).

Inverted triangle—Descending (Z-A, 9-1).

If you sort a table based on the Devices column, Prime Performance Manager sorts the table based on the discovered device DNS names. If you modified your web preferences to identify devices by their user-defined names, Prime Performance Manager sorts the table, based on the user-defined device names. For more information, see Customizing the GUI and Information Display.

Displaying Prime Performance Manager Information

You can display information about the Prime Performance Manager by clicking the About item at the top right corner of the Prime Performance Manager window. The following information is displayed:

License Type—The Prime Performance Manager license type.

Build Date—The Prime Performance Manager build date.

Build Version, Patch Level—The build version and patch level. For example, 1.4.0.6, 0 indicates a 1.4 build with no patches installed.

Release Notes—A link that displays the Prime Performance Manager Release Notes on Cisco.com.

PPM on Cisco.com—A link to the Prime Performance Manager product page on Cisco.com.

Network Management Products—A link to the Cisco Network Management product page.

Engineering_Software_Updates—A link to the Prime Performance Manager FTP download page where software patches can be downloaded. You must be a registered user to access this site.