-
Cisco Prime Performance Manager User Guide, 1.4
-
Preface
-
Prime Performance Manager Overview
-
Managing Gateways and Units Using the Command Line Interface
-
Managing the Web Interface
-
Integrating Prime Performance Manager with Prime Central
-
Discovering Network Devices
-
Managing Users
-
Managing Reports and Dashboards
-
Managing Devices
-
Managing Network Alarms and Events
-
Managing Thresholds
-
Displaying System Properties, Statuses, Messages, and Logs
-
Managing Gateways and Units
-
Configuring Prime Performance Manager for Firewalls
-
Backing Up and Restoring Prime Performance Manager
-
Prime Performance Manager and IPv6
-
Commands Reference
-
Predefined Thresholds
-
Glossary
-
Index
-
 Feedback
Table Of Contents
Options for Displaying Device Information
Displaying Device Information at the Network Level
Displaying Device Properties at the Network Level
Displaying Device Type Distributions at the Network Level
Displaying Alarms by Device at the Network Level
Displaying Alarms by Device Type at the Network Level
Displaying Device SNMP Time Out Alarms at the Network Level
Displaying Device Poll Responses at the Network Level
Displaying Device ICMP Ping Responses and Availability at the Network Level
Displaying Device Network Up Time at the Network Level
Displaying Device Data Collection Status at the Network Level
Displaying Device Software at the Network Level
Displaying Device Contacts and Locations at the Network Level
Displaying Device Vendors at the Network Level
Displaying Device Details in Cisco Prime Format
Adding Device Topologies to Network Weathermap
Adding Device Topologies to Network Weathermap
Editing Network Weathermap Device Topologies
Deleting a Network Weathermap Device Topologies
Uninstalling Network Weathermap
Managing Devices in the Network-Level View
Editing a Device Name, Web Port, Time Zone, and Location
Editing the Device Credentials
Editing the Report Policy Assigned to a Device
Editing the Polling Group Assigned to a Device
Editing the Device Management IP Addresses
Displaying the 360 Device Details View
Displaying Device Information at the Device Level
Creating and Editing Device Polling Groups
Editing Polling Group Parameters
Assigning Devices to Polling Groups
Managing Devices
After Prime Performance Manager discovers your network devices, you can view detailed information, perform management actions, and create individualized polling for discovered network devices.
Device views, the properties you can display, and the actions you can perform are described in the following topics:
•
Displaying Device Information at the Network Level
•
•
•
Options for Displaying Device Information
Prime Performance Manager provides many ways for you to see device information. Some are intended as a quick display of the highest priority device details; others are intended for detailed exploration of every single device parameter. Device information display options include:
•
•
•
–
–
The details displayed from device hyperlinks is controlled by the Details Displayed on Device Links option in User Preferences. For information, see Customizing the GUI and Information Display.
•
Displaying Device Information at the Network Level
The Prime Performance Manager network device view provides the broadest overview of your network devices. From this view you can drill down to different device details, as well as to individual devices for details about one device. (See Displaying Device Information at the Device Level.)
To display the network-level device view, from the Network menu, choose Devices. The Network Devices window displays the last updated time in the window title bar. If the gateway and client reside in the same time zone, one time is presented. If the gateway and client are in different time zones, both times are presented.
Device information areas, accessed from Network Devices window tabs, are displayed in Table 8-1.
Table 8-1 Network-Level Device Information
Devices
Lists all network devices and device properties.
Types
Displays a device distribution by device type.
Alarms by Device
Displays alarms by device.
Alarms by Device Type
Displays alarms by device type.
SNMP Timeouts
Displays SNMP timeout alarms.
Poll Response
Displays poll response data.
Ping Response
Displays ICMP ping response data.
Displaying Device ICMP Ping Responses and Availability at the Network Level
Uptime
Displays device up time.
Data Collection
Displays device data collection status.
Software
Displays device software information.
Contact/Location
Displays device contacts and locations.
Displaying Device Contacts and Locations at the Network Level
Vendor
Displays the device manufacturer.
Prime Style
Displays device properties in Cisco Prime format.
Displaying Device Properties at the Network Level
Prime Performance Manager displays properties for all network devices in one view. To display them:
•
All discovered network devices are displayed. Table 8-2 lists the available device properties. In addition, you can change the following items in User Preferences.
•
The device details displayed in the popup or 360 Network Device View are described in Table 8-2, and Table 8-11. The details display option is useful in other windows that list device links, for example, the Network Active Alarms window, or when drilling down to the interface report level. However, you can disable this feature in User Preferences.
•
•
For information about changing user preferences, see Customizing the GUI and Information Display
Table 8-2 Devices Properties at the Network Level
Internal ID1
Device internal ID. Prime Performance Manager assigns this ID to the device for internal use.
Unit2
Name of the unit to which the device is assigned.
Display Name
Device display name.
Custom Name1
Device custom name, if available.
Sync Name1
Device sync name.
IP Address or DNS Hostname1
Device IP address or DNS name as Prime Performance Manager discovered it.
System Name1
Device system name.
Management IP Address
IP address used to poll the device.
Device Type
The device type, which is usually based on the device family, for example, Cisco1706 for Cisco 1706 Series Routers. If the device family type is not known, IP Device is displayed. Prime Performance Manager gateway and unit servers are listed as ciscoGatewayServer and ciscoUnitServer.
Vendor1
Device manufacturer.
Software Version1
Device software version.
Software Description1
Device software description, if available.
Last Full Poll Time1
The time of the last Prime Performance Manager poll.
Last Poll Response (secs)1
The time for the device to respond to the last SNMP poll requests.
Avg. Poll Response (secs)1
Average time for the device to respond to Prime Performance Manager SNMP poll requests.
Uptime1
Time the device has been up in days, hours, minutes, and seconds.
Reboot Reason1
Reason for the last device reboot.
Discovery Source1
Indicates how Prime Performance Manager discovered the device: PPM (Prime Performance Manager) or Prime Network. See Chapter 5 "Discovering Network Devices."
Report Polling
Indicates whether report polling is enabled for this device.
Severity
If alarms are raised for the device, the highest severity: Critical, Major, Minor, Warning, Informational, Unmanaged, or Normal.
Last Status Change1
Date and time that the device status last changed.
Status3
Current device status:
•
•
•
•
•
•
•
Status Reason
Reason for the current device status. (If you cannot see all of the status reason text, place the cursor over the cell to see the full text in a tooltip.) The stateReasons.html provides a list of possible reasons,located at:
/opt/CSCOppm-gw/apache/share/htdocs/eventHelp.
Contact1
The device contact name, if added.
Location2
The device location, if added. If GPS locations are enabled, the location is displayed as a hyperlink that, when launched, displays the device location in a separate Google Maps browser session.
Polling Group1
The polling group to which the device is assigned. See Creating and Editing Device Polling Groups
Report Policy1
The report policy to which the device is assigned. See Creating Report Policies.
Sending Alarms
Indicates whether the device is sending alarms. Users with authentication level Network Operator (level 3) and higher can edit this field. See Creating and Editing Device Polling Groups.
1 Not displayed by default. To display hidden properties, see Adding and Removing Properties from Property Views.
2 Not displayed by default for device alarms; displayed for SNMP timeout alarms.
3 Not displayed by default for SNMP timeout alarms.
Displaying Device Type Distributions at the Network Level
The Device Distributions page presents your device type distributions in table and pie chart format. Information includes the device type, the total number of devices, and the device type percentage within the network. To display device distributions:
•
Device Distribution fields include:
•
•
•
From the Device Distributions window, you can:
•
•
•
Displaying Alarms by Device at the Network Level
The Network Alarms by Device area displays a count of alarms by device and severity. You can display alarms by device from either the Devices or Alarms/Events windows:
•
Table 8-3 lists the Alarms by Device properties.
Table 8-3 Network Alarms by Device Properties at the Network Level
Internal ID1
—
Internal device ID. Prime Performance Manager assigns this ID to the device for internal use.
Device
—
Name of the device. When you click any of the device names, the Alarms tab of that device is displayed. This column is displayed by default.
Sending Alarms
—
Indicates whether the device is sending alarms. Users with authentication level Network Operator (level 3) and higher can edit this field. See Creating and Editing Device Polling Groups.
Last Status Change1
—
Date and time that the status of the device alarms last changed.
Total
—
Total number of alarms for the device.
Critical (alarm count) (alarm percentage)
Total number of critical alarms for the device.
Major (alarm count) (alarm percentage)
Total number of major alarms for the device.
Minor (alarm count) (alarm percentage)
Total number of minor alarms for the device.
Warning (alarm count) (alarm percentage)
Total number of warning alarms for the device.
Informational (alarm count) (alarm percentage)
Total number of informational alarms for the device.
Normal (alarm count) (alarm percentage)
Total number of normal alarms for the device.
1 Not displayed by default. To display hidden properties, see Adding and Removing Properties from Property Views.
Displaying Alarms by Device Type at the Network Level
The Network Alarms by Device Type area displays device alarm information organized by device types. You can display alarms by device type from either the Devices or Alarms/Events windows:
•
Network Alarms by Device Type displays the following information:
•
•
•
–
–
–
–
–
–
Displaying Device SNMP Time Out Alarms at the Network Level
The SNMP Timeout Alarms link displays the devices for which a Node Unreachable alarm is present. To display SNMP timeout alarms:
•
Displaying Device Poll Responses at the Network Level
The Poll Response table displays the number of seconds devices take to respond to the Prime Performance Manager poll requests. To display the device poll responses:
•
Table 8-4 lists the Poll Response information.
Table 8-4 Device Average Poll Responses at the Network Level
Internal ID1
Internal device ID. Prime Performance Manager assigns this ID to the device for internal use.
Unit1
Name of the unit to which the device is assigned.
Display Name
Name of the device.
Primary SNMP Address
IP address of the device, which SNMP uses to poll the device.
Device Type
The device type, which is usually based on the device family, for example, Cisco1706 for Cisco 1706 Series Routers. If the device family type is not known, IP Device is displayed. Prime Performance Manager gateway and unit servers are listed as ciscoGatewayServer and ciscoUnitServer.
Location
The device location.
Report Polling
Indicates whether report polling is enabled for this device.
Last Full Poll Time
The date and time Prime Performance Manager last polled the device.
Last Poll Response
The time, in seconds, it took for the device to respond to the poll.
Avg. Poll Response (secs)
Average response time for the device to respond to poll from the Prime Performance Manager server.
Severity
The highest severity alarm currently raised on the device.
1 Not displayed by default. To display hidden properties, see Adding and Removing Properties from Property Views.
Displaying Device ICMP Ping Responses and Availability at the Network Level
The ICMP Ping Response and Device Availability table displays the number of seconds devices take to respond to the Prime Performance Manager Internet Control Message Protocol (ICMP) pings, and the resulting device availability percentages.
Note
To display ICMP ping results and device availability:
•
The following information is displayed:
•
•
–
–
–
–
–
Displaying Device Network Up Time at the Network Level
The Uptime link displays the uptime for managed devices. To display device uptimes:
•
Table 8-5 lists the device up time properties.
Table 8-5 Device Up Time
Internal ID1
Internal device ID. Prime Performance Manager assigns this ID to the device for internal use.
Unit1
Name of the unit to which the device is assigned.
Display Name
The device display name.
Device Type
The device type, which is usually based on the device family, for example, Cisco1706 for Cisco 1706 Series Routers. If the device family type is not known, IP Device is displayed. Prime Performance Manager gateway and unit servers are listed as ciscoGatewayServer and ciscoUnitServer.
Uptime
Time the device has been up, in days, hours, minutes, and seconds.
Reboot Reason
Reason for the last reboot of the device.
Severity
Indicates the highest alarm severity for the chosen device: Critical, Major, Minor, Warning, Informational, Unmanaged, or Normal.
1 Not displayed by default. To display hidden properties, see Adding and Removing Properties from Property Views.
Displaying Device Data Collection Status at the Network Level
The Network Data Collection table allows you to quickly see the data collection status of devices across the network. To display the device data collection status:
•
Table 8-6 lists the data collection status parameters. ICMP, SNMP, Hypervisor,CLI,CSV Bulk Stats,NetFlow,JMX,DCM Bluk Stats, Status,Last Full Poll Time
Table 8-6 Data Collection Parameters
Internal ID1
Internal device ID. Prime Performance Manager assigns this ID to the device for internal use.
Device Name
The display name of the device.
ICMP
Indicates whether the device IP data collector is active, inactive, or not configured for polling.
SNMP
Indicates whether the device SNMP data collector is active, inactive, or not configured for polling.
Hypervisor
Indicates whether the device Hypervisor data collector is active, inactive, or not configured for polling.
CLI
Indicates whether the device CLI data collector is active, inactive, or not configured for polling.
CSV Bulk Stats
Indicates whether the device CSV bulk statistics data collector is active, inactive, or not configured for polling.
NetFlow
Indicates whether the device NetFlow data collector is active, inactive, or not configured for polling.
JMX
Indicates whether the device Java Management Extensions data collector is active, inactive, or not configured for polling.
DCM Bulk Stats
Indicates whether the Cisco Digital Collection Manager bulk statistics data collector is active, inactive, or not configured for polling.
Last Full Poll1 Time
The date and time of the last full poll of the device for device-related MIBs.
Status
Current device status:
•
•
•
•
•
•
•
1 Not displayed by default. To display hidden properties, see Adding and Removing Properties from Property Views.
Displaying Device Software at the Network Level
The Network Software table lists the software versions and descriptions for each device in the Prime Performance Manager network. To display the device software information:
•
Table 8-7 lists the Software parameters.
Displaying Device Contacts and Locations at the Network Level
The Contacts/Locations link displays the device contacts and locations if that information was entered for the device. To display the device contacts and locations:
•
Table 8-8 lists the Contact and Location properties.
Table 8-8 Device Contacts and Locations at the Network Level
Internal ID1
Internal device ID. Prime Performance Manager assigns this ID to the device for internal use.
Display Name
The device display name.
IP Address or DNS Hostname1
IP address or DNS name of the device, as the Prime Performance Manager discovered it.
SysName1
System name of the device.
Management IP Address1
The IP address that SNMP uses to poll the device.
Device Type
The device type, which is usually based on the device family, for example, Cisco1706 for Cisco 1706 Series Routers. If the device family type is not known, IP Device is displayed. Prime Performance Manager gateway and unit servers are listed as ciscoGatewayServer and ciscoUnitServer.
Contact
The device contact name.
Location
The device location.
Status
Current device status:
•
•
•
•
•
•
•
1 Not displayed by default. To display hidden properties, see Adding and Removing Properties from Property Views.
Displaying Device Vendors at the Network Level
The Vendors link displays the device types, manufacturers, and status. To display the device vendor information:
•
Table 8-9 displays the device vendor information.
Table 8-9 Device Vendor Information
Internal ID1
Internal device ID. Prime Performance Manager assigns this ID to the device for internal use.
Display Name
The device display name.
IP Address or DNS Hostname1
IP address or DNS name of the device, as the Prime Performance Manager discovered it.
System Name1
System name of the device.
Management IP Address1
The IP address that SNMP uses to poll the device.
Device Type
The device type, which is usually based on the device family, for example, Cisco1706 for Cisco 1706 Series Routers. If the device family type is not known, IP Device is displayed. Prime Performance Manager gateway and unit servers are listed as ciscoGatewayServer and ciscoUnitServer.
Vendor
The device manufacturer.
Status
The device status, for example, Active.
1 Not displayed by default. To display hidden properties, see Adding and Removing Properties from Property Views.
Displaying Device Details in Cisco Prime Format
If Prime Performance Manager is integrated with Cisco Prime Central (see "Prime Central Integration"), you can display the device details in a format that matches Prime Central. Because fewer properties are displayed than the Devices tab, Prime Style can provide a quick look at the Prime Performance Manager devices in an organization that aligns with their display in Prime Central.
To display Prime Performance Manager device details in Prime Central format:
•
Table 8-8 lists the device properties displayed in the Prime Style tab.
Table 8-10 Device Details in Prime Style
Internal ID1
Internal device ID. Prime Performance Manager assigns this ID to the device for internal use.
Unit1
The unit to which the device is assigned.
Device Name
IP address or DNS name of the device, as the Prime Performance Manager discovered it.
Device Type
The device type, which is usually based on the device family, for example, Cisco1706 for Cisco 1706 Series Routers. If the device family type is not known, IP Device is displayed. Prime Performance Manager gateway and unit servers are listed as ciscoGatewayServer and ciscoUnitServer.
Vendor
The device manufacturer.
Status
Current device status:
•
•
•
•
•
•
•
Management IP Address
IP address used to poll the device.
Software Version
The software version installed on the device.
System Name
The device system name.
1 Not displayed by default. To display hidden properties, see Adding and Removing Properties from Property Views.
Adding Device Topologies to Network Weathermap
Network Weathermap is a third party, open-source software application that takes data from your network devices and uses it to display a single-page overview of the current network state. You can add Network Weathermap to Prime Performance Manager and display Prime Performance Manager device topologies on it.
The following topics tell you how to download and install Network Weathermap, and how to create and manage Network Weathermap device topologies.
•
•
•
•
If you add Network Weathermap to Prime Performance Manager, remember that it is not a Cisco application. If you do not know how to use Network Weathermap, visit the developer's website for user documentation, software release information, and other product details. Information for using Network Weathermap is not provided in this guide.
http://http://www.network-weathermap.com/
Installing Network Weathermap
To install Network Weathermap:
Step 1
yum install httpd.*Step 2
yum install phpyum install php-gdStep 3
http://www.network-weathermap.com/download
Step 4
Step 5
Weathermap files are placed in /var/www/html/weathermap
Step 6
Step 7
service httpd startStep 8
/opt/CSCOppm-gw/bin/ppm networktopology enableStep 9
Step 10
On the far right, you will see the Topology and Weathermap tabs.
Step 11
Adding Device Topologies to Network Weathermap
After you install and enable Network Weathermap, you can create a topology of selected Prime Performance Manager devices and add them to the Network Weathermap.
Note
To add a device topology to Network Weathermap:
Step 1
Step 2
Step 3
Step 4
Step 5
Step 6
A list of available devices is displayed.
Step 7
Step 8
The new link is displayed under Links.
Step 9
•
•
•
Step 10
Step 11
Your device topology is displayed.
Step 12
http://www.network-weathermap.com/docs
Editing Network Weathermap Device Topologies
To edit a Network Weathermap device topology:
Step 1
Step 2
Step 3
The available topologies are displayed.
Step 4
The device list and created topologies are displayed.
Step 5
Step 6
Step 7
Deleting a Network Weathermap Device Topologies
To remove a Network Weathermap device topology:
Step 1
Step 2
Step 3
The available topologies are displayed.
Step 4
Uninstalling Network Weathermap
If you want to remove Network Weathermap from Prime Performance Manager, you can either disable it using the ppm networktopology disable command, or uninstall it.
To uninstall Network Weathermap:
Step 1
Step 2
yum erase php-gdyum erase phpStep3:
Step 3
yum erase httpd*
Managing Devices in the Network-Level View
At the network-level device view, operator or higher users can perform some device modifications. To manage network devices:
Step 1
Step 2
•
•
•
•
•
•
•
•
•
•
•
•
See Displaying Device Information at the Network Level for information on displaying these views.
Step 3
Step 4
•
•
•
•
•
•
•
•
•
•
•
•
Note
Step 5
•
•
Note
Editing a Device Name, Web Port, Time Zone, and Location
Within the device network view, you can change the device name, web port, time zone and location. To edit these device properties:
Step 1
Step 2
Step 3
Step 4
•
•
•
•
Step 5
Editing the Device Credentials
To edit the device SNMP or Telnet/SSH credentials:
Step 1
Step 2
Step 3
Step 4
SNMP
•
•
•
SNMP v1, v2
•
SNMP v3
•
•
–
–
•
–
–
–
•
Telnet/SSH
•
•
–
–
–
–
–
–
–
–
–
–
–
–
•
•
•
•
•
•
Step 5
The edited credentials are saved for the device.
Editing the Report Policy Assigned to a Device
To edit the report policy assigned to a device:
Step 1
Step 2
Step 3
Step 4
Step 5
Editing the Polling Group Assigned to a Device
To edit the polling group assigned to a device:
Step 1
Step 2
Step 3
Step 4
•
•
•
Step 5
Editing the Device Management IP Addresses
To edit the polling group assigned to a device:
Note
Step 1
Step 2
Step 3
The Edit Management IP Address dialog box displays the following:
•
•
Step 4
•
•
•
•
Step 5
Relocating Devices to Units
To relocate a device to a different unit:
Step 1
Step 2
Step 3
Step 4
Step 5
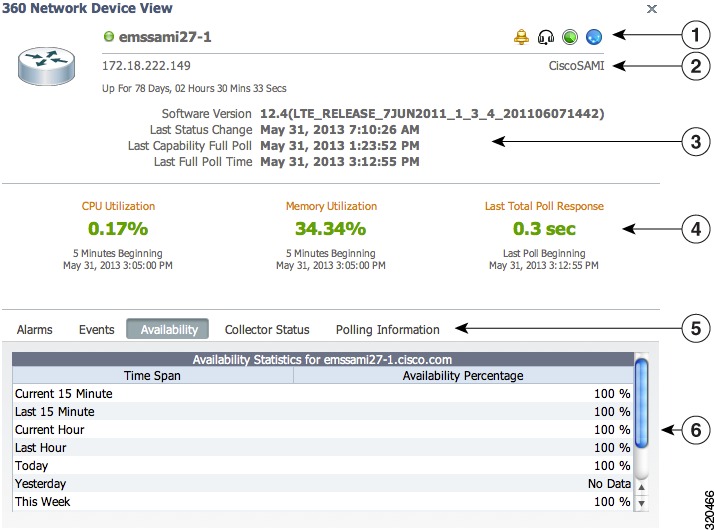
Displaying the 360 Device Details View
The Details Displayed on Device Links user preference allows you to display a 360 device details view when you click the link icon next to device hyperlinks. (The 360 device details view is enabled by default.To customize user preferences, see Customizing the GUI and Information Display.)
To display the 360 device details view:
Step 1
•
•
•
•
Step 2
The 360 Network Device Details window appears. Information displayed from the window includes:
•
•
•
•
•
Figure 8-1 360 Network Device Details
Note
Step 3
Displaying Device Information at the Device Level
Prime Performance Manager allows you to drill down to individual devices and review additional parameters and details not displayed at the network level. including device-level reports, dashboards, properties, event history, active alarms, status, and availability.
Device time stamps can be displayed in the device time zone by enabling the Display Device Level Data in Device Time Zone option in User Preferences. Time stamps affected by this option include the time stamp displayed in report titles, calendar popup selections, summary table maximum date strings, graph date strings, tooltip hover information,.the Timestamp column in report table format, and the Timestamp values in exported CSV files. For information about changing user preferences, see Customizing the GUI and Information Display.
To display individual device information:
Step 1
•
•
•
•
•
Step 2
At the individual device view, the following is displayed:
Note
•
•
•
Table 8-11 Device Details at the Device Level
Toolbar
Actions menu
Allows you to modify device parameters. See Managing Individual Devices.
Ping
Pings the selected device.
Traceroute
Runs a traceroute to the selected.
Launch
Launches the device home page.
Naming Information
Display Name
The device display name.
Custom Name
The custom device name, if one is defined. If not, this field displays Unknown.
Sync Name
If devices were imported from Prime Network, the device name (or business tag, if defined) as it appears in Prime Network.
IP Address or Host Name
The device IP address or DNS name, as discovered by Prime Performance Manager.
System Name
The name set on the router and returned, using the SNMP variable sysName.
Unit
The name of the unit to which the device belongs.
Homepage
Provides a link to the device home page.
Report Policy
If the device has a report policy, the policy is displayed here. If the device doesn't have a policy, None is displayed. Clicking its link takes you to the Report Policy tab.
Status Information
Sending Alarms
Indicates whether the device is sending alarms, Yes or No.
Alarm Severity
Indicates the alarm severity of the object.
Status
Current device status:
•
•
•
•
•
•
•
Last Status Change
Date and time when the device status was last changed.
Status Reason
Reason for the current device status. (If you cannot see all of the status reason text, place the cursor over the cell to see the full text in a tooltip.) A list of possible reasons is provided in the stateReasons.html, located at:
/opt/CSCOppm-gw/apache/share/htdocs/eventHelp.
Device Performance
Memory Utilization
Displays the memory utilization at the time of the poll. If the device has multiple memory pools, the utilization is the average of the pools. Text color is based on the Enabled Colors user preference:
•
•
•
For information about user preferences, see Customizing the GUI and Information Display.
CPU Utilization
Displays the memory utilization at the time of the poll. If the device has multiple CPUs, the utilization is the average of the CPUs. Text color is also based on the Enabled Colors user preference.
Descriptive Information
Contact
The contact person for the managed device and contact information, if available. If the contact details are not available, this field displays Unknown.
Software Version
The software version (for example, the ONS package or IOS version) that is installed on the device.
Software Description
Comprehensive information about the software that is installed on the device.
Device Type
The device type, which is usually based on the device family, for example, Cisco1706 for Cisco 1706 Series Routers. If the device family type is not known, IP Device is displayed. Prime Performance Manager gateway and unit servers are listed as ciscoGatewayServer and ciscoUnitServer.
Location
The device physical location. If the device location details are not available, this field displays Unknown.
Vendor
The device manufacturer.
Uptime Information
Uptime
The time the device has been up, in days, hours, minutes, and seconds.
Reboot Time
The date and time of the last device reboot.
Reboot Reason
The reason for the last reboot of the device.
•
Table 8-12 Device Data Collection at the Device Level
Polling Information
Status
Indicates the device status. See Table 8-2 for a list of device statuses.
Report Polling
Indicates whether report polling is enabled for this device.
First Discovered
The date and time when Prime Performance Manager first discovered the device.
Last Poll IP Address
The last IP address that was polled for this device.
Last Capability Full Poll Time
The last time the device capabilities were assessed. This query is performed once every 24 hours at a minimum. It also occurs when Prime Performance Manager detects a device configuration or entity change, or when the SystemCapabilities or UserCapabilities file changes.
Last Full Poll Time
The date and time of the last full poll of the device for device-related MIBs.
Last Poll Response (secs)
The time, in seconds, taken by this device to respond to the last poll request.
Avg Poll Response (secs)
The average time, in seconds, taken by this device to respond to poll requests.
Polling Group
The polling group to which the device is assigned. For information about polling groups, see Creating and Editing Device Polling Groups.
Report Policy
The report policy assigned to the device. If no report policy is assigned, the field will display "This device only." For information about report policies, see Creating Report Policies.
Collector Status
ICMP
Indicates whether the Internet Control Message Protocol is active.
SNMP
Indicates whether data has been retrieved through SNMP. Will be Active unless data has never been retrieved using SNMP.
Hypervisor
Indicates whether a hypervisor is active. This will normally be active for VM devices.
CLI
Indicates whether an XML poll was performed:
•
•
•
CSV Bulk Stats
Indicates whether CSV bulk stats were collected. This will be Not Configured for any device other than the Cisco ASR 5000. For the Cisco ASR 5000, the field will display:
•
•
•
Netflow
Indicates whether Netflow data was collected.
•
•
•
JMX
Indicates whether Java Management Extensions data was collected.
DCM Bulk Stats
Indicates whether Cisco Data Collection Manager bulk stats were collected.
IP Addresses for Management
IP Address
IP addresses associated with this device, including the primary SNMP address and all backup IP addresses that are intended for SNMP.
Last Full Poll Time
The date and time of the last full poll of the device. If the IP address has never been polled, Prime Performance Manager displays Never Polled.
Manageable
Indicates whether the IP address is used for SNMP polling, Yes or No.
•
•
•
•
•
•
Note
Managing Individual Devices
When you drill down to an individual device, you can perform the management actions that you can perform from the device summary window.
To manage an individual device:
Step 1
•
•
•
•
•
Step 2
Step 3
Step 4
•
•
•
•
•
•
•
•
•
Creating and Editing Device Polling Groups
Device polling is the frequency at which Prime Performance Manager retrieves updated information from devices. When you complete device discovery (see Chapter 5 "Discovering Network Devices"), Prime Performance Manager assigns devices to polling groups based on the device type. For example, all discovered Cisco 7606 Series Routers are assigned to a Cisco7606s polling group, all Cisco MWR 1941-DC Mobile Wireless Routers are placed in a CiscoMWR-1941-DC polling group, and so on. The number of polling groups created during device discovery depend on the number of unique device types Prime Performance Manager discovers. If all devices belong to the same device type, then only one polling group is created.
Polling groups are defined by the attributes listed in Table 8-13. All polling groups created during device discovery are assigned the default values. However, you can:
•
•
Editing Polling Group Parameters
Complete the following steps to edit the parameters of an existing polling group:
Step 1
Step 2
Step 3
•
•
See Table 8-13, for polling group parameter descriptions and default values.
Note
Step 4
Creating a New Polling Group
Complete the following steps to create a new polling group:
Step 1
Step 2
Step 3
Step 4
•
•
•
See Table 8-13, for polling group parameter descriptions and default values.
Note
Step 5
Assigning Devices to Polling Groups
By default, Prime Performance Manager creates device type polling groups and assigns devices to them based on their device type. You can create custom polling groups and reassign the devices to them. To assign a device to a custom polling group:
Step 1
Step 2
Step 3
Step 4
Step 5
•
•
•
•
Step 6