-
Cisco Prime Performance Manager User Guide, 1.1
-
Preface
-
Prime Performance Manager Overview
-
Managing Gateways and Units Using the Command Line Interface
-
Using the Prime Performance Manager Web Interface
-
Discovering Devices
-
Configuring SSL between Gateways and Units
-
Managing Users
-
Managing Reports and Dashboards
-
Using Summary Lists
-
Using Alarms and Events
-
Configuring Thresholds
-
Viewing Home Page Information
-
Viewing System Logs and Messages
-
Managing Prime Performance Manager Units
-
Configuring Polling Groups
-
Configuring Upstream Alarm Hosts and Tuning Event and Alarm Parameters
-
Configuring Device Access Credentials for Y.1731 and Ethernet Flow Point Reports
-
Configuring Firewalls
-
Backing Up and Restoring Prime Performance Manager
-
Prime Performance Manager and IPv6
-
Commands Reference
-
Glossary
-
Index
-
 Feedback
Table Of Contents
Using the Prime Performance Manager Web Interface
Accessing the Prime Performance Manager Web Interface
Checking Your Browser Settings
Using the Web Interface Navigation Tree
Customizing Date and Time Ranges
Changing the GUI Polling Refresh Setting
Using the Prime Performance Manager Web Interface
The following topics provide information about using the Cisco Prime Performance Manager web interface:
•
Accessing the Prime Performance Manager Web Interface
•
Accessing the Prime Performance Manager Web Interface
The Cisco Prime Performance Manager web interface requires one of the following web browsers with JavaScript enabled:
•
•
•
Note
To access the Cisco Prime Performance Manager web interface:
Step 1
http://ppm11-server:4440Where ppm11-server is the name of the server where Prime Performance Manager is installed and Port 4440 is the default port.
Step 2
Figure 3-1 Prime Performance Manager Login Window
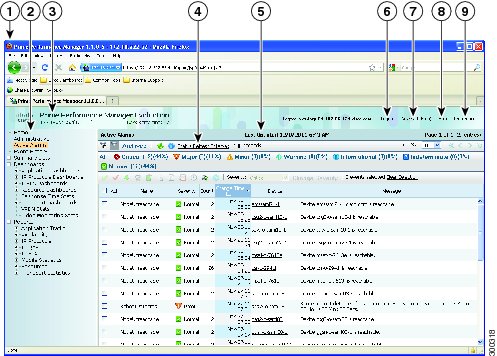
After you log in, the Cisco Prime Performance Manager GUI application launches. By default, the Active Alarms window is displayed (Figure 3-2). (For a description of the Active Alarms window and functions, see Chapter 9 "Using Alarms and Events.")
The GUI window is comprised of the following elements:
•
–
–
–
–
–
–
•
•
Figure 3-2 Prime Performance Manager GUI
Title bar
Logout
Navigation tree
Beta GUI
Prime Performance Manager version, and server name
Online help
Content area
Preferences
Last content update date and time
Checking Your Browser Settings
After you display the Prime Performance Manager web interface, you can check your browser and screen settings:
Step 1
Step 2
Step 3
•
•
•
•
•
•
•
•
Using the Web Interface Navigation Tree
Prime Performance Manager options appear in the navigation tree in the left pane of the GUI window (See Figure 3-2). Clicking a tree item displays the contents selected item in the content area. A plus (+) or minus (-) to the left of the item indicates whether the item has additional items under it.
Prime Performance Manager automatically updates the navigation tree when changes occur to discovered devices or the network. When any changes occur in the navigation tree, the changes are reflected in the web interface. For example, if you delete a report from the Report Status tab, the report is removed from the navigation tree.
Table 3-1 lists the navigation tree items with references to topics that describe the item in more detail.
Table 3-1 Cisco Prime Performance Manager Navigation Tree
Home
Provides links to Prime Performance Manager user and reports documentation, commands, and other information. (See Chapter 11 "Reviewing Prime Performance Manager Home Page Information.").
Administrative
Provides the following tabs:
General—Shows Prime Performance Manager system information including messages, logs, status, and properties.
SNMP—Displays the SNMP Editor to edit and save SNMP settings. See Adding SNMP Credentials.)
Polling Groups—Allows you to create device polling groups. See Chapter 14 "Creating and Editing Device Polling Groups."
Telnet/SSH—Allows you to add and edit Telnet and SSH credentials for Y.1731 and Ethernet Flow Point reports. See Chapter 16 "Configuring Device Credentials for Y.1371 SLA and Ethernet Flow Point Reports."
Unit Editor— Enables you to assign devices to units. See Chapter 13 "Managing Prime Performance Manager Units.")
Discovery—Allows you to discover network devices using Prime Performance Manager. See Chapter 4 "Discovering Network Devices."
Prime Network—Allows you to import a Prime Network device inventory. See Importing Prime Network Device Inventories.
User Management—Displays all users in the system along with the time of their most recent login, their access level, and their account status. See Chapter 6 "Setting Up and Managing Users."
Event Editor— Allows you configure event properties and also define the upstream OSS hosts. See Chapter 15 "Configuring Upstream Alarm Hosts and Tuning Event and Alarm Parameters."
Threshold Editor—Allows you to create and edit report thresholds. See Chapter 10 "Configuring Thresholds."
If Prime Performance Manager user access is enabled, only users with Administrator (Level 5) access can see all options on the Administrative window.
Active Alarms
Displays information about Prime Performance Manager alarms. See Chapter 9 "Using Alarms and Events."
Event History
Displays information about Prime Performance Manager events. See Chapter 9 "Using Alarms and Events."
Summary Lists
Displays basic summary information about all discovered network objects. See Chapter 8 "Using Summary Lists."
Dashboards
Displays and allows you to manage Prime Performance Manager dashboards. See Chapter 7 "Working With Reports and Dashboards."
Reports
Displays and allows you to manage Prime Performance Manager reports. See Chapter 7 "Working With Reports and Dashboards."
Customizing Date and Time Ranges
Some windows require that you select date ranges for generating historical graphs. To customize the date and time range:
Step 1
Step 2
•
•
Note
Step 3
The Prime Performance Manager web interface accepts and applies the changes by generating a report for the chosen server time (in case of reports).
Using the Toolbar
The Prime Performance Manager web interface navigation tree toolbar displays tools and options shown in Table 3-2. However, the tools and options that appear depend upon the object you select in the navigation tree.
Table 3-2 Cisco Prime Performance Manager Web Interface Toolbar
Last Updated
—
The date and time Cisco Prime Performance Manager last updated the displayed information.
Page
—
Shows your location (page X of X total pages) and lists the total number of entries.
Refresh
Refreshes of the current web page.
Pause
Pauses the page refresh. Click Pause to disable the Page Refresh that would normally occur after the Status Refresh Interval. Click Pause again to re-enable the Status Refresh Interval.
Status Refresh Interval
—
Allows you change the default refresh interval. Enter a value between 180 (default) and 900 seconds. Changes only apply to the current page. Navigating away it sets the status refresh interval back to the default.
Page Size
—
Drop-down list of page sizes (the number of table rows in the display). Click the drop-down arrow to select a different value. The value that you select becomes the default page size for all pages in the web interface.
The title bar displays the current page and total number of table entries.
Quick Search
—
Text box to filter the objects listed under the Summary List tables (Except for IP Addresses and Point Code tables). Enter the string in the text box to filter the table by and then press Enter. The rows under the table are filtered based on the string entered.
Summary table columns used for filtered string searches include:
•
•
•
•
•
•
•
Clear Filter
Clears the search filter.
>
—
Advances the display to the next page of information.
>>
—
Advances the display to the last page of information.
<
—
Moves the display to the previous page of information.
<<
—
Moves the display to the first page of information.
Critical
The number and percentage of critical alarms on the device.
Major
The number and percentage of major alarms on the device.
Minor
The number and percentage of minor alarms on the device.
Warning
The number and percentage of warning alarms on the device.
Informational
The number and percentage of informational alarms on the device.
Indeterminate
The number and percentage of indeterminate alarms on the device.
Normal
The number and percentage of normal alarms on the device.
Customize date and time range
Opens the Choose a Date Range Server timezone dialog box.
Graph Series Editor
Opens the Graph Series Editor dialog box, which provides a check box for each available data series. Check the box to display a series; uncheck it to hide a series. Clicking OK without selecting a series cancels the action. Prime Performance Manager displays no more than 10 series, by default.
Run
Runs the report type for the chosen duration.
Export report as a CSV file
Exports the data in the table to comma-separated value file (CSV file). You can save this file to disk or open it with an application that you choose (for example, Microsoft Excel).
Data Range (timezone)
—
Label that shows the chosen time range for the historical statistics. The label displays the data range with server time.
Type
—
Drop-down list of report types.
Duration
—
Drop-down list of default time ranges. Select one of these options, then click the Run tool. To specify a nondefault time range, click the Customize Date and Time Range tool. See Customizing Date and Time Ranges.
Output
—
Drop-down menu that provides these options:
•
•
•
Sort Parameter
—
Used in the graph output of certain reports to select the criteria ti include a top set of series. Also for ordering the corresponding graphs displayed.
Actions
—
The Actions menu appears for all summary lists except Device Distributions and Software Versions. Action menu items appear when you hover over the Actions link. For more information, see Editing Summary List Items.
Help for Reports
Auto-generated reports help; shows the MIB variables that are polled for generating the selected report with the calculations (if any) performed on them.
Navigating Table Columns
You can sort, show, or hide the columns in some tables in Prime Performance Manager to meet your specific needs. The web interface automatically saves your new settings and, thereafter, launches the interface with the new settings.
You can hide table columns in the Prime Performance Manager web interfaces. In the web interface, you can search for specific information and page through long tables by using its Search and Paging features.
•
•
–
–
•
•
–
–
•
If you sort a table based on the Devices column, Prime Performance Manager sorts the table based on the discovered device DNS names. If you modified your web preferences to identify devices by their user-defined names, Prime Performance Manager sorts the table, based on the device user-defined names. For more information, see Changing the Web Preferences.
Changing the Web Preferences
You can change the device information that appears in Prime Performance Manager GUI, change report auto expand settings, optimize the GUI for slow connections and change the GUI page refresh rate. These settings are located in the Web Preferences window. To change the web preferences settings:
Step 1
Step 2
•
–
–
–
•
–
–
–
–
•
Changing the GUI Polling Refresh Setting
You can change the frequency Prime Performance Manager GUI page refresh setting on a system-wide level. You can change the minimum, maximum, and default refresh settings. To change the system-wide refresh settings:
Step 1
Step 2
Step 3
# Status refresh default interval in secondsSTATE_REFRESH_DEFAULT = 180# Status refresh minimum interval in secondsSTATE_REFRESH_MIN = 180# Status refresh maximum interval in secondsSTATE_REFRESH_MAX = 900Where:
•
•
•
For example, to change the status refresh poller default to 300 seconds, change the STATE_REFRESH_DEFAULT line to:
STATE_REFRESH_DEFAULT = 300The acceptable refresh range is 180 to 900 seconds.
Step 4