-
Cisco Active Network Abstraction NetworkVision User Guide, 3.6
-
Cisco ANA Client Overview
-
Getting Started
-
Working with Cisco ANA NetworkVision Tables
-
Working with Cisco ANA NetworkVision Maps
-
Viewing Device Properties
-
Viewing Network Device Inventory
-
Working with Links
-
Working with Tickets
-
Working with Cisco ANA PathTracer
-
Working with Business Tags
-
Icon Reference
-
 Feedback
Table Of Contents
Accumulating the Affected Parties in an Alarm
Accumulating the Affected Parties in the Correlation Tree
Updating Affected Severity Over Time
Viewing a Detailed Report for the Affected Pair
Ticket Status in the Ticket Pane
Working with Tickets
This chapter describes how Cisco ANA NetworkVision correlates alarms and how to view the tickets and ticket properties, including correlated alarms, active alarms and alarm history. In addition, it describes ticket management, for example, acknowledging a ticket.
•
About Alarms, describes the ability to correlate related alarms and detect the root cause.
•
•
•
•
•
•
•
•
Cisco ANA NetworkVision enables you to view and acknowledge tickets using the ticket pane. For more information, see Ticket Pane.
About Alarms
Cisco ANA provides the ability to correlate related alarms and events and accurately detect the root cause. The following scenarios are supported by Cisco ANA and illustrate alarm correlation:
•
•
•
•
•
For more information about the definition of a ticket, alarm, and event, see Events, Tickets and Alarm Definitions.
For more information about alarms, refer to the Cisco Active Network Abstraction Fault Management User Guide.
For more specific information on tickets, including fault and IP correlation, MPLS-TE (Traffic Engineering), refer to the Cisco Active Network Abstraction Managing MPLS User Guide.
Alarm Life-Cycle
Cisco ANA NetworkVision correlates all the subalarms to the original parent alarm (root-cause alarm), and changes its status accordingly.
Cisco ANA provides for an aging period before closing alarms. The alarm may remain open for correlation even if it has already been cleared or acknowledged. In other words, for a specified aging period, new correlated alarms are accepted into a parent alarm even after the parent alarm has been cleared or acknowledged.
An alarm is considered closed after the parent alarm has been cleared and the aging period has passed even if the parent alarm still contains open correlated alarms.
Accumulating Affected Parties
When a fault occurs, Cisco ANA automatically calculates the affected parties (automatic impact analysis), for example, when a link goes down and embeds this information in the ticket along with all the correlated faults. You can view a list of all the inter-site connections that are affected and the sites that have lost connectivity. For more information about proactive impact analysis, see Viewing Impact Analysis.
The Affected Parties tab displays the services (affected pairs) that are potentially affected (automatic impact analysis) by the ticket. For more information about the Affected Parties tab, see Affected Parties Tab.
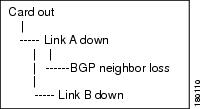
In the example below the following types of alarms exist in the correlation tree:
•
•
•
An event sequence is correlated to each of these alarms.
Figure 8-1 Event Sequence Example
For each type of alarm Cisco ANA NetworkVision provides a report of the affected parties. This report includes the accumulation of:
•
•
Each report includes the accumulation of the affected report of all the events in its own correlation tree.
For example, in the diagram:
•
•
Accumulating the Affected Parties in an Alarm
When there are two events that form part of the same event sequence in a specific alarm the reoccurring affected pairs are only displayed once in the Affected Parties tab. Where there are different affected severities reported for the same pair, the pair is marked with the severity that was reported by the latest event, according to the time stamp.
Accumulating the Affected Parties in the Correlation Tree
Where there are two or more alarms:
•
•
•
Then the reoccurring affected pairs are only displayed once in the Affected Parties tab. Where there are different affected severities reported for the same pair, the pair is marked with the highest severity.
In this example X and Y are the OIDs of edge points in the network and there is a service running between them. Both of the alarms "Link B down" and "BGP neighbor loss" report on the pair "X<->Y" as affected:
•
•
The affected severity priorities are:
•
•
•
"Card out" reports on "X<->Y" as "Real" affected only once.
Updating Affected Severity Over Time
Cisco ANA has the ability to update the affected severity of the same alarm (report) over time due to the fact that in some cases the affect of the fault on the network cannot be determined until the network has converged.
For example, a link-down alarm creates a series of affected severity updates over time. These updates are added to the previous updates in the system database. In this case the system provides the following reports:
•
•
•
•
This functionality is currently only supported for link down.
Filtering Tickets by Device
Cisco ANA NetworkVision enables you to filter the tickets that are shown in the ticket pane so that only the tickets of a selected device or network element are displayed.
To filter tickets for a specific network element:
Step 1
Step 2
Note
The filter can be removed to display all the tickets in the system. For more information about removing a filter, see Filtering Tickets by Criteria.
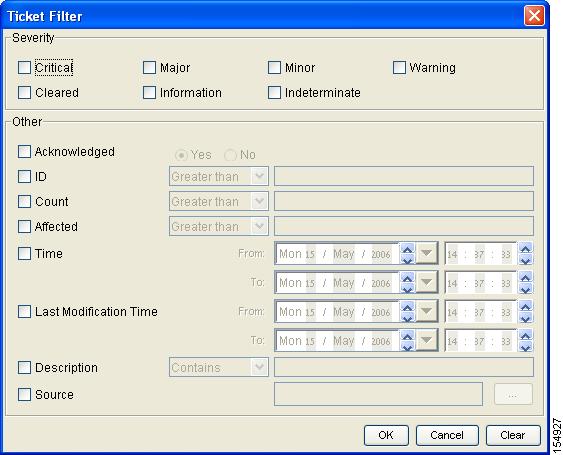
Filtering Tickets by Criteria
Cisco ANA NetworkVision enables you to define a filter for the tickets displayed in the ticket pane according to various criteria; for example, tickets can be filtered according to the number of affected parties or acknowledged tickets.
To define the ticket filter:
Step 1
Figure 8-2 Ticket Filter Dialog Box
The Severity area in the Ticket Filter dialog box enables the user to filter the tickets displayed in the ticket pane by selecting one or more options. For more information about severities, see Status of Network Objects.
The checkboxes displayed in the Other area reflect the columns displayed in the ticket pane and enable the user to filter the tickets according to any of these criteria. For more information about the columns displayed in the ticket pane, see Ticket Pane.
The Source checkbox (selected by default) enables the user to filter the tickets that are shown in the ticket pane so that only the tickets of a selected device or network element are displayed by selecting a source.
Step 2
Step 3
Note
To remove the ticket filter:
Step 1
Step 2
Step 3
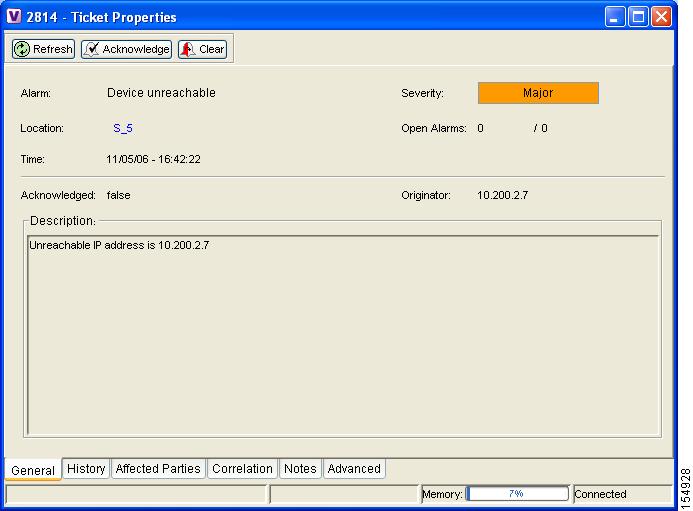
Opening Ticket Properties
The properties of a selected ticket can be viewed by displaying the Ticket Properties dialog box. For example, you can view alarm severity, correlated alarms, active alarms, alarm history or the source of the alarm.
To open ticket properties:
Step 1
or
Right-click on a ticket in the ticket pane to display the Ticket shortcut menu, select Properties.
The Ticket Properties dialog box is displayed.
Figure 8-3 Ticket Properties Dialog Box
The information displayed in the Ticket Properties dialog box corresponds with the information displayed in the ticket pane. The ID number displayed in the header corresponds to the ID number of the ticket selected in the ticket pane.
The Ticket Properties dialog box is divided into the following areas:
Tabbed Pane
The Ticket Properties dialog box is divided into the following tabs:
•
•
•
•
Correlation Tab.•
•
General Tab
The following fields are displayed in the General tab providing information about the compiled alarm:
•
•
•
•
•
•
•
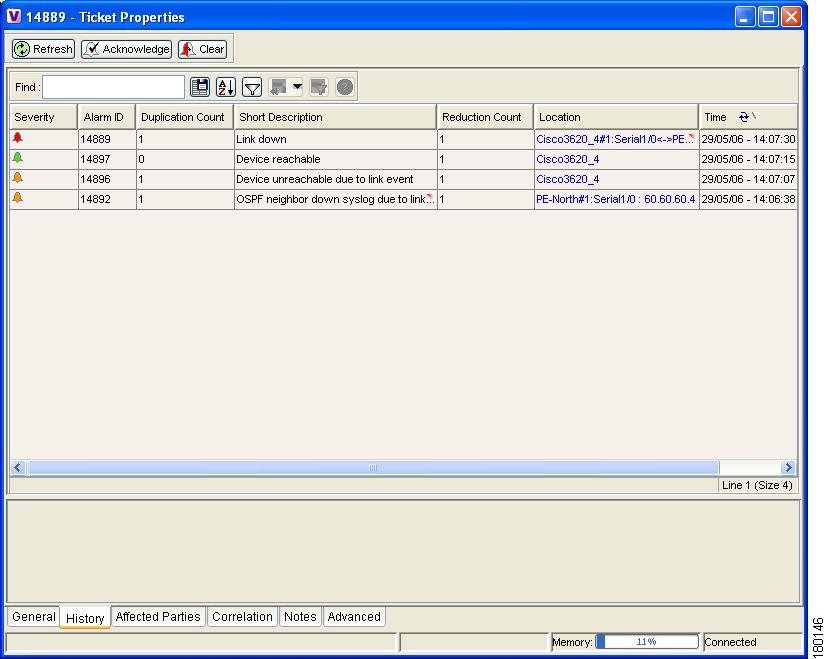
History Tab
The History tab enables you to display the history of the ticket, including all the events. The History tab is displayed.
Figure 8-4 History Tab
The following columns are displayed in the History tab providing information about the compiled alarm:
•
•
•
•
•
•
•
Affected Parties Tab
When a fault occurs Cisco ANA automatically calculates the affected parties (automatic impact analysis), for example, when a link goes down, and embeds this information in the ticket along with all the correlated faults. You can view a list of all the endpoints that are affected. For more information about proactive impact analysis, see Viewing Impact Analysis.
The Affected Parties tab displays the service resources (affected pairs) that are affected (automatic impact analysis) by the ticket. For more information about accumulating affected parties, see Accumulating Affected Parties.
The Affected Parties tab is displayed.
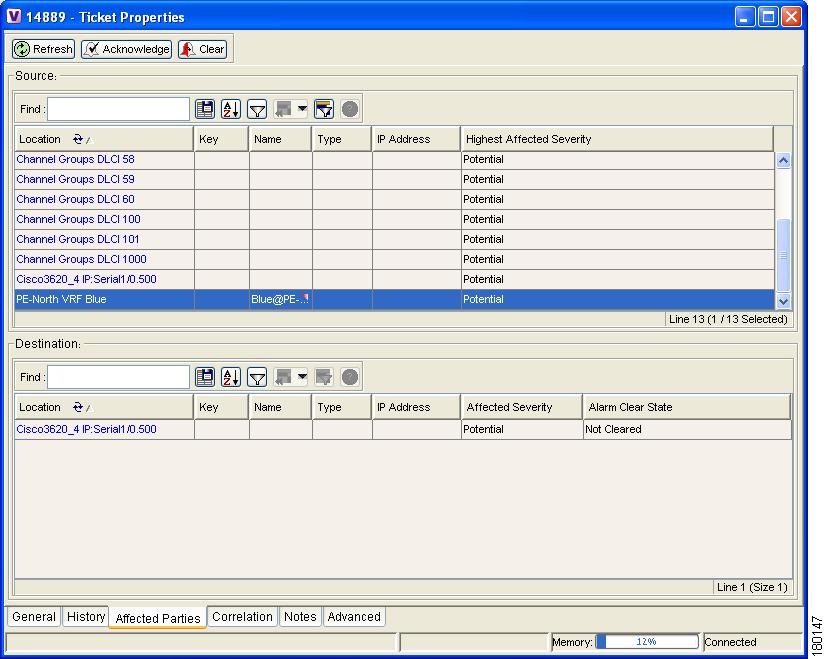
Figure 8-5 Affected Parties Tab
The Affected Parties tab is divided into two areas, namely, Source and Destination. The Source area displays the set of affected elements (A side and Z side). The following columns are displayed in the Affected Parties tab providing information about the affected parties:
•
•
•
•
•
•
–
–
–
–
When an affected side (a row) is selected in the Source area the selected element's related affected pairs are displayed in the Destination area.
The following additional columns are displayed in the Destination area table in the Ticket Properties window:
•
•
–
–
In addition, you can view a detailed report for every affected pair that includes a list of the events that contributed to this affected pair. For more information about viewing a detailed report, see Viewing a Detailed Report for the Affected Pair.
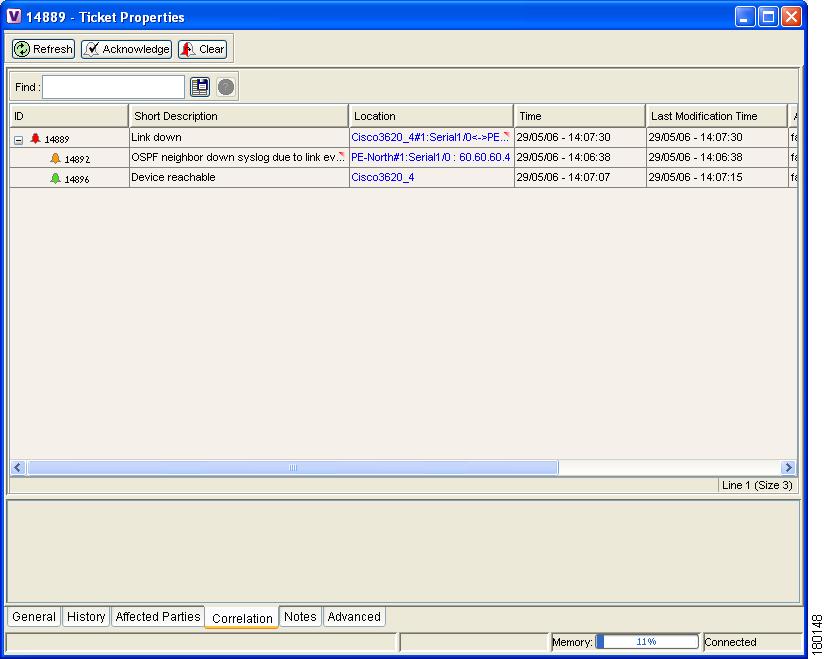
Correlation Tab
The Correlation tab displays all the alarms that are correlated to the selected ticket.
Figure 8-6 Correlation Tab
Each branch provides a short description of the alarm, a severity icon, ID, location, and time of the alarm. For more information about the columns displayed in the Correlation tab, see Ticket Pane.
The following columns are displayed in the Correlation tab providing information about the alarm as follows:
•
•
•
•
•
•
•
The Find field on the toolbar enables you to search for information in the Correlated Alarms table.
Notes Tab
The Notes tab enables you to add and save notes for the selected ticket. The Notes tab is displayed below.
To add text, enter text in the Notes field and click Save Notes. The new text is added to any previously existing text.
Note
•
Advanced Tab
The Advanced tab enables you to view all the affected devices, correlation, duplication and reduction counts for the selected ticket. In addition, it provides any other additional information available about the ticket. The Advanced tab is displayed below.
The following fields are displayed in the Advanced tab providing information about the compiled alarm:
•
•
•
•
•
•
•
Toolbar
The Ticket Properties dialog box contains the following tools:
Refreshes the information displayed in the Ticket Properties dialog box.
Acknowledge—Acknowledges that the ticket is being handled and the status of the ticket is displayed as true in the ticket pane and in the Ticket Properties dialog box. For more information, see Acknowledged Ticket.
If a ticket was acknowledged, and some events were correlated to it afterwards, then the ticket is considered to have been NOT acknowledged.
Note
Clear—Requests the relevant Cisco ANA to remove the faulty network element from the Cisco ANA networking inventory. In addition, it sets the ticket to Cleared severity or status (the icon is displayed in green) and automatically changes the acknowledged status of the ticket to true. For more information, see Cleared Ticket.
Note
Save Notes—Saves the notes for the selected ticket.
Note
Viewing a Detailed Report for the Affected Pair
Cisco ANA NetworkVision enables you to view a detailed report for every affected pair. The detailed report includes a list of the events that contributed to the affected pair.
To open a detailed report:
Step 1
Step 2
Step 3
Step 4
Step 5
The following fields are displayed at the top of the Affected Parties Destination Properties dialog box:
•
•
–
–
•
•
Each row in the Instances table represents an event that was reported for the affected pair. The following columns are displayed in the Instances table of the Affected Parties Destination Properties dialog box:
•
•
•
•
•
•
•
Step 6
to close the Affected Parties Destination Properties dialog box. The Ticket Properties dialog box is displayed.
Acknowledging a Ticket
When an alarm occurs, a warning or ticket is displayed in the ticket pane. Cisco ANA NetworkVision enables you to handle the status of a ticket by acknowledging it. This acknowledges the fault.
The change is reported to the Cisco ANA Gateway and all open Cisco ANA NetworkVision applications. Several tickets can be acknowledged at the same time. For more information, see Ticket Status in the Ticket Pane.
Note
An acknowledged ticket will change back to not acknowledged when a new event is correlated to it. You cannot undo this operation. To acknowledge a ticket:
Step 1
Step 2
or
Click Acknowledge in the Ticket Properties dialog box.
The ticket is handled as described above.
Clearing a Ticket
When an alarm occurs a warning or ticket is displayed in the ticket pane. Cisco ANA NetworkVision enables you to handle the reported ticket by verifying the report of what is faulty and clearing the faulty network element. The change is reported to the Cisco ANA Gateway and all open Cisco ANA NetworkVision applications. This operation cannot be reversed.
Clearing an open ticket performs the following operations:
•
•
•
Note
To clear a ticket:
Step 1
Step 2
or
Click Clear in the Ticket Properties dialog box.
The ticket is handled as described above.
For more information, see Ticket Status in the Ticket Pane.
Removing a Ticket
When an alarm occurs a warning or ticket is displayed in the ticket pane. Cisco ANA NetworkVision enables you to completely remove the ticket and all its active alarms and business tags. The change is reported to the Cisco ANA Gateway and all open Cisco ANA NetworkVision applications. In addition, several tickets can be removed at the same time. When a ticket has been cleared or when an `Up Alarm' occurs then the ticket can be removed. This operation cannot be reversed. A ticket that has been removed can only be viewed using Cisco ANA EventVision.
Removing an alarm performs the following operations:
•
•
•
•
Note
To remove a ticket:
Step 1
Step 2
The ticket is handled as described above.
For more information, see Ticket Status in the Ticket Pane.
In addition, an uncleared ticket (which has a severity higher than Cleared or Normal) can be cleared and removed by right-clicking in the ticket pane and selecting Clear and Remove. For more information about the Ticket shortcut menu, see Ticket Shortcut Menu.
Ticket Status in the Ticket Pane
The appearance of a ticket displayed in the ticket pane depends on the status or severity of the (ticket) alarm and what affect manipulating the ticket has on the way in which the ticket is displayed in the ticket pane.
Tickets detailed in the ticket pane change when a:
•
•
•
•
•
•
•
Generated Ticket
An example of the appearance of the ticket pane when a ticket is generated is displayed.
Table 8-1 Generated Ticket
Major
27
Port down
False (Not Acknowledged)
Cleared Ticket
An example of the appearance of the ticket pane when a ticket is cleared is displayed.
Table 8-2 Cleared Ticket
Normal
27
Cleared due to Force Clear
True (Acknowledged)
A ticket that has been cleared can then be removed from the ticket pane. For more information, see Removing a Ticket.
When a ticket is cleared, its definition changes to acknowledged automatically in the ticket pane and its definition in the Acknowledged column is True.
Acknowledged Ticket
An example of the appearance of the ticket pane when a ticket is acknowledged is displayed below. When a ticket is acknowledged it can then be cleared and the severity changes to Normal.
Table 8-3 Acknowledged Ticket
Major
27
Port up
True
Note
Generated Up Ticket
The cause of the alarm is fixed; therefore an `Up Ticket' is automatically generated with a Normal severity. An example of the appearance of the ticket pane when an `Up Ticket' is generated is displayed.
Table 8-4 Generated Up Ticket
Normal
27
Port up
True
Clearing and Removing Tickets
Approves the reported faulty ticket and clears the faulty networking entity from Cisco ANA.