-
Cisco Active Network Abstraction Fault Management User Guide, 3.6
-
Cisco ANA 3.6 Fault Management User Guide - PDF of Entire Book
-
Fault Management Overview
-
Fault Detection and Isolation
-
Cisco ANA Event Correlation and Suppression
-
Advanced Correlation Scenarios
-
Correlation Over Unmanaged Segments
-
Event and Alarm Configuration Parameters
-
Impact Analysis
-
Supported Service Alarms
-
Supported Traps and Syslogs
-
Event and Alarm Correlation Flow
-
 Feedback
Table Of Contents
Viewing a Detailed Report For the Affected Pair
Accumulating the Affected Parties In an Alarm
Accumulating the Affected Parties In the Correlation Tree
Updating Affected Severity Over Time
Impact Analysis
This chapter describes the impact analysis functionality:
•
Impact Analysis Options—Describes automatic and proactive impact analysis.
•
•
•
•
•
Impact Analysis Options
Impact analysis is available in two modes:
•
Note
•
Note
Note
This chapter describes the automatic impact analysis. For more information about proactive impact analysis, refer to the Cisco Active Network Abstraction NetworkVision User Guide.
Impact Report Structure
The impact report contains a list of pairs of endpoints when the service between them has been affected.
Each endpoint has the following details:
•
•
Note
Affected Severities
In automatic mode, the affected parties can be marked with one of the following severities:
•
•
•
•
•
Note
Note
Impact Analysis GUI
The Impact Analysis GUI is available in Cisco ANA NetworkVision and displays the list of affected service resources which are embedded in the ticket information. This section describes this list.
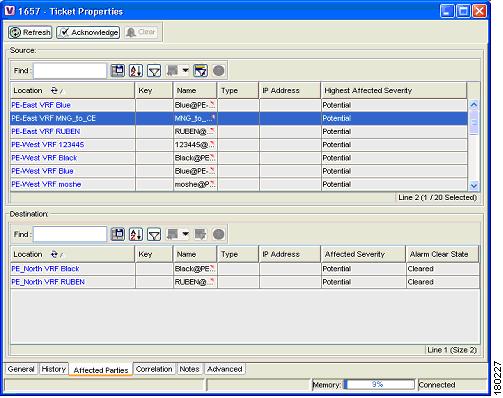
Affected Parties Tab
The Affected Parties tab displays the service resources (affected pairs) that are affected (automatic impact analysis) for an event, an alarm, or a ticket depending on which properties window is opened. In the case of an alarm or a ticket, NetworkVision automatically calculates the accumulation of affected parties of all the subsequent events. For more information about accumulating affected parties, see Viewing a Detailed Report For the Affected Pair.
The Affected Parties tab is displayed below.
Figure 7-1 Affected Parties Tab
The Affected Parties tab is divided into two areas, Source and Destination. The Source area displays the set of affected elements, A side and Z side. The following columns are displayed in the Affected Parties tab providing information about the affected parties:
•
•
•
•
•
•
–
–
–
–
When an affected side (a row) is selected in the Source area, the selected element's related affected pairs are displayed in the Destination area.
The following additional columns are displayed in the Destination area table in the Ticket Properties window:
•
•
–
–
In addition, you can view a detailed report for every affected pair that includes a list of the events that contributed to this affected pair.
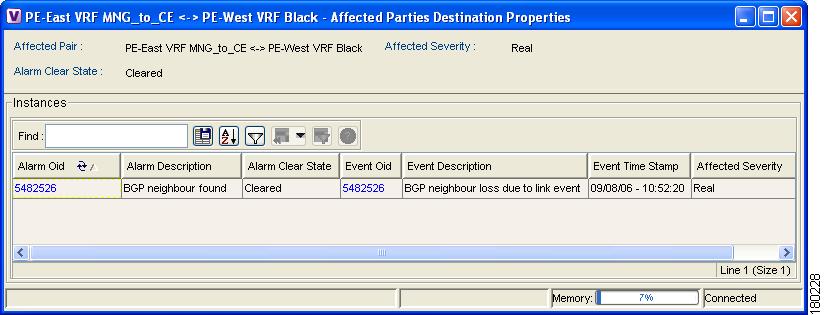
Viewing a Detailed Report For the Affected Pair
You can view a detailed report for every affected pair in NetworkVision. The detailed report includes a list of the events that contributed to the affected pair.
For information about how to reach a detailed affected report, refer to the Cisco Active Network Abstraction NetworkVision User Guide.
The Affected Parties Destination Properties dialog box is displayed.
Figure 7-2 Detailed Report For the Affected Pair
The following fields are displayed at the top of the Affected Parties Destination Properties dialog box:
•
•
–
–
•
•
Each row in the Instances table represents an event that was reported for the affected pair. The following columns are displayed in the Instances table of the Affected Parties Destination Properties dialog box:
•
•
•
•
•
•
•
Disabling Impact Analysis
You can disable impact analysis for a specific alarm. This option can be set in the Cisco ANA Registry. If impact analysis is disabled the system will report the event with no impact information. The settings can be changed dynamically during system runtime.
The following alarms can be disabled:
•
•
•
•
•
•
•
Accumulating Affected Parties
This section describes how NetworkVision automatically calculates the accumulation of affected parties during automatic impact analysis. This information is embedded in the ticket along with all the correlated faults.
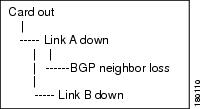
In the example below the following types of alarms exist in the correlation tree:
•
•
•
An event sequence is correlated to each of these alarms.
Figure 7-3 Correlation Tree Example
NetworkVision provides a report of the affected parties for each type of alarm. This report includes the accumulation of:
•
•
Each report includes the accumulation of the affected report of all the events in its own correlation tree.
For example, in the diagram:
•
•
Accumulating the Affected Parties In an Alarm
When there are two events that form part of the same event sequence in a specific alarm, the reoccurring affected pairs are only displayed once in the Affected Parties tab. Where there are different affected severities reported for the same pair, the pair is marked with the severity that was reported by the latest event, according to the time stamp.
Accumulating the Affected Parties In the Correlation Tree
Where there are two or more alarms that are part of the same correlation tree, that report on the same affected pair of edgepoints, and have different affected severities, then the reoccurring affected pairs are only displayed once in the Affected Parties tab. Where there are different affected severities reported for the same pair, the pair is marked with the highest severity.
In this example, X and Y are the OIDs of edgepoints in the network and there is a service running between them. Both of the alarms, link B down and BGP neighbor loss, report on the pair X<->Y as affected:
•
•
The affected severity priorities are:
•
•
•
Card out reports on X<->Y as real, affected only once.
Updating Affected Severity Over Time
Cisco ANA can update the affected severity of the same alarm report over time due because in some cases, the affect of the fault on the network cannot be determined until the network has converged.
For example, a link-down alarm creates a series of affected severity updates over time. These updates are added to the previous updates in the system database. In this case, the system provides the following reports:
•
•
•
•
This functionality is currently only available in the link-down scenario in MPLS networks.