Feedback
Table Of Contents
Viewing the Virtual Light Path
Viewing the system-event log from the Web interface
Monitoring server status
Use the links under the Monitors heading of the navigation pane to view the status of the server that you are accessing.
From the System Status pages, you can:
•
Monitor the power status of the server and view the state of the operating system
•
•
•
From the Virtual Light Path page, you can view the name, color, and status of any LEDs that are lit on a server.
From the Event Log page, you can:
•
•
From the Vital Product Data (VPD) page, you can view the vital product data.
Viewing system status
On the System Status page, you can monitor the temperature readings, voltage thresholds, and fan status of your server. You can also view the latest operating-system-failure screen, the users who are logged in to the IMM, and the system locator LED.
To view the system health and environmental information of the server, complete the following steps:
Step 1
Step 2
The status of your server determines the message that is shown at the top of the System Health Summary page. One of the following symbols is displayed:
•
•
If the monitored parameters are operating outside normal ranges, a list of the specific abnormal parameters is displayed on the System Health Summary page.
Step 3
The IMM tracks the current temperature readings and threshold levels for system components such as microprocessors, system board, and hard disk drive backplane. When you click a temperature reading, a new window opens.
The Temperature Thresholds page displays the temperature levels at which the IMM reacts. The temperature threshold values are preset on the remote server and cannot be changed.
The reported temperatures are measured against the following threshold ranges:
Non-Critical - When the temperature reaches a specified value, a temperature alert is sent to the configured remote alert recipients. You must select the Warning Alerts check box in the SNMP Alerts Settings area of the Alerts page or the Warning Alerts check box on the Remote Alert Recipient page for the alert to be sent.
For more information about selecting alert options, see the "Configuring SNMP alert settings" section on page 3-16 or the "Configuring remote alert recipients" section on page 3-14.
Critical - When the temperature reaches a specified value higher than the warning value (the soft shutdown threshold), a second temperature alert is sent to configured remote alert recipients, and the server begins the shutdown process with an orderly operating-system shutdown. The server then turns itself off. You must select the Critical Alerts check box in the SNMP Alerts Settings area of the Alerts page or the Critical Alerts check box on the Remote Alert Recipient page for the alert to be sent.
For more information about selecting alert options, see the"Configuring SNMP alert settings" section on page 3-16 or the "Configuring remote alert recipients" section on page 3-14.
Fatal - When the temperature reaches a specified value higher than the soft shutdown value (the hard shutdown threshold), the server immediately shuts down and sends an alert to configured remote alert recipients.You must select the Critical Alerts check box in the SNMP Alerts Settings area of the Alerts page or the Critical Alerts check box on the Remote Alert Recipient page for the alert to be sent.
For more information about selecting alert options, see the "Configuring SNMP alert settings" section on page 3-16 or the "Configuring remote alert recipients" section on page 3-14.
Step 4
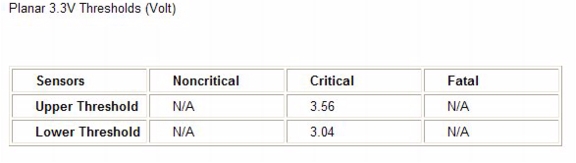
If you click a voltage reading, a new window opens.
The Voltage Thresholds page displays the voltage ranges at which the IMM reacts. The voltage threshold values are preset on the remote server and cannot be changed.
The IMM Web interface displays the voltage readings of the system board and the voltage regulator modules (VRM). The system sets a voltage range at which the following actions are taken:
Non-Critical - When the voltage drops below or exceeds a specified voltage range, a voltage alert is sent to configured remote alert recipients. You must select the Warning Alerts check box in the SNMP Alerts Settings area of the Alerts page for the alert to be sent.
For more information about selecting alert options, see the "Configuring SNMP alert settings" section on page 3-16.
Critical - When the voltage drops below or exceeds a specified voltage range, a voltage alert is sent to configured remote alert recipients, and the server begins the shutdown process with an orderly operating-system shutdown. The server then turns itself off. You must select the Critical Alerts check box in the SNMP Alerts Settings area of the Alerts page for the alert to be sent.
For more information about selecting alert options, see the"Configuring SNMP alert settings" section on page 3-16.
Fatal - When the voltage drops below or exceeds a specified voltage range, the server immediately shuts down and sends an alert to configured remote alert recipients. You must select the Fatal Alerts check box in the SNMP Alerts Settings area of the Alerts page for the alert to be sent.
Note
For more information about selecting alert options, see the "Configuring SNMP alert settings" section on page 3-16.
The IMM generates a non-critical, critical, or fatal event when the threshold is reached, and generates any shutdown actions, if they are required.
Non-critical - If the IMM indicates that this threshold has been reached, a warning event is generated.
Critical - If the IMM indicates that this threshold has been reached, a critical event is generated.
Fatal - If the IMM indicates that this threshold has been reached, a critical event is generated.
Step 5
You receive a fan alert when the fan speeds drop to an unacceptable level or when the fans stop. You must select the Critical Alerts check box in the SNMP Alerts Settings area of the Alerts page for the alert to be sent.
For more information about selecting alert options, see the "Configuring SNMP alert settings" section on page 3-16.
Note
Step 6
Step 7
Viewing the Virtual Light Path
The Virtual Light Path screen displays the name, color, and status of any LEDs that are lit on the server.
To access and view the Virtual Light Path, complete the following steps:
Step 1
Step 2
Step 3
Note
Viewing the system-event log from the Web interface
Note
To access and view the event log, complete the following steps:
Step 1
Step 2
Step 3
Informational - This severity level is assigned to an event of which you should take note.
Warning - This severity level is assigned to an event that might affect server performance.
Error - This severity level is assigned to an event that needs immediate attention.
The IMM Web interface distinguishes warning events with the letter W on a yellow background in the severity column and error events with the letter E on a red background.
Step 4
Viewing vital product data
When the server starts, the IMM collects server information, server firmware information, and server component vital product data (VPD) and stores it in nonvolatile memory. You can access this information at any time from almost any computer. The Vital Product Data page contains key information about the remote managed server that the IMM is monitoring.
To view the server component vital product data, complete the following steps:
Step 1
Step 2
Step 3
Machine level VPD
The vital product data for the server appears in this area. For viewing VPD, the machine-level VPD includes a universal unique identifier (UUID).
Note
Component Level VPD
The vital product data for the components of the remote managed server is displayed in this area.
Component Activity Log
You can view a record of component activity in this area.
IMM VPD
You can view the IMM firmware, System x server firmware, and Dynamic System Analysis firmware VPD for the remote-managed server in this area.