-
Troubleshooting Guide
-
Preface
-
Chapter 1 - Troubleshooting Overview
-
Chapter 2 - Audit Troubleshooting
-
Chapter 3 - Billing Troubleshooting
-
Chapter 4 - Call Processing Troubleshooting
-
Chapter 5 - Configuration Troubleshooting
-
Chapter 6 - Database Troubleshooting
-
Chapter 7 - Maintenance Troubleshooting
-
Chapter 8 - Operations Support System Troubleshooting
-
Chapter 9 - Security Troubleshooting
-
Chapter 10 - Signaling Troubleshooting
-
Chapter 11 - Statistics Troubleshooting
-
Chapter 12 - System Troubleshooting
-
Chapter 13 - Network Troubleshooting
-
Chapter 14 - General Troubleshooting
-
Chapter 15 - Diagnostic Tests
-
Chapter 16 - Disaster Recovery Procedures
-
Chapter 17 - Disk Replacement
-
Appendix A - Recoverable and Nonrecoverable Error Codes
-
Appendix B - System Usage of MGW Keepalive Parameters
-
Glossary
-
 Feedback
Table Of Contents
Report Threshold Exceeded - Maintenance (2)
Local Side has Become Faulty - Maintenance (3)
Mate Side has Become Faulty - Maintenance (4)
Changeover Failure - Maintenance (5)
Changeover Timeout - Maintenance (6)
Mate Rejected Changeover - Maintenance (7)
Mate Changeover Timeout - Maintenance (8)
Local Initialization Failure - Maintenance (9)
Local Initialization Timeout - Maintenance (10)
Switchover Complete - Maintenance (11)
Initialization Successful - Maintenance (12)
Administrative State Change - Maintenance (13)
Call Agent Administrative State Change - Maintenance (14)
Feature Server Administrative State Change - Maintenance (15)
Process Manager: Starting Process - Maintenance (16)
Invalid Event Report Received - Maintenance (17)
Process Manager: Process has Died - Maintenance (18)
Process Manager: Process Exceeded Restart Rate - Maintenance (19)
Lost Connection to Mate - Maintenance (20)
Network Interface Down - Maintenance (21)
Mate is Alive - Maintenance (22)
Process Manager: Process Failed to Complete Initialization - Maintenance (23)
Process Manager: Restarting Process - Maintenance (24)
Process Manager: Changing State - Maintenance (25)
Process Manager: Going Faulty - Maintenance (26)
Process Manager: Changing Over to Active - Maintenance (27)
Process Manager: Changing Over to Standby - Maintenance (28)
Administrative State Change Failure - Maintenance (29)
Element Manager State Change - Maintenance (30)
Process Manager: Sending Go Active to Process - Maintenance (32)
Process Manager: Sending Go Standby to Process - Maintenance (33)
Process Manager: Sending End Process to Process - Maintenance (34)
Process Manager: All Processes Completed Initialization - Maintenance (35)
Process Manager: Sending All Processes Initialization Complete to Process - Maintenance (36)
Process Manager: Killing Process - Maintenance (37)
Process Manager: Clearing the Database - Maintenance (38)
Process Manager: Cleared the Database - Maintenance (39)
Process Manager: Binary Does not Exist for Process - Maintenance (40)
Administrative State Change Successful with Warning - Maintenance (41)
Number of Heartbeat Messages Received is Less Than 50% of Expected - Maintenance (42)
Process Manager: Process Failed to Come Up in Active Mode - Maintenance (43)
Process Manager: Process Failed to Come Up in Standby Mode - Maintenance (44)
Application Instance State Change Failure - Maintenance (45)
Network Interface Restored - Maintenance (46)
Thread Watchdog Counter Expired for a Thread - Maintenance (47)
Index Table Usage Exceeded Minor Usage Threshold Level - Maintenance (48)
Index Table Usage Exceeded Major Usage Threshold Level - Maintenance (49)
Index Table Usage Exceeded Critical Usage Threshold Level - Maintenance (50)
A Process Exceeds 70% of Central Processing Unit Usage - Maintenance (51)
Central Processing Unit Usage is Now Below the 50% Level - Maintenance (52)
The Central Processing Unit Usage is Over 90% Busy - Maintenance (53)
The Central Processing Unit has Returned to Normal Levels of Operation - Maintenance (54)
The Five Minute Load Average is Abnormally High - Maintenance (55)
The Load Average has Returned to Normal Levels - Maintenance (56)
Memory and Swap are Consumed at Critical Levels - Maintenance (57)
Memory and Swap are Consumed at Abnormal Levels - Maintenance (58)
No Heartbeat Messages Received Through the Interface - Maintenance (61)
Link Monitor: Interface Lost Communication - Maintenance (62)
Outgoing Heartbeat Period Exceeded Limit - Maintenance (63)
Average Outgoing Heartbeat Period Exceeds Major Alarm Limit - Maintenance (64)
Disk Partition Critically Consumed - Maintenance (65)
Disk Partition Significantly Consumed - Maintenance (66)
The Free Inter-Process Communication Pool Buffers Below Minor Threshold - Maintenance (67)
The Free Inter-Process Communication Pool Buffers Below Major Threshold - Maintenance (68)
The Free Inter-Process Communication Pool Buffers Below Critical Threshold - Maintenance (69)
The Free Inter-Process Communication Pool Buffer Count Below Minimum Required - Maintenance (70)
Local Domain Name System Server Response Too Slow - Maintenance (71)
External Domain Name System Server Response Too Slow - Maintenance (72)
External Domain Name System Server not Responsive - Maintenance (73)
Local Domain Name System Service not Responsive - Maintenance (74)
Mismatch of Internet Protocol Address Local Server and Domain Name System - Maintenance (75)
Mate Time Differs Beyond Tolerance - Maintenance (77)
Bulk Data Management System Admin State Change - Maintenance (78)
Resource Reset - Maintenance (79)
Resource Reset Warning - Maintenance (80)
Resource Reset Failure - Maintenance (81)
Average Outgoing Heartbeat Period Exceeds Critical Limit - Maintenance (82)
Swap Space Below Minor Threshold - Maintenance (83)
Swap Space Below Major Threshold - Maintenance (84)
Swap Space Below Critical Threshold - Maintenance (85)
System Health Report Collection Error - Maintenance (86)
Status Update Process Request Failed - Maintenance (87)
Status Update Process Database List Retrieval Error - Maintenance (88)
Status Update Process Database Update Error - Maintenance (89)
Disk Partition Moderately Consumed - Maintenance (90)
Internet Protocol Manager Configuration File Error - Maintenance (91)
Internet Protocol Manager Initialization Error - Maintenance (92)
Internet Protocol Manager Interface Failure - Maintenance (93)
Internet Protocol Manager Interface State Change - Maintenance (94)
Internet Protocol Manager Interface Created - Maintenance (95)
Internet Protocol Manager Interface Removed - Maintenance (96)
Inter-Process Communication Input Queue Entered Throttle State - Maintenance (97)
Inter-Process Communication Input Queue Depth at 25% of its Hi-Watermark - Maintenance (98)
Inter-Process Communication Input Queue Depth at 50% of its Hi-Watermark - Maintenance (99)
Inter-Process Communication Input Queue Depth at 75% of its Hi-Watermark - Maintenance (100)
Switchover in Progress - Maintenance (101)
Thread Watchdog Counter Close to Expiry for a Thread - Maintenance (102)
Central Processing Unit is Offline - Maintenance (103)
Aggregration Device Address Successfully Resolved - Maintenance (104)
Unprovisioned Aggregration Device Detected - Maintenance (105)
Aggregration Device Address Resolution Failure - Maintenance (106)
No Heartbeat Messages Received Through Interface From Router - Maintenance (107)
A Log File Cannot be Transferred - Maintenance (108)
Five Successive Log Files Cannot be Transferred - Maintenance (109)
Access to Log Archive Facility Configuration File Failed or File Corrupted - Maintenance (110)
Cannot Login to External Archive Server - Maintenance (111)
Periodic Shared Memory Database Backup Failure - Maintenance (119)
Periodic Shared Memory Database Backup Success - Maintenance (120)
Northbound Provisioning Message is Retransmitted - Maintenance (122)
Northbound Provisioning Message Dropped Due To Full Index Table - Maintenance (123)
Troubleshooting Maintenance Alarms
Local Side has Become Faulty - Maintenance (3)
Mate Side has Become Faulty - Maintenance (4)
Changeover Failure - Maintenance (5)
Changeover Timeout - Maintenance (6)
Mate Rejected Changeover - Maintenance (7)
Mate Changeover Timeout - Maintenance (8)
Local Initialization Failure - Maintenance (9)
Local Initialization Timeout - Maintenance (10)
Process Manager: Process has Died - Maintenance (18)
Process Manager: Process Exceeded Restart Rate - Maintenance (19)
Lost Connection to Mate - Maintenance (20)
Network Interface Down - Maintenance (21)
Process Manager: Process Failed to Complete Initialization - Maintenance (23)
Process Manager: Restarting Process - Maintenance (24)
Process Manager: Going Faulty - Maintenance (26)
Process Manager: Binary Does not Exist for Process - Maintenance (40)
Number of Heartbeat Messages Received is Less Than 50% of Expected - Maintenance (42)
Process Manager: Process Failed to Come Up in Active Mode - Maintenance (43)
Process Manager: Process Failed to Come Up in Standby Mode - Maintenance (44)
Application Instance State Change Failure - Maintenance (45)
Thread Watchdog Counter Expired for a Thread - Maintenance (47)
Index Table Usage Exceeded Minor Usage Threshold Level - Maintenance (48)
Index Table Usage Exceeded Major Usage Threshold Level - Maintenance (49)
Index Table Usage Exceeded Critical Usage Threshold Level - Maintenance (50)
A Process Exceeds 70% of Central Processing Unit Usage - Maintenance (51)
The Central Processing Unit Usage is Over 90% Busy - Maintenance (53)
The Five Minute Load Average is Abnormally High - Maintenance (55)
Memory and Swap are Consumed at Critical Levels - Maintenance (57)
No Heartbeat Messages Received Through the Interface - Maintenance (61)
Link Monitor: Interface Lost Communication - Maintenance (62)
Outgoing Heartbeat Period Exceeded Limit - Maintenance (63)
Average Outgoing Heartbeat Period Exceeds Major Alarm Limit - Maintenance (64)
Disk Partition Critically Consumed - Maintenance (65)
Disk Partition Significantly Consumed - Maintenance (66)
The Free Inter-Process Communication Pool Buffers Below Minor Threshold - Maintenance (67)
The Free Inter-Process Communication Pool Buffers Below Major Threshold - Maintenance (68)
The Free Inter-Process Communication Pool Buffers Below Critical Threshold - Maintenance (69)
The Free Inter-Process Communication Pool Buffer Count Below Minimum Required - Maintenance (70)
Local Domain Name System Server Response Too Slow - Maintenance (71)
External Domain Name System Server Response Too Slow - Maintenance (72)
External Domain Name System Server not Responsive - Maintenance (73)
Local Domain Name System Service not Responsive - Maintenance (74)
Mate Time Differs Beyond Tolerance - Maintenance (77)
Average Outgoing Heartbeat Period Exceeds Critical Limit - Maintenance (82)
Swap Space Below Minor Threshold - Maintenance (83)
Swap Space Below Major Threshold - Maintenance (84)
Swap Space Below Critical Threshold - Maintenance (85)
System Health Report Collection Error - Maintenance (86)
Status Update Process Request Failed - Maintenance (87)
Status Update Process Database List Retrieval Error - Maintenance (88)
Status Update Process Database Update Error - Maintenance (89)
Disk Partition Moderately Consumed - Maintenance (90)
Internet Protocol Manager Configuration File Error - Maintenance (91)
Internet Protocol Manager Initialization Error - Maintenance (92)
Internet Protocol Manager Interface Failure - Maintenance (93)
Inter-Process Communication Input Queue Entered Throttle State - Maintenance (97)
Inter-Process Communication Input Queue Depth at 25% of Its Hi-Watermark - Maintenance (98)
Inter-Process Communication Input Queue Depth at 50% of Its Hi-Watermark - Maintenance (99)
Inter-Process Communication Input Queue Depth at 75% of Its Hi-Watermark - Maintenance (100)
Switchover in Progress - Maintenance (101)
Thread Watchdog Counter Close to Expiry for a Thread - Maintenance (102)
Central Processing Unit is Offline - Maintenance (103)
No Heartbeat Messages Received Through Interface From Router - Maintenance (107)
Five Successive Log Files Cannot be Transferred - Maintenance (109)
Access to Log Archive Facility Configuration File Failed or File Corrupted - Maintenance (110)
Cannot Login to External Archive Server - Maintenance (111)
Periodic Shared Memory Database Backup Failure - Maintenance (119)
Maintenance Troubleshooting
Revised: July 22, 2009, OL-8000-32Introduction
This chapter provides the information needed to monitor and troubleshoot Maintenance events and alarms. This chapter is divided into the following sections:
•
Maintenance Events and Alarms - Provides a brief overview of each Maintenance event and alarm.
•
•
Maintenance Events and Alarms
This section provides a brief overview of the Maintenance events and alarms for the Cisco BTS 10200 Softswitch in numerical order. Table 7-1 lists all maintenance events and alarms by severity.
Note
MAINTENANCE (1)
For additional information, refer to the "Test Report - Maintenance (1)" section.
MAINTENANCE (2)
For additional information, refer to the "Report Threshold Exceeded - Maintenance (2)" section.
MAINTENANCE (3)
To troubleshoot and correct the cause of the alarm, refer to the "Local Side has Become Faulty - Maintenance (3)" section.
MAINTENANCE (4)
To troubleshoot and correct the cause of the alarm, refer to the "Mate Side has Become Faulty - Maintenance (4)" section.
Refer to the "Obtaining Documentation and Submitting a Service Request" section on page liii for detailed instructions on contacting Cisco TAC and opening a service request.
MAINTENANCE (5)
To troubleshoot and correct the cause of the alarm, refer to the "Changeover Failure - Maintenance (5)" section.
Refer to the "Obtaining Documentation and Submitting a Service Request" section on page liii for detailed instructions on contacting Cisco TAC and opening a service request.
MAINTENANCE (6)
To troubleshoot and correct the cause of the alarm, refer to the "Changeover Timeout - Maintenance (6)" section.
Refer to the "Obtaining Documentation and Submitting a Service Request" section on page liii for detailed instructions on contacting Cisco TAC and opening a service request.
MAINTENANCE (7)
To troubleshoot and correct the cause of the alarm, refer to the "Mate Rejected Changeover - Maintenance (7)" section.
Refer to the "Obtaining Documentation and Submitting a Service Request" section on page liii for detailed instructions on contacting Cisco TAC and opening a service request.
MAINTENANCE (8)
To troubleshoot and correct the cause of the alarm, refer to the "Mate Changeover Timeout - Maintenance (8)" section.
Refer to the "Obtaining Documentation and Submitting a Service Request" section on page liii for detailed instructions on contacting Cisco TAC and opening a service request.
MAINTENANCE (9)
To troubleshoot and correct the cause of the alarm, refer to the "Local Initialization Failure - Maintenance (9)" section.
MAINTENANCE (10)
To troubleshoot and correct the cause of the alarm, refer to the "Local Initialization Timeout - Maintenance (10)" section.
MAINTENANCE (11)
For additional information, refer to the "Switchover Complete - Maintenance (11)" section.
MAINTENANCE (12)
For additional information, refer to the "Initialization Successful - Maintenance (12)" section.
MAINTENANCE (13)
For additional information, refer to the "Administrative State Change - Maintenance (13)" section.
MAINTENANCE (14)
For additional information, refer to the "Call Agent Administrative State Change - Maintenance (14)" section.
MAINTENANCE (15)
For additional information, refer to the "Feature Server Administrative State Change - Maintenance (15)" section.
MAINTENANCE (16)
For additional information, refer to the "Process Manager: Starting Process - Maintenance (16)" section.
MAINTENANCE (17)
For additional information, refer to the "Invalid Event Report Received - Maintenance (17)" section.
Refer to the "Obtaining Documentation and Submitting a Service Request" section on page liii for detailed instructions on contacting Cisco TAC and opening a service request.
MAINTENANCE (18)
To troubleshoot and correct the cause of the alarm, refer to the "Process Manager: Process has Died - Maintenance (18)" section.
Refer to the "Obtaining Documentation and Submitting a Service Request" section on page liii for detailed instructions on contacting Cisco TAC and opening a service request.
MAINTENANCE (19)
To troubleshoot and correct the cause of the alarm, refer to the "Process Manager: Process Exceeded Restart Rate - Maintenance (19)" section.
MAINTENANCE (20)
To troubleshoot and correct the cause of the alarm, refer to the "Lost Connection to Mate - Maintenance (20)" section.
MAINTENANCE (21)
To troubleshoot and correct the cause of the alarm, refer to the "Network Interface Down - Maintenance (21)" section.
MAINTENANCE (22)
For additional information, refer to the "Mate is Alive - Maintenance (22)" section.
DESCRIPTION
Mate is Alive
SEVERITY
INFO
THRESHOLD
100
THROTTLE
0
DATAWORDS
Local State - STRING [30]
Mate State - STRING [30]
MAINTENANCE (23)
To troubleshoot and correct the cause of the alarm, refer to the "Process Manager: Process Failed to Complete Initialization - Maintenance (23)" section.
MAINTENANCE (24)
To troubleshoot and correct the cause of the alarm, refer to the "Process Manager: Restarting Process - Maintenance (24)" section.
Refer to the "Obtaining Documentation and Submitting a Service Request" section on page liii for detailed instructions on contacting Cisco TAC and opening a service request.
MAINTENANCE (25)
For additional information, refer to the "Process Manager: Changing State - Maintenance (25)" section.
DESCRIPTION
Process Manager: Changing State
SEVERITY
INFO
THRESHOLD
100
THROTTLE
0
DATAWORDS
Platform State - STRING [40]
MAINTENANCE (26)
To troubleshoot and correct the cause of the alarm, refer to the "Process Manager: Going Faulty - Maintenance (26)" section.
MAINTENANCE (27)
For additional information, refer to the "Process Manager: Changing Over to Active - Maintenance (27)" section.
MAINTENANCE (28)
For additional information, refer to the "Process Manager: Changing Over to Standby - Maintenance (28)" section.
MAINTENANCE (29)
To monitor and correct the cause of the event, refer to the "Administrative State Change Failure - Maintenance (29)" section.
MAINTENANCE (30)
For additional information, refer to the "Element Manager State Change - Maintenance (30)" section.
Note
MAINTENANCE (32)
For additional information, refer to the "Process Manager: Sending Go Active to Process - Maintenance (32)" section.
MAINTENANCE (33)
For additional information, refer to the "Process Manager: Sending Go Standby to Process - Maintenance (33)" section.
MAINTENANCE (34)
For additional information, refer to the "Process Manager: Sending End Process to Process - Maintenance (34)" section.
MAINTENANCE (35)
For additional information, refer to the "Process Manager: All Processes Completed Initialization - Maintenance (35)" section.
MAINTENANCE (36)
For additional information, refer to the "Process Manager: Sending All Processes Initialization Complete to Process - Maintenance (36)" section.
MAINTENANCE (37)
For additional information, refer to the "Process Manager: Killing Process - Maintenance (37)" section.
MAINTENANCE (38)
For additional information, refer to the "Process Manager: Clearing the Database - Maintenance (38)" section.
MAINTENANCE (39)
For additional information, refer to the "Process Manager: Cleared the Database - Maintenance (39)" section.
MAINTENANCE (40)
To troubleshoot and correct the cause of the alarm, refer to the "Process Manager: Binary Does not Exist for Process - Maintenance (40)" section.
MAINTENANCE (41)
To monitor and correct the cause of the event, refer to the "Administrative State Change Successful with Warning - Maintenance (41)" section.
MAINTENANCE (42)
To troubleshoot and correct the cause of the alarm, refer to the "Number of Heartbeat Messages Received is Less Than 50% of Expected - Maintenance (42)" section.
MAINTENANCE (43)
To troubleshoot and correct the cause of the alarm, refer to the "Process Manager: Process Failed to Come Up in Active Mode - Maintenance (43)" section.
Refer to the "Obtaining Documentation and Submitting a Service Request" section on page liii for detailed instructions on contacting Cisco TAC and opening a service request.
MAINTENANCE (44)
To troubleshoot and correct the cause of the alarm, refer to the "Process Manager: Process Failed to Come Up in Standby Mode - Maintenance (44)" section.
Refer to the "Obtaining Documentation and Submitting a Service Request" section on page liii for detailed instructions on contacting Cisco TAC and opening a service request.
MAINTENANCE (45)
To troubleshoot and correct the cause of the alarm, refer to the "Application Instance State Change Failure - Maintenance (45)" section.
Refer to the "Obtaining Documentation and Submitting a Service Request" section on page liii for detailed instructions on contacting Cisco TAC and opening a service request.
MAINTENANCE (46)
For additional information, refer to the "Network Interface Restored - Maintenance (46)" section.
MAINTENANCE (47)
To troubleshoot and correct the cause of the alarm, refer to the "Thread Watchdog Counter Expired for a Thread - Maintenance (47)" section.
MAINTENANCE (48)
To troubleshoot and correct the cause of the alarm, refer to the "Index Table Usage Exceeded Minor Usage Threshold Level - Maintenance (48)" section.
Refer to the "Obtaining Documentation and Submitting a Service Request" section on page liii for detailed instructions on contacting Cisco TAC and opening a service request.
MAINTENANCE (49)
To troubleshoot and correct the cause of the alarm, refer to the "Index Table Usage Exceeded Major Usage Threshold Level - Maintenance (49)" section.
Refer to the "Obtaining Documentation and Submitting a Service Request" section on page liii for detailed instructions on contacting Cisco TAC and opening a service request.
MAINTENANCE (50)
To troubleshoot and correct the cause of the alarm, refer to the "Index Table Usage Exceeded Critical Usage Threshold Level - Maintenance (50)" section.
MAINTENANCE (51)
To troubleshoot and correct the cause of the alarm, refer to the "A Process Exceeds 70% of Central Processing Unit Usage - Maintenance (51)" section.
MAINTENANCE (52)
For additional information, refer to the "Central Processing Unit Usage is Now Below the 50% Level - Maintenance (52)" section.
MAINTENANCE (53)
To troubleshoot and correct the cause of the alarm, refer to the "The Central Processing Unit Usage is Over 90% Busy - Maintenance (53)" section.
Refer to the "Obtaining Documentation and Submitting a Service Request" section on page liii for detailed instructions on contacting Cisco TAC and opening a service request.
MAINTENANCE (54)
For additional information, refer to the "The Central Processing Unit has Returned to Normal Levels of Operation - Maintenance (54)" section.
MAINTENANCE (55)
To troubleshoot and correct the cause of the alarm, refer to the "The Five Minute Load Average is Abnormally High - Maintenance (55)" section.
Refer to the "Obtaining Documentation and Submitting a Service Request" section on page liii for detailed instructions on contacting Cisco TAC and opening a service request.
MAINTENANCE (56)
For additional information, refer to the "The Load Average has Returned to Normal Levels - Maintenance (56)" section.
DESCRIPTION
The Load Average has Returned to Normal Levels
SEVERITY
INFO
THRESHOLD
100
THROTTLE
0
DATAWORDS
Host Name - STRING [40]
Load Average - STRING [40]PRIMARY
CAUSEN/A
PRIMARY
ACTIONN/A
MAINTENANCE (57)
To troubleshoot and correct the cause of the alarm, refer to the "Memory and Swap are Consumed at Critical Levels - Maintenance (57)" section.
Note
Refer to the "Obtaining Documentation and Submitting a Service Request" section on page liii for detailed instructions on contacting Cisco TAC and opening a service request.
MAINTENANCE (58)
For additional information, refer to the "Memory and Swap are Consumed at Abnormal Levels - Maintenance (58)" section.
Note
Refer to the "Obtaining Documentation and Submitting a Service Request" section on page liii for detailed instructions on contacting Cisco TAC and opening a service request.
Note
MAINTENANCE (61)
To troubleshoot and correct the cause of the alarm, refer to the "No Heartbeat Messages Received Through the Interface - Maintenance (61)" section.
MAINTENANCE (62)
To troubleshoot and correct the cause of the alarm, refer to the "Link Monitor: Interface Lost Communication - Maintenance (62)" section.
MAINTENANCE (63)
To troubleshoot and correct the cause of the alarm, refer to the "Outgoing Heartbeat Period Exceeded Limit - Maintenance (63)" section.
Refer to the "Obtaining Documentation and Submitting a Service Request" section on page liii for detailed instructions on contacting Cisco TAC and opening a service request.
MAINTENANCE (64)
To troubleshoot and correct the cause of the alarm, refer to the "Average Outgoing Heartbeat Period Exceeds Major Alarm Limit - Maintenance (64)" section.
Refer to the "Obtaining Documentation and Submitting a Service Request" section on page liii for detailed instructions on contacting Cisco TAC and opening a service request.
MAINTENANCE (65)
To troubleshoot and correct the cause of the alarm, refer to the "Disk Partition Critically Consumed - Maintenance (65)" section.
MAINTENANCE (66)
To troubleshoot and correct the cause of the alarm, refer to the "Disk Partition Significantly Consumed - Maintenance (66)" section.
MAINTENANCE (67)
To troubleshoot and correct the cause of the alarm, refer to the "The Free Inter-Process Communication Pool Buffers Below Minor Threshold - Maintenance (67)" section.
MAINTENANCE (68)
To troubleshoot and correct the cause of the alarm, refer to the "The Free Inter-Process Communication Pool Buffers Below Major Threshold - Maintenance (68)" section.
Refer to the "Obtaining Documentation and Submitting a Service Request" section on page liii for detailed instructions on contacting Cisco TAC and opening a service request.
MAINTENANCE (69)
To troubleshoot and correct the cause of the alarm, refer to the "The Free Inter-Process Communication Pool Buffers Below Critical Threshold - Maintenance (69)" section.
Refer to the "Obtaining Documentation and Submitting a Service Request" section on page liii for detailed instructions on contacting Cisco TAC and opening a service request.
MAINTENANCE (70)
To troubleshoot and correct the cause of the alarm, refer to the "The Free Inter-Process Communication Pool Buffer Count Below Minimum Required - Maintenance (70)" section.
Refer to the "Obtaining Documentation and Submitting a Service Request" section on page liii for detailed instructions on contacting Cisco TAC and opening a service request.
MAINTENANCE (71)
To troubleshoot and correct the cause of the alarm, refer to the "Local Domain Name System Server Response Too Slow - Maintenance (71)" section.
MAINTENANCE (72)
To troubleshoot and correct the cause of the alarm, refer to the "External Domain Name System Server Response Too Slow - Maintenance (72)" section.
MAINTENANCE (73)
To troubleshoot and correct the cause of the alarm, refer to the "External Domain Name System Server not Responsive - Maintenance (73)" section.
MAINTENANCE (74)
To troubleshoot and correct the cause of the alarm, refer to the "Local Domain Name System Service not Responsive - Maintenance (74)" section.
MAINTENANCE (75)
To monitor and correct the cause of the event, refer to the "Mismatch of Internet Protocol Address Local Server and Domain Name System - Maintenance (75)" section.
Note
MAINTENANCE (77)
To troubleshoot and correct the cause of the alarm, refer to the "Mate Time Differs Beyond Tolerance - Maintenance (77)" section.
MAINTENANCE (78)
For additional information, refer to the "Bulk Data Management System Admin State Change - Maintenance (78)" section.
MAINTENANCE (79)
For additional information, refer to the "Resource Reset - Maintenance (79)" section.
MAINTENANCE (80)
For additional information, refer to the "Resource Reset Warning - Maintenance (80)" section.
MAINTENANCE (81)
For additional information, refer to the "Resource Reset Failure - Maintenance (81)" section.
MAINTENANCE (82)
To troubleshoot and correct the cause of the alarm, refer to the "Average Outgoing Heartbeat Period Exceeds Critical Limit - Maintenance (82)" section.
MAINTENANCE (83)
To troubleshoot and correct the cause of the alarm, refer to the "Swap Space Below Minor Threshold - Maintenance (83)" section.
MAINTENANCE (84)
To troubleshoot and correct the cause of the alarm, refer to the "Swap Space Below Major Threshold - Maintenance (84)" section.
MAINTENANCE (85)
To troubleshoot and correct the cause of the alarm, refer to the "Swap Space Below Critical Threshold - Maintenance (85)" section.
MAINTENANCE (86)
To troubleshoot and correct the cause of the alarm, refer to the "System Health Report Collection Error - Maintenance (86)" section.
Refer to the "Obtaining Documentation and Submitting a Service Request" section on page liii for detailed instructions on contacting Cisco TAC and opening a service request.
MAINTENANCE (87)
To troubleshoot and correct the cause of the alarm, refer to the "Status Update Process Request Failed - Maintenance (87)" section.
MAINTENANCE (88)
To troubleshoot and correct the cause of the alarm, refer to the "Status Update Process Database List Retrieval Error - Maintenance (88)" section.
Refer to the "Obtaining Documentation and Submitting a Service Request" section on page liii for detailed instructions on contacting Cisco TAC and opening a service request.
MAINTENANCE (89)
To troubleshoot and correct the cause of the alarm, refer to the "Status Update Process Database Update Error - Maintenance (89)" section.
Refer to the "Obtaining Documentation and Submitting a Service Request" section on page liii for detailed instructions on contacting Cisco TAC and opening a service request.
MAINTENANCE (90)
To troubleshoot and correct the cause of the alarm, refer to the "Disk Partition Moderately Consumed - Maintenance (90)" section.
MAINTENANCE (91)
To troubleshoot and correct the cause of the alarm, refer to the "Internet Protocol Manager Configuration File Error - Maintenance (91)" section.
MAINTENANCE (92)
To troubleshoot and correct the cause of the alarm, refer to the "Internet Protocol Manager Initialization Error - Maintenance (92)" section.
MAINTENANCE (93)
To troubleshoot and correct the cause of the alarm, refer to the "Internet Protocol Manager Interface Failure - Maintenance (93)" section.
MAINTENANCE (94)
For additional information, refer to the "Internet Protocol Manager Interface State Change - Maintenance (94)" section.
MAINTENANCE (95)
For additional information, refer to the "Internet Protocol Manager Interface Created - Maintenance (95)" section.
MAINTENANCE (96)
For additional information, refer to the "Internet Protocol Manager Interface Removed - Maintenance (96)" section.
MAINTENANCE (97)
To troubleshoot and correct the cause of the alarm, refer to the "Inter-Process Communication Input Queue Entered Throttle State - Maintenance (97)" section.
Refer to the "Obtaining Documentation and Submitting a Service Request" section on page liii for detailed instructions on contacting Cisco TAC and opening a service request.
MAINTENANCE (98)
To troubleshoot and correct the cause of the alarm, refer to the "Inter-Process Communication Input Queue Depth at 25% of Its Hi-Watermark - Maintenance (98)" section.
Refer to the "Obtaining Documentation and Submitting a Service Request" section on page liii for detailed instructions on contacting Cisco TAC and opening a service request.
MAINTENANCE (99)
To troubleshoot and correct the cause of the alarm, refer to the "Inter-Process Communication Input Queue Depth at 50% of Its Hi-Watermark - Maintenance (99)" section.
Refer to the "Obtaining Documentation and Submitting a Service Request" section on page liii for detailed instructions on contacting Cisco TAC and opening a service request.
MAINTENANCE (100)
To troubleshoot and correct the cause of the alarm, refer to the "Inter-Process Communication Input Queue Depth at 75% of Its Hi-Watermark - Maintenance (100)" section.
Refer to the "Obtaining Documentation and Submitting a Service Request" section on page liii for detailed instructions on contacting Cisco TAC and opening a service request.
MAINTENANCE (101)
To troubleshoot and correct the cause of the alarm, refer to the "Switchover in Progress - Maintenance (101)" section.
MAINTENANCE (102)
To troubleshoot and correct the cause of the alarm, refer to the "Thread Watchdog Counter Close to Expiry for a Thread - Maintenance (102)" section.
MAINTENANCE (103)
To troubleshoot and correct the cause of the alarm, refer to the "Central Processing Unit is Offline - Maintenance (103)" section.
Refer to the "Obtaining Documentation and Submitting a Service Request" section on page liii for detailed instructions on contacting Cisco TAC and opening a service request.
MAINTENANCE (104)
For additional information, refer to the "Aggregration Device Address Successfully Resolved - Maintenance (104)" section.
MAINTENANCE (105)
To monitor and correct the cause of the event, refer to the "Unprovisioned Aggregration Device Detected - Maintenance (105)" section.
MAINTENANCE (106)
To monitor and correct the cause of the event, refer to the"Aggregration Device Address Resolution Failure - Maintenance (106)" section.
MAINTENANCE (107)
To troubleshoot and correct the cause of the alarm, refer to the "No Heartbeat Messages Received Through Interface From Router - Maintenance (107)" section.
MAINTENANCE (108)
To monitor and correct the cause of the event, refer to the "A Log File Cannot be Transferred - Maintenance (108)" section.
MAINTENANCE (109)
To troubleshoot and correct the cause of the alarm, refer to the "Five Successive Log Files Cannot be Transferred - Maintenance (109)" section.
MAINTENANCE (110)
To troubleshoot and correct the cause of the alarm, refer to the "Access to Log Archive Facility Configuration File Failed or File Corrupted - Maintenance (110)" section.
MAINTENANCE (111)
To troubleshoot and correct the cause of the alarm, refer to the "Cannot Login to External Archive Server - Maintenance (111)" section.
Note
MAINTENANCE (118)
To troubleshoot and correct the cause of the alarm, refer to the "Domain Name Server Zone Database does not Match Between the Primary Domain Name Server and the Internal Secondary Authoritative Domain Name Server - Maintenance (118)" section.
MAINTENANCE (119)
To troubleshoot and correct the cause of the alarm, refer to the "Periodic Shared Memory Database Backup Failure - Maintenance (119)" section.
MAINTENANCE (120)
For additional information, refer to the "Periodic Shared Memory Database Backup Success - Maintenance (120)" section.
Note
MAINTENANCE (122)
For additional information, refer to the "Northbound Provisioning Message is Retransmitted - Maintenance (122)" section.
MAINTENANCE (123)
To monitor and correct the cause of the event, refer to the "Northbound Provisioning Message Dropped Due To Full Index Table - Maintenance (123)" section.
Monitoring Maintenance Events
This section provides the information needed to monitor and correct Maintenance events. Table 7-2 lists all Maintenance events in numerical order and provides cross reference to each subsection in this section.
Test Report - Maintenance (1)
The Test Report is for testing the maintenance event category. The event is informational and no further action is required.
Report Threshold Exceeded - Maintenance (2)
The Report Threshold Exceeded event functions as an informational alert that a report threshold has been exceeded. The primary cause of the event is that the threshold for a given report type and number has been exceeded. No further action is required since this is an information report. The root cause event report - threshold should be investigated to determine if there is a service affecting situation.
Local Side has Become Faulty - Maintenance (3)
The Local Side has Become Faulty alarm (major) indicates that the local side has become faulty. To troubleshoot and correct the cause of the Local Side has Become Faulty alarm, refer to the "Local Side has Become Faulty - Maintenance (3)" section.
Mate Side has Become Faulty - Maintenance (4)
The Mate Side has Become Faulty alarm (major) indicates that the mate side has become faulty. To troubleshoot and correct the cause of the Mate Side has Become Faulty alarm, refer to the "Mate Side has Become Faulty - Maintenance (4)" section.
Changeover Failure - Maintenance (5)
The Changeover Failure alarm (major) indicates that a changeover failed. To troubleshoot and correct the cause of the Changeover Failure alarm, refer to the "Changeover Failure - Maintenance (5)" section.
Changeover Timeout - Maintenance (6)
The Changeover Timeout alarm (major) indicates that a changeover timed out. To troubleshoot and correct the cause of the Changeover Timeout alarm, refer to the "Changeover Timeout - Maintenance (6)" section.
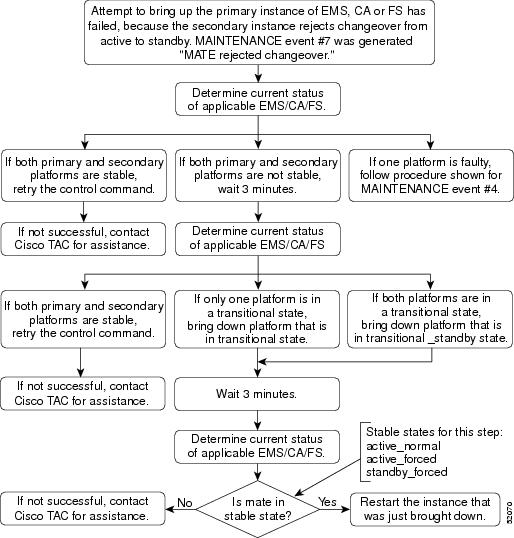
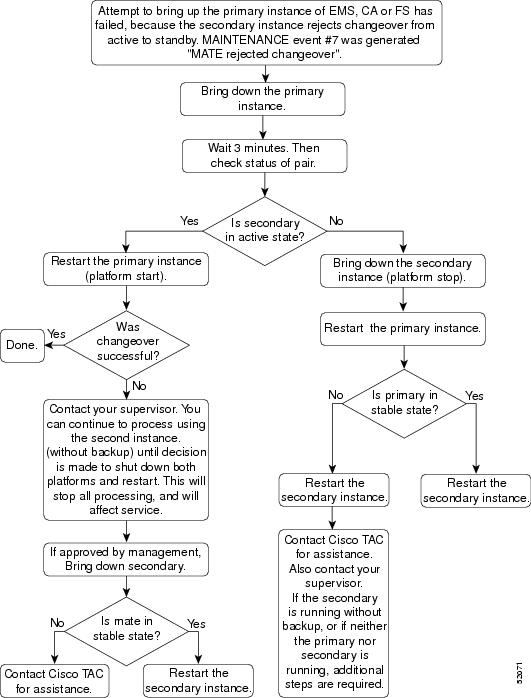
Mate Rejected Changeover - Maintenance (7)
The Mate Rejected Changeover alarm (major) indicates that the mate rejected the changeover. To troubleshoot and correct the cause of the Mate Rejected Changeover alarm, refer to the "Mate Rejected Changeover - Maintenance (7)" section.
Mate Changeover Timeout - Maintenance (8)
The Mate Changeover Timeout alarm (major) indicates that the mate changeover timed out. To troubleshoot and correct the cause of the Mate Changeover Timeout alarm, refer to the "Mate Changeover Timeout - Maintenance (8)" section.
Local Initialization Failure - Maintenance (9)
The Local Initialization Failure alarm (major) indicates that the local initialization has failed. To troubleshoot and correct the cause of the Local Initialization Failure alarm, refer to the "Local Initialization Failure - Maintenance (9)" section.
Local Initialization Timeout - Maintenance (10)
The Local Initialization Timeout alarm (major) indicates that the local initialization has timed out. To troubleshoot and correct the cause of the Local Initialization Timeout alarm, refer to the "Local Initialization Timeout - Maintenance (10)" section.
Switchover Complete - Maintenance (11)
The Switchover Complete event functions as an informational alert that the switchover has been completed. The Switchover Complete event acknowledges that the changeover successfully completed. The event is informational and no further action is required.
Initialization Successful - Maintenance (12)
The Initialization Successful event functions as an informational alert that the initialization was successful. The Initialization Successful event indicates that a local initialization has been successful. The event is informational and no further action is required.
Administrative State Change - Maintenance (13)
The Administrative State Change event functions as an informational alert that the administrative state of a managed resource has changed. No action is required, since this informational event is given after manually changing the administrative state of a managed resource.
Call Agent Administrative State Change - Maintenance (14)
The Call Agent Administrative State Change event functions as an informational alert that indicates that the call agent has changed operational state as a result of a manual switchover. The event is informational and no further action is required.
Feature Server Administrative State Change - Maintenance (15)
The Feature Server Administrative State Change event functions as an informational alert that indicates that the feature server has changed operational state as a result of a manual switchover. The event is informational and no further action is required.
Process Manager: Starting Process - Maintenance (16)
The Process Manager: Process has Died: Starting Process event functions as an information alert that indicates that a process is being started as system is being brought up. The event is informational and no further action is required.
Invalid Event Report Received - Maintenance (17)
The Invalid Event Report Received event functions as an informational alert that indicates that a process has sent an event report that cannot be found in the database. If during system initialization a short burst of these events are issued prior to the database initialization, then these events are informational and can be ignored; otherwise, contact Cisco TAC. Refer to the "Obtaining Documentation and Submitting a Service Request" section on page liii for detailed instructions on contacting Cisco TAC and opening a service request.
Process Manager: Process has Died - Maintenance (18)
The Process Manager: Process has Died alarm (minor) indicates that a process has died. To troubleshoot and correct the cause of the Process Manager: Process has Died alarm, refer to the "Process Manager: Process has Died - Maintenance (18)" section.
Process Manager: Process Exceeded Restart Rate - Maintenance (19)
The Process Manager: Process Exceeded Restart Rate alarm (major) indicates that a process has exceeded the restart rate. To troubleshoot and correct the cause of the Process Manager: Process Exceeded Restart Rate alarm, refer to the "Process Manager: Process Exceeded Restart Rate - Maintenance (19)" section.
Lost Connection to Mate - Maintenance (20)
The Lost Connection to Mate alarm (major) indicates that the keepalive module connection to the mate has been lost. To troubleshoot and correct the cause of the Lost Connection to Mate alarm, refer to the "Lost Connection to Mate - Maintenance (20)" section.
Network Interface Down - Maintenance (21)
The Network Interface Down alarm (major) indicates that the network interface has gone down. To troubleshoot and correct the cause of the Network Interface Down alarm, refer to the "Network Interface Down - Maintenance (21)" section.
Mate is Alive - Maintenance (22)
The Mate is Alive event functions as an informational alert that the mate is alive. The reporting CA/FS/EMS/BDMS is indicating that its mate has been successfully restored to service. The event is informational and no further action is required.
Process Manager: Process Failed to Complete Initialization - Maintenance (23)
The Process Manager: Process Failed to Complete Initialization alarm (major) indicates that a PMG process failed to complete initialization. To trouble and correct the cause of the Process Manager: Process Failed to Complete Initialization alarm, refer to the "Process Manager: Process Failed to Complete Initialization - Maintenance (23)" section.
Process Manager: Restarting Process - Maintenance (24)
The Process Manager: Restarting Process alarm (minor) indicates the a PMG process is being restarted. To troubleshoot and correct the cause of the Process Manager: Restarting Process alarm, refer to the "Process Manager: Restarting Process - Maintenance (24)" section.
Process Manager: Changing State - Maintenance (25)
The Process Manager: Changing State event functions as an informational alert that a PMG process is changing state. The primary cause of the event is that a side is transitioning from one state to another. This is part of the normal side state change process. Monitor the system for other maintenance category event reports to see if the transition is due to a failure of a component within the specified side.
Process Manager: Going Faulty - Maintenance (26)
The Process Manager: Going Faulty alarm (major) indicates that a PMG process is going faulty. To troubleshoot and correct the cause of the Process Manager: Going Faulty alarm, refer to the "Process Manager: Going Faulty - Maintenance (26)" section.
Process Manager: Changing Over to Active - Maintenance (27)
The Process Manager: Changing Over to Active event functions as an informational alert that a PMG process is being changed to active. The primary cause of the event is that the specified platform instance was in the standby state and was changed to the active state either by program control or via user request. No action is necessary. This is part of the normal process of activating the platform.
Process Manager: Changing Over to Standby - Maintenance (28)
The Process Manager: Changing Over to Standby event functions as an information alert that a PMG process is being changed to standby. The primary cause of the event is that the specified side was in the active state and was changed to the standby state, or is being restored to service, and its mate is already in the active state either by program control or via user request. No action is necessary. This is part of the normal process of restoring or duplexing the platform.
Administrative State Change Failure - Maintenance (29)
The Administrative State Change Failure event functions as a warning that a change of the administrative state has failed. The primary cause of the event is that an attempt to change the administrative state of a device has failed. If one is found, analyze the cause of the failure. Verify that the controlling element of the targeted device was in the ACTIVE state in order to service the request to change the ADMIN state of the device. If the controlling platform instance is not ACTIVE, restore it to service.
Element Manager State Change - Maintenance (30)
The Element Manager State Change event functions as an informational alert that the element manager has changed state. The primary cause of the event is that the specified EMS has changed to the indicated state either naturally or via user request. The event is informational and no action is necessary. This is part of the normal state transitioning process for the EMS. Monitor the system for related event reports if the transition was due to a faulty or out of service state.
Process Manager: Sending Go Active to Process - Maintenance (32)
The Process Manager: Sending Go Active to Process event functions as an informational alert that a process is being notified to switch to active state as the system is switching over from standby to active. The event is informational and no further action is required.
Process Manager: Sending Go Standby to Process - Maintenance (33)
The Process Manager: Sending Go Standby to Process event functions as an informational alert that a process is being notified to exit gracefully as the system is switching over to standby state, or is shutting down. The switchover or shutdown could be due to the operator taking the action to switch or shut down the system or due to the system has detected a fault. The event is informational and no further action is required.
Process Manager: Sending End Process to Process - Maintenance (34)
The Process Manager: Sending End Process to Process event functions as an informational alert that a process is being notified to exit gracefully as the system is switching over to standby state, or is shutting down. The switchover or shutdown could be due to the operator taking the action to switch or shut down the system or due to the system has detected a fault. The event is informational and no further action is required.
Process Manager: All Processes Completed Initialization - Maintenance (35)
The Process Manager: All Processes Completed Initialization event functions as an informational alert that the system is being brought up, and that all processes are ready to start executing. The event is informational and no further action is required.
Process Manager: Sending All Processes Initialization Complete to Process - Maintenance (36)
The Process Manager: Sending All Processes Initialization Complete to Process event functions as an informational alert that system is being brought up, and all processes are being notified to start executing. The event is informational and no further action is required.
Process Manager: Killing Process - Maintenance (37)
The Process Manager: Killing Process event functions as an informational alert that a process is being killed. A software problem occurred while the system was being brought up or shut down. Either a process did not come up when the system was brought up and had to be killed in order to restart it or a process did not come up when the system was brought up and had to be killed in order to restart it. The event is informational and no further action is required.
Process Manager: Clearing the Database - Maintenance (38)
The Process Manager: Clearing the Database event functions as an informational alert that the system is preparing to copy data from the mate. The system has been brought up and the mate side is running. The event is informational and no further action is required.
Process Manager: Cleared the Database - Maintenance (39)
The Process Manager: Cleared the Database event functions as an informational alert that the system is prepared to copy data from the mate. The system has been brought up and the mate side is running. The event is informational and no further action is required.
Process Manager: Binary Does not Exist for Process - Maintenance (40)
The Process Manager: Binary Does not Exist for Process alarm (critical) indicates that the platform was not installed correctly. To troubleshoot and correct the cause of the Process Manager: Binary Does not Exist for Process alarm, refer to the "Process Manager: Binary Does not Exist for Process - Maintenance (40)" section.
Administrative State Change Successful with Warning - Maintenance (41)
The Administrative State Change Successful with Warning event functions as a warning that the system was in a flux when a successful administrative state change occurred. The primary cause of the event is that the system was in flux state when an administrative change state command was issued. To correct the primary cause of the event, retry the command.
Number of Heartbeat Messages Received is Less Than 50% of Expected - Maintenance (42)
The Number of Heartbeat messages Received is Less Than 50% of Expected alarm (major) indicates that number of heartbeat (HB) messages being received is less than 50% of expected number. To troubleshoot and correct the cause of the Number of Heartbeat messages Received is Less Than 50% of Expected alarm, refer to the "Number of Heartbeat Messages Received is Less Than 50% of Expected - Maintenance (42)" section.
Process Manager: Process Failed to Come Up in Active Mode - Maintenance (43)
The Process Manager: Process Failed to Come Up in Active Mode alarm (critical) indicates that the process has failed to come up in active mode. To troubleshoot and correct the cause of the Process Manager: Process Failed to Come Up in Active Mode alarm, refer to the "Process Manager: Process Failed to Come Up in Active Mode - Maintenance (43)" section.
Process Manager: Process Failed to Come Up in Standby Mode - Maintenance (44)
The Process Manager: Process Failed to Come Up in Standby Mode alarm (critical) indicates that the process has failed to come up in standby mode. To troubleshoot and correct the cause of the Process Manager: Process Failed to Come Up in Standby Mode alarm, refer to the "Process Manager: Process Failed to Come Up in Standby Mode - Maintenance (44)" section.
Application Instance State Change Failure - Maintenance (45)
The Application Instance State Change Failure alarm (major) indicates that an application instance state change failed. To troubleshoot and correct the cause of the Application Instance State Change Failure alarm, refer to the "Application Instance State Change Failure - Maintenance (45)" section.
Network Interface Restored - Maintenance (46)
The Network Interface Restored event functions as an informational alert that the network interface was restored. The primary cause of the event is that the interface cable is reconnected and the interface is put `up' using ifconfig command. The event is informational and no further action is required.
Thread Watchdog Counter Expired for a Thread - Maintenance (47)
The Thread Watchdog Counter Expired for a Thread alarm (critical) indicates that a thread watchdog counter has expired for a thread. To troubleshoot and correct the cause of the Thread Watchdog Counter Expired for a Thread alarm, refer to the "Thread Watchdog Counter Expired for a Thread - Maintenance (47)" section.
Index Table Usage Exceeded Minor Usage Threshold Level - Maintenance (48)
The Index Table Usage Exceeded Minor Usage Threshold Level alarm (minor) indicates that the index (IDX) table usage has exceeded the minor threshold crossing usage level. To troubleshoot and correct the cause of the Index Table Usage Exceeded Minor Usage Threshold Level alarm, refer to the "Index Table Usage Exceeded Minor Usage Threshold Level - Maintenance (48)" section.
Index Table Usage Exceeded Major Usage Threshold Level - Maintenance (49)
The Index Table Usage Exceeded Major Usage Threshold Level alarm (major) indicates that the IDX table usage has exceeded the major threshold crossing usage level. To troubleshoot and correct the cause of the Index Table Usage Exceeded Major Usage Threshold Level alarm, refer to the "Index Table Usage Exceeded Major Usage Threshold Level - Maintenance (49)" section.
Index Table Usage Exceeded Critical Usage Threshold Level - Maintenance (50)
The Index Table Usage Exceeded Critical Usage Threshold Level alarm (critical) indicates that the IDX table usage has exceeded the critical threshold crossing usage level. To troubleshoot and correct the cause of the Index Table Usage Exceeded Critical Usage Threshold Level alarm, refer to the "Index Table Usage Exceeded Critical Usage Threshold Level - Maintenance (50)" section.
A Process Exceeds 70% of Central Processing Unit Usage - Maintenance (51)
The A Process Exceeds 70% of Central Processing Unit Usage alarm (major) indicates that a process has exceeded the CPU usage threshold of 70 percent. To troubleshoot and correct the cause of the A Process Exceeds 70% of Central Processing Unit Usage alarm, refer to the "A Process Exceeds 70% of Central Processing Unit Usage - Maintenance (51)" section.
Central Processing Unit Usage is Now Below the 50% Level - Maintenance (52)
The Central Processing Unit Usage is Now Below the 50% Level event functions as an informational alert that the CPU usage level has fallen below the threshold level of 50 percent. The event is informational and no further action is required.
The Central Processing Unit Usage is Over 90% Busy - Maintenance (53)
The Central Processing Unit Usage is Over 90% Busy alarm (critical) indicates that the CPU usage is over the threshold level of 90 percent. To troubleshoot and correct the cause of The Central Processing Unit Usage is Over 90% Busy alarm, refer to the "The Central Processing Unit Usage is Over 90% Busy - Maintenance (53)" section.
The Central Processing Unit has Returned to Normal Levels of Operation - Maintenance (54)
The The Central Processing Unit has Returned to Normal Levels of Operation event functions as an informational alert that the CPU usage has returned to the normal level of operation. The event is informational and no further actions is required.
The Five Minute Load Average is Abnormally High - Maintenance (55)
The Five Minute Load Average is Abnormally High alarm (major) indicates the five minute load average is abnormally high. To troubleshoot and correct the cause of The Five Minute Load Average is Abnormally High alarm, refer to the "The Five Minute Load Average is Abnormally High - Maintenance (55)" section.
The Load Average has Returned to Normal Levels - Maintenance (56)
The Load Average has Returned to Normal Levels event functions as an informational alert the load average has returned to normal levels. The event is informational and no further action is required.
Memory and Swap are Consumed at Critical Levels - Maintenance (57)
Note
The Memory and Swap are Consumed at Critical Levels alarm (critical) indicates that memory and swap file usage have reached critical levels. To troubleshoot and correct the cause of the Memory and Swap are Consumed at Critical Levels alarm, refer to the "Memory and Swap are Consumed at Critical Levels - Maintenance (57)" section.
Memory and Swap are Consumed at Abnormal Levels - Maintenance (58)
Note
The Memory and Swap are Consumed at Abnormal Levels event functions as an informational alert the memory and swap file usage are being consumed at abnormal levels. The primary cause of the event is that a process or multiple processes have consumed an abnormal amount of memory on the system and the operating system is utilizing an abnormal amount of the swap space for process execution. This can be a result of high call rates or bulk provisioning activity. Monitor the system to ensure all subsystems are performing normally. If so, only lightening the effective load on the system will clear the situation. If not, verify which process(es) are running at abnormally high rates, and contact Cisco TAC. Refer to the "Obtaining Documentation and Submitting a Service Request" section on page liii for detailed instructions on contacting Cisco TAC and opening a service request.
No Heartbeat Messages Received Through the Interface - Maintenance (61)
The No Heartbeat Messages Received Through the Interface alarm (critical) indicates that no HB messages are being received through the local network interface. To troubleshoot and correct the cause of the No Heartbeat Messages Received Through the Interface alarm, refer to the "No Heartbeat Messages Received Through the Interface - Maintenance (61)" section.
Link Monitor: Interface Lost Communication - Maintenance (62)
The Link Monitor: Interface Lost Communication alarm (major) indicates that a interface has lost communication. To troubleshoot and correct the cause of the Link Monitor: Interface Lost Communication alarm, refer to the "Link Monitor: Interface Lost Communication - Maintenance (62)" section.
Outgoing Heartbeat Period Exceeded Limit - Maintenance (63)
The Outgoing Heartbeat Period Exceeded Limit alarm (major) indicates that the outgoing HB period has exceeded the limit. To troubleshoot and correct the cause of the Outgoing Heartbeat Period Exceeded Limit alarm, refer to the "Outgoing Heartbeat Period Exceeded Limit - Maintenance (63)" section.
Average Outgoing Heartbeat Period Exceeds Major Alarm Limit - Maintenance (64)
The Average Outgoing Heartbeat Period Exceeds Major Alarm Limit alarm (major) indicates that the average outgoing HB period has exceeded the major threshold crossing alarm limit. To troubleshoot and correct the cause of the Average Outgoing Heartbeat Period Exceeds Major Alarm Limit alarm, refer to the "Average Outgoing Heartbeat Period Exceeds Major Alarm Limit - Maintenance (64)" section.
Disk Partition Critically Consumed - Maintenance (65)
The Disk Partition Critically Consumed alarm (critical) indicates that the disk partition consumption has reached critical limits. To troubleshoot and correct the cause of the Disk Partition Critically Consumed alarm, refer to the "Disk Partition Critically Consumed - Maintenance (65)" section.
Disk Partition Significantly Consumed - Maintenance (66)
The Disk Partition Significantly Consumed alarm (major) indicates that the disk partition consumption has reached the major threshold crossing level. To troubleshoot and correct the cause of the Disk Partition Significantly Consumed alarm, refer to the "Disk Partition Significantly Consumed - Maintenance (66)" section.
The Free Inter-Process Communication Pool Buffers Below Minor Threshold - Maintenance (67)
The Free Inter-Process Communication Pool Buffers Below Minor Threshold alarm (minor) indicates that the number of free IPC pool buffers has fallen below the minor threshold crossing level. To troubleshoot and correct the cause of The Free Inter-Process Communication Pool Buffers Below Minor Threshold alarm, refer to the "The Free Inter-Process Communication Pool Buffers Below Minor Threshold - Maintenance (67)" section.
The Free Inter-Process Communication Pool Buffers Below Major Threshold - Maintenance (68)
The Free Inter-Process Communication Pool Buffers Below Major Threshold alarm (major) indicates that the number of free IPC pool buffers has fallen below the major threshold crossing level. To troubleshoot and correct the cause of The Free Inter-Process Communication Pool Buffers Below Major Threshold alarm, refer to the "The Free Inter-Process Communication Pool Buffers Below Major Threshold - Maintenance (68)" section.
The Free Inter-Process Communication Pool Buffers Below Critical Threshold - Maintenance (69)
The Free Inter-Process Communication Pool Buffers Below Critical Threshold alarm (critical) indicates that the number of free IPC pool buffers has fallen below the critical threshold crossing level. To troubleshoot and correct the cause of The Free Inter-Process Communication Pool Buffers Below Critical Threshold alarm, refer to the "The Free Inter-Process Communication Pool Buffers Below Critical Threshold - Maintenance (69)" section.
The Free Inter-Process Communication Pool Buffer Count Below Minimum Required - Maintenance (70)
The Free Inter-Process Communication Pool Buffers Below Critical Threshold alarm (critical) indicates that the IPC pool buffers are not being freed properly by the application or the application is not able to keep up with the incoming IPC messaging traffic. To troubleshoot and correct the cause of The Free Inter-Process Communication Pool Buffers Below Critical Threshold alarm, refer to the "The Free Inter-Process Communication Pool Buffer Count Below Minimum Required - Maintenance (70)" section.
Local Domain Name System Server Response Too Slow - Maintenance (71)
The Local Domain Name System Server Response Too Slow alarm (major) indicates that the response time of the local DNS server is too slow. To troubleshoot and correct the cause of the Local Domain Name System Server Response Too Slow alarm, refer to the "Local Domain Name System Server Response Too Slow - Maintenance (71)" section.
External Domain Name System Server Response Too Slow - Maintenance (72)
The External Domain Name System Server Response Too Slow alarm (major) indicates that the response time of the external DNS server is too slow. To troubleshoot and correct the cause of the External Domain Name System Server Response Too Slow alarm, refer to the "External Domain Name System Server Response Too Slow - Maintenance (72)" section.
External Domain Name System Server not Responsive - Maintenance (73)
The External Domain Name System Server not Responsive alarm (critical) indicates that the external DNS server is not responding to network queries. To troubleshoot and correct the cause of the External Domain Name System Server not Responsive alarm, refer to the "External Domain Name System Server not Responsive - Maintenance (73)" section.
Local Domain Name System Service not Responsive - Maintenance (74)
The Local Domain Name System Service not Responsive alarm (critical) indicates that the local DNS server is not responding to network queries. To troubleshoot and correct the cause of the Local Domain Name System Service not Responsive alarm, refer to the "Local Domain Name System Service not Responsive - Maintenance (74)" section.
Mismatch of Internet Protocol Address Local Server and Domain Name System - Maintenance (75)
The Mismatch of Internet Protocol Address Local Server and Domain Name System event functions as a warning that a mismatch of the local server IP address and the DNS server address has occurred. The primary cause of the event is that the DNS server updates are not getting to the Cisco BTS 10200 Softswitch from the external server, or the discrepancy was detected before the local DNS lookup table was updated. Ensure the external DNS server is operational and sending updates to the Cisco BTS 10200 Softswitch.
Mate Time Differs Beyond Tolerance - Maintenance (77)
The Mate Time Differs Beyond Tolerance alarm (major) indicates that the mate differs beyond the tolerance. To troubleshoot and correct the cause of the Mate Time Differs Beyond Tolerance alarm, refer to the "Mate Time Differs Beyond Tolerance - Maintenance (77)" section.
Bulk Data Management System Admin State Change - Maintenance (78)
The Bulk Data Management System Admin State Change event functions as an informational alert that the BDMS administrative state has changed. The primary cause of the event is that the Bulk Data Management Server was switched over manually. The event is informational and no further action is required.
Resource Reset - Maintenance (79)
The Resource Reset event functions as an informational alert that a resource reset has occurred. The event is informational and no further action is required.
Resource Reset Warning - Maintenance (80)
The Resource Reset Warning event functions as an informational alert that a resource reset is about to occur. The event is informational and no further action is required.
Resource Reset Failure - Maintenance (81)
The Resource Reset Failure event functions as an informational alert that a resource reset has failed. The primary cause of the event an internal messaging error. Check dataword three (failure reason) to determine if this is caused by invalid user input, inconsistent provisioning of the device, or if the system is busy and a timeout occurred.
Average Outgoing Heartbeat Period Exceeds Critical Limit - Maintenance (82)
The Average Outgoing Heartbeat Period Exceeds Critical Limit alarm (critical) indicates that the average outgoing HB period has exceeded the critical limit threshold. To troubleshoot and correct the cause of the Average Outgoing Heartbeat Period Exceeds Critical Limit alarm, refer to the "Average Outgoing Heartbeat Period Exceeds Critical Limit - Maintenance (82)" section.
Swap Space Below Minor Threshold - Maintenance (83)
The Swap Space Below Minor Threshold alarm (minor) indicates that the swap space has fallen below the minor threshold level. To troubleshoot and correct the cause of the Swap Space Below Minor Threshold alarm, refer to the "Swap Space Below Minor Threshold - Maintenance (83)" section.
Swap Space Below Major Threshold - Maintenance (84)
The Swap Space Below Major Threshold alarm (major) indicates that the swap space has fallen below the major threshold level. To troubleshoot and correct the cause of the Swap Space Below Major Threshold alarm, refer to the "Swap Space Below Major Threshold - Maintenance (84)" section.
Swap Space Below Critical Threshold - Maintenance (85)
The Swap Space Below Critical Threshold alarm (critical) indicates that the swap space has fallen below the critical threshold level. To troubleshoot and correct the cause of the Swap Space Below Major Threshold alarm, refer to the "Swap Space Below Critical Threshold - Maintenance (85)" section.
System Health Report Collection Error - Maintenance (86)
The System Health Report Collection Error alarm (minor) indicates that an error occurred while collecting System Health Report. To troubleshoot and correct the cause of the System Health Report Collection Error alarm, refer to the "System Health Report Collection Error - Maintenance (86)" section.
Status Update Process Request Failed - Maintenance (87)
The Status Update Process Request Failed alarm (major) indicates that the status update process request failed. To troubleshoot and correct the cause of the Status Update Process Request Failed alarm, refer to the "Status Update Process Request Failed - Maintenance (87)" section.
Status Update Process Database List Retrieval Error - Maintenance (88)
The Status Update Process Database List Retrieval Error alarm (major) indicates that the status update process DB had a retrieval error. To troubleshoot and correct the cause of the Status Update Process Database List Retrieval Error alarm, refer to the "Status Update Process Database List Retrieval Error - Maintenance (88)" section.
Status Update Process Database Update Error - Maintenance (89)
The Status Update Process Database Update Error alarm (major) indicates that the status update process DB had an update error. To troubleshoot and correct the cause of the Status Update Process Database Update Error alarm, refer to the "Status Update Process Database Update Error - Maintenance (89)" section.
Disk Partition Moderately Consumed - Maintenance (90)
The Disk Partition Moderately Consumed alarm (minor) indicates that the disk partition is moderately consumed. To troubleshoot and correct the cause of the Disk Partition Moderately Consumed alarm, refer to the "Disk Partition Moderately Consumed - Maintenance (90)" section.
Internet Protocol Manager Configuration File Error - Maintenance (91)
The Internet Protocol Manager Configuration File Error alarm (critical) indicates that IPM configuration file has an error. To troubleshoot and correct the cause of the Internet Protocol Manager Configuration File Error alarm, refer to the "Internet Protocol Manager Configuration File Error - Maintenance (91)" section.
Internet Protocol Manager Initialization Error - Maintenance (92)
The Internet Protocol Manager Initialization Error alarm (major) indicates that the IPM process failed to initialize correctly. To troubleshoot and correct the cause of the Internet Protocol Manager Initialization Error alarm, refer to the "Internet Protocol Manager Initialization Error - Maintenance (92)" section.
Internet Protocol Manager Interface Failure - Maintenance (93)
The Internet Protocol Manager Interface Failure alarm (major) indicates that an IPM interface has failed. To troubleshoot and correct the cause of the Internet Protocol Manager Interface Failure alarm, refer to "Internet Protocol Manager Interface Failure - Maintenance (93)" section.
Internet Protocol Manager Interface State Change - Maintenance (94)
The Internet Protocol Manager Interface State Change event functions as an informational alert that the state of the IPM interface has changed. The primary cause of the event is that the IPM changed state on an interface (up or down). The event is informational and no further action is required.
Internet Protocol Manager Interface Created - Maintenance (95)
The Internet Protocol Manager Interface Created event functions as an informational alert that the IPM has created a new logical interface. The event is informational and no further action is required.
Internet Protocol Manager Interface Removed - Maintenance (96)
The Internet Protocol Manager Interface Removed event functions as an informational alert that the IPM has removed a logical interface. The event is informational and no further action is required.
Inter-Process Communication Input Queue Entered Throttle State - Maintenance (97)
The Inter-Process Communication Input Queue Entered Throttle State alarm (critical) alarm indicates that the thread is not able to process its IPC input messages fast enough, hence the input queue has grown too large and is using up too much of the IPC memory pool resource. To troubleshoot and correct the cause of the Inter-Process Communication Input Queue Entered Throttle State alarm, refer to the "Inter-Process Communication Input Queue Entered Throttle State - Maintenance (97)" section.
Inter-Process Communication Input Queue Depth at 25% of its Hi-Watermark - Maintenance (98)
The Inter-Process Communication Input Queue Depth at 25% of its Hi-Watermark alarm (minor) indicates that the IPC input queue depth has reached 25 percent of its hi-watermark. To troubleshoot and correct the cause of the Inter-Process Communication Input Queue Depth at 25% of its Hi-Watermark alarm, refer to the "Inter-Process Communication Input Queue Depth at 25% of Its Hi-Watermark - Maintenance (98)" section.
Inter-Process Communication Input Queue Depth at 50% of its Hi-Watermark - Maintenance (99)
The Inter-Process Communication Input Queue Depth at 50% of its Hi-Watermark alarm (major) indicates that the IPC input queue depth has reached 50 percent of its hi-watermark. To troubleshoot and correct the cause of the Inter-Process Communication Input Queue Depth at 50% of its Hi-Watermark alarm, refer to the "Inter-Process Communication Input Queue Depth at 50% of Its Hi-Watermark - Maintenance (99)" section.
Inter-Process Communication Input Queue Depth at 75% of its Hi-Watermark - Maintenance (100)
The Inter-Process Communication Input Queue Depth at 75% of its Hi-Watermark alarm (critical) indicates that the IPC input queue depth has reached 75 percent of its hi-watermark. To troubleshoot and correct the cause of the Inter-Process Communication Input Queue Depth at 75% of its Hi-Watermark alarm, refer to the "Inter-Process Communication Input Queue Depth at 75% of Its Hi-Watermark - Maintenance (100)" section.
Switchover in Progress - Maintenance (101)
The Switchover in Progress alarm (critical) indicates that a system switchover is progress. This alarm is issued when a system switchover is in progress either due to manual switchover (via CLI command), failover switchover, or automatic switchover. No action needs to be taken, the alarm is cleared when switchover is complete. Service is temporarily suspended for a short period of time during this transition.
Thread Watchdog Counter Close to Expiry for a Thread - Maintenance (102)
The Thread Watchdog Counter Close to Expiry for a Thread alarm (critical) indicates that the thread watchdog counter is close to expiry for a thread. The primary cause of the alarm is that a software error has occurred. No further action is required, the Cisco BTS 10200 Softswitch system will automatically recover or shutdown.
Central Processing Unit is Offline - Maintenance (103)
The Central Processing Unit is Offline alarm (critical) indicates that the CPU is offline. To troubleshoot and correct the cause of the Central Processing Unit is Offline alarm, refer to the "Central Processing Unit is Offline - Maintenance (103)" section.
Aggregration Device Address Successfully Resolved - Maintenance (104)
The Aggregration Device Address Successfully Resolved event functions as an informational alert that the aggregration device address has been successfully resolved. The event is informational and no further actions is required.
Unprovisioned Aggregration Device Detected - Maintenance (105)
The Unprovisioned Aggregration Device Detected event serves as a warning that an unprovisioned aggregration device has been detected. The primary cause of the event is that the AGGR IP address is not provisioned in AGGR table. To correct the cause of the event, provision the AGGR with the AGGR IP address in the AGGR table.
Aggregration Device Address Resolution Failure - Maintenance (106)
The Aggregration Device Address Resolution Failure event serves as a warning the aggregration device address resolution has failed. The primary cause of the event is that the auto AGGR-ID resolution for the MGW IP failed due to DNS lookup failure. To correct the cause of the event, check the provisioning of DNS reverse lookup entry for the MGW IP address.
No Heartbeat Messages Received Through Interface From Router - Maintenance (107)
The No Heartbeat Messages Received Through Interface From Router alarm (critical) indicates the no HB messages are being received through the interface from the router. To troubleshoot and correct the cause of the No Heartbeat Messages Received Through Interface From Router alarm, refer to the "No Heartbeat Messages Received Through Interface From Router - Maintenance (107)" section.
A Log File Cannot be Transferred - Maintenance (108)
The A Log File Cannot be Transferred event serves as a warning that a log file cannot be transferred. The primary cause of the event is that there is an access problem with the external archive system. To correct the primary cause of the event, check the external archive system. The secondary cause of the event is that the network is having a problem. To correct the secondary cause of the event, check the network. The ternary cause of the event is that the source log is not present. To correct ternary cause of the event, check for the presence of a log file.
Five Successive Log Files Cannot be Transferred - Maintenance (109)
The Five Successive Log Files Cannot be Transferred alarm (major) indicates that five successive log files cannot be transferred to the archive system. To troubleshoot and correct the cause of the Five Successive Log Files Cannot be Transferred alarm, refer to the "Five Successive Log Files Cannot be Transferred - Maintenance (109)" section.
Access to Log Archive Facility Configuration File Failed or File Corrupted - Maintenance (110)
The Access to Log Archive Facility Configuration File Failed or File Corrupted alarm (major) indicates that access to the LAF configuration file failed or the file is corrupted. To troubleshoot and correct the cause of the Access to Log Archive Facility Configuration File Failed or File Corrupted alarm, refer to the "Access to Log Archive Facility Configuration File Failed or File Corrupted - Maintenance (110)" section.
Cannot Login to External Archive Server - Maintenance (111)
The Cannot Login to External Archive Server alarm (critical) indicates that the user cannot login to the external archive server. To troubleshoot and correct the cause of the Cannot Login to External Archive Server alarm, refer to the "Cannot Login to External Archive Server - Maintenance (111)" section.
Domain Name Server Zone Database does not Match Between the Primary Domain Name Server and the Internal Secondary Authoritative Domain Name Server - Maintenance (118)
The Domain Name Server Zone Database does not Match Between the Primary Domain Name Server and the Internal Secondary Authoritative Domain Name Server alarm (critical) indicates that the zone transfer between primary DNS and secondary DNS failed. To troubleshoot and correct the cause of the Domain Name Server Zone Database does not Match Between the Primary Domain Name Server and the Internal Secondary Authoritative Domain Name Server alarm, refer to the "Domain Name Server Zone Database does not Match Between the Primary Domain Name Server and the Internal Secondary Authoritative Domain Name Server - Maintenance (118)" section.
Periodic Shared Memory Database Backup Failure - Maintenance (119)
The Periodic Shared Memory Database Backup Failure alarm (critical) indicates that the periodic shared memory database backup has failed. To troubleshoot and correct the cause of the Periodic Shared Memory Database Backup Failure alarm, refer to the "Periodic Shared Memory Database Backup Failure - Maintenance (119)" section.
Periodic Shared Memory Database Backup Success - Maintenance (120)
The Periodic Shared Memory Database Backup Success event functions as an informational alert that the periodic shared memory database backup has been successfully completed. The event is informational and no further action is required.
Northbound Provisioning Message is Retransmitted - Maintenance (122)
The Northbound Provisioning Message is Retransmitted event serves as an informational alert that a northbound message has been retransmitted. The primary cause of the event is that EMS hub maybe responding slowly. To correct the primary cause of the event, check to see if there are any hub alarms. Take the appropriate action according to the alarms.
Northbound Provisioning Message Dropped Due To Full Index Table - Maintenance (123)
The Northbound Provisioning Message Dropped Due To Full Index Table event serves as a warning that a northbound provisioning message has been dropped due to a full index table. The primary cause of the event is that EMS hub is not responding. To correct the primary cause of the event, verify if there are any alarms originating from the hub and take the appropriate action.
Troubleshooting Maintenance Alarms
This section provides the information needed to troubleshoot and correct Maintenance alarms. Table 7-3 lists all Maintenance alarms in numerical order and provides cross reference to each subsection in this section.
Local Side has Become Faulty - Maintenance (3)
The Local Side has Become Faulty alarm (major) indicates that the local side has become faulty. The alarm can result from maintenance reports 5, 6, 9, 10, 19, or 20. Review information from CLI log report. The alarm is usually caused by a software problem. To correct the primary cause of the alarm, restart the software using the Installation and Startup procedure. The alarm can also be caused by manually shutting down the system using platform stop command. To correct the secondary cause of the alarm, reboot host machine, reinstall all applications and restart all applications. If the alarm is reoccurring, the operating system or the hardware may have a problem.
Mate Side has Become Faulty - Maintenance (4)
The Mate Side has Become Faulty alarm (major) indicates that the mate side has become faulty. The primary cause of the alarm is that the local side has detected the mate side going into a faulty state. To correct the primary cause of the alarm, display the event summary on the faulty mate side, using the report event-summary command (see the CLI Guide for command details). Review information in the event summary. The alarm is usually caused by a software problem. After confirming the active side is processing traffic, restart software on the mate side. Log in to the mate platform as root user. Enter platform stop command and then platform start command. If a software restart does not resolve the problem or if the platform goes immediately to faulty again, or does not start, contact Cisco TAC. It may be necessary to reinstall software. If the alarm is reoccurring, then the operating system or the hardware may have a problem. Reboot host machine, then reinstall and restart all applications. The reboot will bring down the other applications running on the machine. Contact Cisco TAC for assistance. Refer to the "Obtaining Documentation and Submitting a Service Request" section on page liii for detailed instructions on contacting Cisco TAC and opening a service request.
Changeover Failure - Maintenance (5)
The Changeover Failure alarm (major) indicates that a changeover failed. The alarm is issued when changing from an active processor to a standby processor and the changeover fails. To correct the cause of the alarm, review alarm information from CLI log report. This alarm is usually caused by a software problem on the specific platform identified in the alarm report. Restart the platform identified in the alarm report. If the platform restart is not successful, reinstall the application on the platform, and then restart platform again. If necessary, reboot host machine the platform is located on. Then reinstall and restart all applications on this machine. If faulty state is a reoccurring event, then operating system or the hardware may be defective. Contact Cisco TAC for assistance. It may also be helpful to gather information event/alarm reports that were issued before and after this alarm report. Refer to the "Obtaining Documentation and Submitting a Service Request" section on page liii for detailed instructions on contacting Cisco TAC and opening a service request.
Changeover Timeout - Maintenance (6)
The Changeover Timeout alarm (major) indicates that a changeover timed out. The cause of the alarm is that the system failed to changeover within time period. Soon after this event is issued, one platform will go to faulty state. This alarm is usually caused by a software problem on the specific platform identified in the alarm report. To correct the cause of the alarm, review information from CLI log report. On the platform identified in this alarm report, restart the platform. If platform restart is not successful, reinstall the application for this platform, and then restart platform again. If necessary, reboot host machine the platform is located on. Then reinstall and restart all applications on this machine. If faulty state is a reoccurring event, then operating system or hardware may be defective. Contact Cisco TAC for assistance. It may also be helpful to gather information event/alarm reports that were issued before and after this alarm report. Refer to the "Obtaining Documentation and Submitting a Service Request" section on page liii for detailed instructions on contacting Cisco TAC and opening a service request.
Mate Rejected Changeover - Maintenance (7)
The Mate Rejected Changeover alarm (major) indicates that the mate rejected the changeover. The primary cause of the alarm is that the mate is not in a stable state. To correct the primary cause of the alarm, enter the status command to get information on the two systems in the pair (primary and secondary EMS, CA or FS). The secondary cause of the alarm is that the mate detects that it is faulty during changeover and then rejects changeover.
To correct the secondary cause of the alarm, check to see if the mate is faulty (not running), then perform the corrective action steps listed in the "Mate Side has Become Faulty - Maintenance (4)" section. Additionally, if both systems (local and mate) are still running, diagnose whether both instances are operating in stable state (one in active and the other in standby). If both are in a stable state, wait 10 minutes and try the "control" command again. If standby side is not in stable state, bring down the standby side and restart software using the "platform stop" and "platform start" commands. If software restart does not resolve the problem, or if the problem is commonly occurring, contact Cisco TAC. It may be necessary to reinstall software. Additional operating system or hardware problems may also need to be resolved. Refer to the "Obtaining Documentation and Submitting a Service Request" section on page liii for detailed instructions on contacting Cisco TAC and opening a service request.
To continue troubleshooting the cause of the alarm, refer to Figure 7-1 if the forced switchover has been rejected by the secondary. Refer to Figure 7-2 if the primary failed to come up in the active state.
Figure 7-1 Corrective Action for Maintenance Event (7) (Mate Rejected Changeover)
Forced Switchover Rejected By Secondary
Figure 7-2 Corrective Action for Maintenance Event (7) (Mate Rejected Changeover)
Primary Failed To Come Up in Active State
Note
Mate Changeover Timeout - Maintenance (8)
The Mate Changeover Timeout alarm (major) indicates that the mate changeover timed out. The primary cause of the alarm is that the mate is faulty. This alarm is usually caused by a software problem on the specific mate platform identified in the alarm report. To correct the primary cause of the alarm, review information from CLI log report concerning faulty mate. On the mate platform identified in this alarm report, restart the platform. If mate platform restart is not successful, reinstall the application for this mate platform, and then restart mate platform again. If necessary, reboot host machine this mate platform is located on. Then reinstall and restart all applications on that machine.
Local Initialization Failure - Maintenance (9)
The Local Initialization Failure alarm (major) indicates that the local initialization has failed. The primary cause of the alarm is that the local initialization has failed. When this alarm event report is issued, the system has failed and the re-initialization process has failed. To correct the primary cause of the alarm, check that the binary files are present for the unit (Call Agent, Feature Server, Element Manager). If the files are not present, then re-install the files from the initial or the backup media. Then restart the failed device.
Local Initialization Timeout - Maintenance (10)
The Local Initialization Timeout alarm (major) indicates that the local initialization has timed out. The primary cause of this alarm is that the local initialization has timed out. When the event report is issued, the system has failed and the re-initialization process has failed. To correct the primary cause of the alarm, check that the binary files are present for the unit (Call Agent, Feature, Server, or Element Manager). If the files are not present, then re-install the files from initial or backup media. Then restart the failed device.
Process Manager: Process has Died - Maintenance (18)
The Process Manager: Process has Died alarm (minor) indicates that a process has died. The primary cause of the alarm is that a software problem has occurred. If problem persists or is reoccurring, contact Cisco TAC. Refer to the "Obtaining Documentation and Submitting a Service Request" section on page liii for detailed instructions on contacting Cisco TAC and opening a service request.
Process Manager: Process Exceeded Restart Rate - Maintenance (19)
The Process Manager: Process Exceeded Restart Rate alarm (major) indicates that a process has exceeded the restart rate. This alarm is usually caused by a software problem on the specific platform identified in the alarm report. Soon after this event is issued, one platform will go to faulty state. To correct the primary cause of the alarm, review the information from CLI log report. On the platform identified in this alarm report, restart the platform. If platform restart is not successful, reinstall the application for this platform, and then restart platform again. If necessary, reboot host machine this platform is located on. Then reinstall and restart all applications on this machine.
If faulty state is a commonly occurring event, then OS or hardware may be a problem. Contact Cisco TAC for assistance. It may also be helpful to gather information event/alarm reports that were issued before and after this alarm report.
Lost Connection to Mate - Maintenance (20)
The Lost Connection to Mate alarm (major) indicates that the keepalive module connection to the mate has been lost. The primary cause of the alarm is that a network interface hardware problem was occurred. Soon after this event is issued, one platform may go to faulty state. To correct the primary cause of this alarm, check whether the network interface is down. If so, restore network interface and restart the software. The secondary cause of the alarm is a router problem. If secondary cause of the alarm is a router problem, then repair router and reinstall.
Network Interface Down - Maintenance (21)
The Network Interface Down alarm (major) indicates that the network interface has gone down. The primary cause of the alarm is a network interface hardware problem. Soon after this alarm event is issued, one platform may go to faulty state. Subsequently system goes faulty. To correct the primary cause of the alarm, check whether the network interface is down. If so, restore network interface and restart the software.
Process Manager: Process Failed to Complete Initialization - Maintenance (23)
The Process Manager: Process Failed to Complete Initialization alarm (major) indicates that a PMG process failed to complete initialization. The primary cause of the this alarm is that the specified process failed to complete initialization during the restoral process. To correct the primary cause of the alarm, verify that the specified process's binary image is installed. If not, install it and restart the platform.
Process Manager: Restarting Process - Maintenance (24)
The Process Manager: Restarting Process alarm (minor) indicates the a PMG process is being restarted. The primary cause of the alarm is that a software problem process has exited abnormally and had to be restarted. If problem is recurrent, contact Cisco TAC. Refer to the "Obtaining Documentation and Submitting a Service Request" section on page liii for detailed instructions on contacting Cisco TAC and opening a service request.
Process Manager: Going Faulty - Maintenance (26)
The Process Manager: Going Faulty alarm (major) indicates that a PMG process is going faulty. The primary cause of the alarm is that the system has been brought down or the system has detected a fault. If the alarm is not due to the operator intentionally bringing down the system, then the platform has detected a fault and has shut down. This is typically followed by the Maintenance (3) alarm event. To correct the primary cause of the alarm, use the corrective action procedures provided for the Maintenance (3) alarm event. Refer to the "Local Side has Become Faulty - Maintenance (3)" section.
Process Manager: Binary Does not Exist for Process - Maintenance (40)
The Process Manager: Binary Does not Exist for Process alarm (critical) indicates that the platform was not installed correctly. The primary cause of the alarm is that the platform was not installed correctly. To correct the primary cause of the alarm, reinstall the platform.
Number of Heartbeat Messages Received is Less Than 50% of Expected - Maintenance (42)
The Number of Heartbeat Messages Received is Less Than 50% of Expected alarm (major) indicates that number of HB messages being received is less than 50% of expected number. The primary cause of the alarm is that a network problem has occurred. To correct the primary cause of the alarm, fix the network problem.
Process Manager: Process Failed to Come Up in Active Mode - Maintenance (43)
The Process Manager: Process Failed to Come Up in Active Mode alarm (critical) indicates that the process has failed to come up in active mode. The primary cause of the alarm is a software or configuration problem. To correct the primary cause of the alarm, restart the platform. If problem persists or is recurrent, contact Cisco TAC. Refer to the "Obtaining Documentation and Submitting a Service Request" section on page liii for detailed instructions on contacting Cisco TAC and opening a service request.
Process Manager: Process Failed to Come Up in Standby Mode - Maintenance (44)
The Process Manager: Process Failed to Come Up in Standby Mode alarm (critical) indicates that the process has failed to come up in standby mode. The primary cause of the alarm is a software or a configuration problem. To correct the primary cause of the alarm, restart the platform. If problem persists or is recurrent, contact Cisco TAC. Refer to the "Obtaining Documentation and Submitting a Service Request" section on page liii for detailed instructions on contacting Cisco TAC and opening a service request.
Application Instance State Change Failure - Maintenance (45)
The Application Instance State Change Failure alarm (major) indicates that an application instance state change failed. The primary cause of the alarm is that a switchover of an application instance failed because of a platform fault. To correct the primary cause of the alarm, retry the switchover and if condition continues, contact Cisco TAC. Refer to the "Obtaining Documentation and Submitting a Service Request" section on page liii for detailed instructions on contacting Cisco TAC and opening a service request.
Thread Watchdog Counter Expired for a Thread - Maintenance (47)
The Thread Watchdog Counter Expired for a Thread alarm (critical) indicates that a thread watchdog counter has expired for a thread. The primary cause of the alarm is a software error. No action is required, the system will automatically recover or shutdown.
Index Table Usage Exceeded Minor Usage Threshold Level - Maintenance (48)
The Index Table Usage Exceeded Minor Usage Threshold Level alarm (minor) indicates that the IDX table usage has exceeded the minor threshold crossing usage level. The primary cause of the alarm is that call traffic has exceeded design limits. To correct the primary cause of the alarm, verify that traffic is within the rated capacity. The secondary cause of the alarm is that a software problem requiring additional analysis has occurred. To correct the secondary cause of the alarm, contact Cisco TAC. Refer to the "Obtaining Documentation and Submitting a Service Request" section on page liii for detailed instructions on contacting Cisco TAC and opening a service request.
Index Table Usage Exceeded Major Usage Threshold Level - Maintenance (49)
The Index Table Usage Exceeded Major Usage Threshold Level alarm (major) indicates that the IDX table usage has exceeded the major threshold crossing usage level. The primary cause of the alarm is that call traffic has exceeded design limits. To correct the primary cause of the alarm, verify that traffic is within the rated capacity. The secondary cause of the alarm is that a software problem requiring additional analysis has occurred. To correct the secondary cause of the alarm, contact Cisco TAC. Refer to the "Obtaining Documentation and Submitting a Service Request" section on page liii for detailed instructions on contacting Cisco TAC and opening a service request.
Index Table Usage Exceeded Critical Usage Threshold Level - Maintenance (50)
The Index Table Usage Exceeded Critical Usage Threshold Level alarm (critical) indicates that the IDX table usage has exceeded the critical threshold crossing usage level. The primary cause of the alarm is that call traffic has exceeded design limits. To correct the primary cause of the alarm, verify that traffic is within the rated capacity. The secondary cause of the alarm is that a software problem requiring additional analysis has occurred. To correct the secondary cause of the alarm, contact Cisco TAC. Refer to the "Obtaining Documentation and Submitting a Service Request" section on page liii for detailed instructions on contacting Cisco TAC and opening a service request.
A Process Exceeds 70% of Central Processing Unit Usage - Maintenance (51)
The A Process Exceeds 70% of Central Processing Unit Usage alarm (major) indicates that a process has exceeded the CPU usage threshold of 70 percent. The primary cause of the alarm is that a process has entered a state of erratic behavior. To correct the primary cause of the alarm, monitor the process and kill it if necessary.
The Central Processing Unit Usage is Over 90% Busy - Maintenance (53)
The Central Processing Unit Usage is Over 90% Busy alarm (critical) indicates that the CPU usage is over the threshold level of 90 percent. The primary causes of the alarm are to numerous to determine. Try to isolate the problem and Call Cisco TAC for assistance. Refer to the "Obtaining Documentation and Submitting a Service Request" section on page liii for detailed instructions on contacting Cisco TAC and opening a service request.
The Five Minute Load Average is Abnormally High - Maintenance (55)
The Five Minute Load Average is Abnormally High alarm (major) indicates the five minute load average is abnormally high. The primary cause of the alarm is that multiple processes are vying for processing time on the system, which is normal in a high traffic situation such as heavy call processing or bulk provisioning. To correct the primary cause of the alarm, monitor the system to ensure all subsystems are performing normally. If so, only lightening the effective load on the system will clear the situation. If not, verify which process(es) are running at abnormally high rates and provide the information to Cisco TAC. Refer to the "Obtaining Documentation and Submitting a Service Request" section on page liii for detailed instructions on contacting Cisco TAC and opening a service request.
Memory and Swap are Consumed at Critical Levels - Maintenance (57)
Note
The Memory and Swap are Consumed at Critical Levels alarm (critical) indicates that memory and swap file usage have reached critical levels. The primary cause of the alarm is that a process or multiple processes have consumed a critical amount of memory on the system and the operating system is utilizing a critical amount of the swap space for process execution. This can be a result of high call rates or bulk provisioning activity. To correct the primary cause of the alarm, monitor the system to ensure all subsystems are performing normally. If so, only lightening the effective load on the system will clear the situation. If not, verify which process(es) are running at abnormally high rates and provide the information to Cisco TAC. Refer to the "Obtaining Documentation and Submitting a Service Request" section on page liii for detailed instructions on contacting Cisco TAC and opening a service request.
No Heartbeat Messages Received Through the Interface - Maintenance (61)
The No Heartbeat Messages Received Through the Interface alarm (critical) indicates that no HB messages are being received through the local network interface. The primary cause of the alarm that the local network interface is down. To correct the primary cause of the alarm, restore the local network interface. The secondary cause of the alarm is that the mate network interface on the same sub-net is faulty. To correct the secondary cause of the alarm, restore the mate network interface. The ternary cause of the alarm is network congestion.
Link Monitor: Interface Lost Communication - Maintenance (62)
The Link Monitor: Interface Lost Communication alarm (major) indicates that a interface has lost communication. The primary cause of the alarm is that the interface cable is pulled out or interface has been set to "down" using ifconfig command. To correct the primary cause of the alarm, restore the network interface. The secondary cause of the alarm is that the interface has no connectivity to any of the machines or routers.
Outgoing Heartbeat Period Exceeded Limit - Maintenance (63)
The Outgoing Heartbeat Period Exceeded Limit alarm (major) indicates that the outgoing HB period has exceeded the limit. The primary cause of the alarm is system performance degradation due to CPU overload or excessive I/O operations. To correct the primary cause of the alarm, identify the applications which are causing the system degradation via the CLI commands to verify if this is a persistent or on-going situation. Contact Cisco TAC with the gathered information. Refer to the "Obtaining Documentation and Submitting a Service Request" section on page liii for detailed instructions on contacting Cisco TAC and opening a service request.
Average Outgoing Heartbeat Period Exceeds Major Alarm Limit - Maintenance (64)
The Average Outgoing Heartbeat Period Exceeds Major Alarm Limit alarm (major) indicates that the average outgoing HB period has exceeded the major threshold crossing alarm limit. The primary cause of the alarm is system performance degradation due to CPU overload or excessive I/O operations. To correct the primary cause of the alarm, identify the applications which are causing the system degradation via the CLI commands to verify if this is a persistent or on-going situation. Contact Cisco TAC with the gathered information. Refer to the "Obtaining Documentation and Submitting a Service Request" section on page liii for detailed instructions on contacting Cisco TAC and opening a service request.
Disk Partition Critically Consumed - Maintenance (65)
The Disk Partition Critically Consumed alarm (critical) indicates that the disk partition consumption has reached critical limits. The primary cause of the alarm is that a process or processes is/are writing extraneous data to the named partition. To correct the primary cause of the alarm, perform a disk clean-up and maintenance on the offending system.
Disk Partition Significantly Consumed - Maintenance (66)
The Disk Partition Significantly Consumed alarm (major) indicates that the disk partition consumption has reached the major threshold crossing level. The primary cause of the alarm is that a process or processes is/are writing extraneous data to the named partition. To correct the primary cause of the alarm, perform a disk clean-up and maintenance on the offending system.
The Free Inter-Process Communication Pool Buffers Below Minor Threshold - Maintenance (67)
The Free Inter-Process Communication Pool Buffers Below Minor Threshold alarm (minor) indicates that the number of free IPC pool buffers has fallen below the minor threshold crossing level. The primary cause of the alarm is that IPC pool buffers are not being freed properly by the application or the application is not able to keep up with the incoming IPC messaging traffic. To correct the primary cause of the alarm, contact Cisco TAC immediately. Refer to the "Obtaining Documentation and Submitting a Service Request" section on page liii for detailed instructions on contacting Cisco TAC and opening a service request.
The Free Inter-Process Communication Pool Buffers Below Major Threshold - Maintenance (68)
The Free Inter-Process Communication Pool Buffers Below Major Threshold alarm (major) indicates that the number of free IPC pool buffers has fallen below the major threshold crossing level. The primary cause of the alarm is that IPC pool buffers are not being freed properly by the application or the application is not able to keep up with the incoming IPC messaging traffic. To correct the primary cause of the alarm, contact Cisco TAC immediately. Refer to the "Obtaining Documentation and Submitting a Service Request" section on page liii for detailed instructions on contacting Cisco TAC and opening a service request.
The Free Inter-Process Communication Pool Buffers Below Critical Threshold - Maintenance (69)
The Free Inter-Process Communication Pool Buffers Below Critical Threshold alarm (critical) indicates that the number of free IPC pool buffers has fallen below the critical threshold crossing level. The primary cause of the alarm is that IPC pool buffers are not being freed properly by the application or the application is not able to keep up with the incoming IPC messaging traffic. To correct the primary cause of the alarm, contact Cisco TAC immediately. Refer to the "Obtaining Documentation and Submitting a Service Request" section on page liii for detailed instructions on contacting Cisco TAC and opening a service request.
The Free Inter-Process Communication Pool Buffer Count Below Minimum Required - Maintenance (70)
The Free Inter-Process Communication Pool Buffer Count Below Minimum Required alarm (critical) indicates that the IPC pool buffers are not being freed properly by the application or the application is not able to keep up with the incoming IPC messaging traffic. The primary cause of the alarm is that IPC pool buffers are not being freed properly by the application or the application is not able to keep up with the incoming IPC messaging traffic. To correct the primary cause of the alarm, contact Cisco TAC immediately. Refer to the "Obtaining Documentation and Submitting a Service Request" section on page liii for detailed instructions on contacting Cisco TAC and opening a service request.
Local Domain Name System Server Response Too Slow - Maintenance (71)
The Local Domain Name System Server Response Too Slow alarm (major) indicates that the response time of the local DNS server is too slow. The primary cause of the alarm is that the local DNS server is too busy. To correct the primary cause of the alarm, check the local DNS server.
External Domain Name System Server Response Too Slow - Maintenance (72)
The External Domain Name System Server Response Too Slow alarm (major) indicates that the response time of the external DNS server is too slow. The primary cause of the alarm is that the network traffic level is busy, or the nameserver is very busy. To correct the primary cause of the alarm, check the DNS server(s). The secondary cause of the alarm is that there is an daemon called monitorDNS.sh checking the DNS server every minute or so. It will issue alarm if it cannot contact the DNS server or the response is slow. But it will clear the alarm if later it can contact the DNS server.
External Domain Name System Server not Responsive - Maintenance (73)
The External Domain Name System Server not Responsive alarm (critical) indicates that the external DNS server is not responding to network queries. The primary cause of the alarm is that the DNS servers or the network may be down. To correct the primary cause of the alarm, check the DNS server(s). The secondary cause of the alarm is that there is an daemon called monitorDNS.sh checking DNS server every minute or so. It will issue alarm if it cannot contact the DNS server or the response is slow. But it will clear the alarm if later it can contact the DNS server.
Local Domain Name System Service not Responsive - Maintenance (74)
The Local Domain Name System Service not Responsive alarm (critical) indicates that the local DNS server is not responding to network queries. The primary cause of the alarm is that the local DNS service may be down. To correct the primary cause of the alarm, check the local DNS server.
Mate Time Differs Beyond Tolerance - Maintenance (77)
The Mate Time Differs Beyond Tolerance alarm (major) indicates that the mate differs beyond the tolerance. The primary cause of the alarm is that time synchronization not working. To correct the primary cause of the alarm, change the UNIX time on the Faulty or Standby side. If the change is occur on the Standby, stop platform first.
Average Outgoing Heartbeat Period Exceeds Critical Limit - Maintenance (82)
The Average Outgoing Heartbeat Period Exceeds Critical Limit alarm (critical) indicates that the average outgoing HB period has exceeded the critical limit threshold. The primary cause of the alarm is that the CPU is overloaded. To correct the primary cause of the alarm, shutdown the platform.
Swap Space Below Minor Threshold - Maintenance (83)
The Swap Space Below Minor Threshold alarm (minor) indicates that the swap space has fallen below the minor threshold level. The primary cause of the alarm is that too many processes are running. To correct the primary cause of the alarm, stop the proliferation of executables (processes-scripts). The secondary cause of the alarm is that the /tmp or /var/run are being over-used. To correct the secondary cause of the alarm, cleanup the file systems.
Swap Space Below Major Threshold - Maintenance (84)
The Swap Space Below Major Threshold alarm (major) indicates that the swap space has fallen below the major threshold level. The primary cause of the alarm is that too many processes are running. To correct the primary cause of the alarm, stop the proliferation of executables (processes/shell-procedures). The secondary cause of the alarm is that the /tmp or /var/run are being over-used. To correct the secondary cause of the alarm, cleanup the file systems.
Swap Space Below Critical Threshold - Maintenance (85)
The Swap Space Below Critical Threshold alarm (critical) indicates that the swap space has fallen below the critical threshold level. The primary cause of the alarm is that too many processes are running. To correct the primary cause of the alarm, restart the Cisco BTS 10200 Softswitch software or reboot system The secondary cause of the alarm is that the /tmp or /var/run are being over-used. To correct the secondary cause of the alarm, cleanup the file systems.
System Health Report Collection Error - Maintenance (86)
The System Health Report Collection Error alarm (minor) indicates that an error occurred while collecting System Health Report. The primary cause of the alarm is that an error occur while collecting the System Health Report. To correct the primary cause of the alarm, contact Cisco TAC. Refer to the "Obtaining Documentation and Submitting a Service Request" section on page liii for detailed instructions on contacting Cisco TAC and opening a service request.
Status Update Process Request Failed - Maintenance (87)
The Status Update Process Request Failed alarm (major) indicates that the status update process request failed. The primary cause of the alarm is that the "status" command is not working properly. To correct the primary cause of the alarm, verify that the "status" command is working properly via CLI.
Status Update Process Database List Retrieval Error - Maintenance (88)
The Status Update Process Database List Retrieval Error alarm (major) indicates that the status update process DB had a retrieval error. The primary cause of the alarm is the Oracle DB is not working properly. To correct the primary cause of the alarm, contact Cisco TAC. Refer to the "Obtaining Documentation and Submitting a Service Request" section on page liii for detailed instructions on contacting Cisco TAC and opening a service request.
Status Update Process Database Update Error - Maintenance (89)
The Status Update Process Database Update Error alarm (major) indicates that the status update process DB had an update error. The primary cause of the alarm is that the MySQL DB on the EMS is not working properly. To correct the primary cause of the alarm, contact Cisco TAC. Refer to the "Obtaining Documentation and Submitting a Service Request" section on page liii for detailed instructions on contacting Cisco TAC and opening a service request.
Disk Partition Moderately Consumed - Maintenance (90)
The Disk Partition Moderately Consumed alarm (minor) indicates that the disk partition is moderately consumed. The primary cause of the alarm is that a process or processes is/are writing extraneous data to the named partition. To correct the primary cause of the alarm, perform a disk clean-up and maintenance on the offending system.
Internet Protocol Manager Configuration File Error - Maintenance (91)
The Internet Protocol Manager Configuration File Error alarm (critical) indicates that IPM configuration file has an error. The primary cause of the alarm is a IPM configuration file error. To correct the primary cause of the alarm, check the IPM configuration file (ipm.cfg) for incorrect syntax.
Internet Protocol Manager Initialization Error - Maintenance (92)
The Internet Protocol Manager Initialization Error alarm (major) indicates that the IPM process failed to initialize correctly. The primary cause of the alarm is that IPM failed to initialize correctly. To correct the primary cause of the alarm, check the "reason" dataword to identify and correct the cause of the alarm.
Internet Protocol Manager Interface Failure - Maintenance (93)
The Internet Protocol Manager Interface Failure alarm (major) indicates that an IPM interface has failed. The primary cause of the alarm is that IPM failed to create logical interface. To correct the primary cause of the alarm, check the "reason" dataword to identify and correct the cause of the alarm.
Inter-Process Communication Input Queue Entered Throttle State - Maintenance (97)
The Inter-Process Communication Input Queue Entered Throttle State alarm (critical) alarm indicates that the thread is not able to process its IPC input messages fast enough, hence the input queue has grown too large and is using up too much of the IPC memory pool resource. The primary cause of the alarm is that the indicated thread is not able to process its IPC input messages fast enough, hence the input queue has grown too large and is using up too much of the IPC memory pool resource. To correct the primary cause of the alarm, contact Cisco TAC. Refer to the "Obtaining Documentation and Submitting a Service Request" section on page liii for detailed instructions on contacting Cisco TAC and opening a service request.
Inter-Process Communication Input Queue Depth at 25% of Its Hi-Watermark - Maintenance (98)
The Inter-Process Communication Input Queue Depth at 25% of Its Hi-Watermark alarm (minor) indicates that the IPC input queue depth has reached 25 percent of its hi-watermark. The primary cause of the alarm is that the indicated thread is not able to process its IPC input messages fast enough, hence the input queue has grown too large and is at 25% of the level at which it will enter the throttle state. To correct the primary cause of the alarm, contact Cisco TAC. Refer to the "Obtaining Documentation and Submitting a Service Request" section on page liii for detailed instructions on contacting Cisco TAC and opening a service request.
Inter-Process Communication Input Queue Depth at 50% of Its Hi-Watermark - Maintenance (99)
The Inter-Process Communication Input Queue Depth at 50% of Its Hi-Watermark alarm (major) indicates that the IPC input queue depth has reached 50 percent of its hi-watermark. The primary cause of the alarm is that the indicated thread is not able to process its IPC input messages fast enough, hence the input queue has grown too large and is at 50% of the level at which it will enter the throttle state. To correct the primary cause of the alarm, contact Cisco TAC. Refer to the "Obtaining Documentation and Submitting a Service Request" section on page liii for detailed instructions on contacting Cisco TAC and opening a service request.
Inter-Process Communication Input Queue Depth at 75% of Its Hi-Watermark - Maintenance (100)
The Inter-Process Communication Input Queue Depth at 75% of Its Hi-Watermark alarm (critical) indicates that the IPC input queue depth has reached 75 percent of its hi-watermark. The primary cause of the alarm is that the indicated thread is not able to process its IPC input messages fast enough, hence the input queue has grown too large and is at 75% of the level at which it will enter the throttle state. To correct the primary cause of the alarm, contact Cisco TAC. Refer to the "Obtaining Documentation and Submitting a Service Request" section on page liii for detailed instructions on contacting Cisco TAC and opening a service request.
Switchover in Progress - Maintenance (101)
The Switchover in Progress alarm (critical) indicates that a system switchover is progress. This alarm is issued when a system switchover is in progress either due to manual switchover (via CLI command), failover switchover, or automatic switchover. No action needs to be taken, the alarm is cleared when switchover is complete. Service is temporarily suspended for a short period of time during this transition. The primary cause of the alarm is that a system switchover occurred either due to manual switchover (via CLI command), failover or automatic switchover. No action need to be taken, the alarm is cleared itself when switchover is complete. The service is temporarily suspended for a short period of time during this transition.
Thread Watchdog Counter Close to Expiry for a Thread - Maintenance (102)
The Thread Watchdog Counter Close to Expiry for a Thread alarm (critical) indicates that the thread watchdog counter is close to expiry for a thread. The primary cause of the alarm is that a software error has occurred. No further action is required, the Cisco BTS 10200 Softswitch system will automatically recover or shutdown.
Central Processing Unit is Offline - Maintenance (103)
The Central Processing Unit is Offline alarm (critical) indicates that the CPU is offline. The primary cause of the alarm is operator action. To correct the primary cause of the alarm, restore CPU or contact Cisco TAC. Refer to the "Obtaining Documentation and Submitting a Service Request" section on page liii for detailed instructions on contacting Cisco TAC and opening a service request.
No Heartbeat Messages Received Through Interface From Router - Maintenance (107)
The No Heartbeat Messages Received Through Interface From Router alarm (critical) indicates the no HB messages are being received through the interface from the router. The primary cause of the alarm is that the router is down. To correct the primary cause of alarm, restore router functionality. The secondary cause of the alarm is that the connection to the router is down. To correct the secondary cause of the alarm, restore the connection to the router. The ternary cause of the alarm is network congestion.
Five Successive Log Files Cannot be Transferred - Maintenance (109)
The Five Successive Log Files Cannot be Transferred alarm (major) indicates that five successive log files cannot be transferred to the archive system. The primary cause of the alarm is that there is a problem in access to external archive system. To correct the primary cause of the alarm, check the external archive system. The secondary cause of the alarm is that the network to external archive system is down. To correct the secondary cause of the alarm, check the status of the network.
Access to Log Archive Facility Configuration File Failed or File Corrupted - Maintenance (110)
The Access to Log Archive Facility Configuration File Failed or File Corrupted alarm (major) indicates that access to the LAF configuration file failed or the file is corrupted. The primary cause of the alarm is the LAF file is corrupted. To correct the primary cause of the alarm, check the LAF configuration file. The secondary cause of the alarm is that the LAF file is missing. To correct the secondary cause of the alarm, check for the presence of LAF configuration file.
Cannot Login to External Archive Server - Maintenance (111)
The Cannot Login to External Archive Server alarm (critical) indicates that the user cannot login to the external archive server. The primary cause of the alarm is that no authorization access is set up in external archive server for that user from Cisco BTS 10200 Softswitch. To correct the primary cause of the alarm, set up the authorization. The secondary cause of the alarm is that the external archive server is down. To correct the secondary cause of the alarm, ping the external archive server, and try to bring it up. The ternary cause of the alarm is that the network is down. To correct the ternary cause of the alarm, check the network.
Domain Name Server Zone Database does not Match Between the Primary Domain Name Server and the Internal Secondary Authoritative Domain Name Server - Maintenance (118)
The Domain Name Server Zone Database does not Match Between the Primary Domain Name Server and the Internal Secondary Authoritative Domain Name Server alarm (critical) indicates that the zone transfer between primary DNS and secondary DNS failed. To troubleshoot and correct the cause of the Domain Name Server Zone Database does not Match Between the Primary Domain Name Server and the Internal Secondary Authoritative Domain Name Server alarm, check the system log and monitor the DNS traffic through port 53 (default port for DNS).
Periodic Shared Memory Database Backup Failure - Maintenance (119)
The Periodic Shared Memory Database Backup Failure alarm (critical) indicates that the periodic shared memory database backup has failed. The primary cause of the alarm is that disk usage is high. To correct the primary cause of the alarm, check disk usage.