Table Of Contents
Report Menu Tasks
Viewing Port Statistics
Configuring the Refresh Rate
Viewing Fibre Channel Statistics
Viewing IP Statistics
Viewing Ethernet Statistics
Graphing Port Statistics
Using a Swap Chart Type, Layout, and Scale
Viewing Card Statistics
Viewing Fibre Channel Card Statistics
Viewing Ethernet Card Statistics
Configuring the Refresh Rate
Graphing Card Statistics
Using Swap Chart Type, Layout, and Scale
Report Menu Tasks
This chapter describes the Report menu tasks for Element Manager and contains these sections:
• Viewing Port Statistics
•Graphing Port Statistics
•Viewing Card Statistics
•Graphing Card Statistics
Note Use the Report menu to view card and port statistics. With the menu, you can view all relevant statistics in a table, or you can choose statistics to create a custom graph.
Viewing Port Statistics
To view port statistics, perform the following steps:
Step 1 In the chassis display, click the port whose statistics you want to view.
Step 2 Click the Report menu and choose Graph Port. A window opens that displays the type and number of the port.
Step 3 Click the Interface tab. A table of port statistics appears. Table 7-1 lists and describes the fields in this table.
Table 7-1 Port Statistics Display Field Descriptions
Field
|
Description
|
InOctets
|
Cumulative number of octets that arrived at the port, including framing characters.
|
InUcastPkts
|
Cumulative number of incoming packets destined for a single port.
|
InMulticastPkts
|
Cumulative number of incoming packets destined for the ports of a multicast group.
|
InBroadcastPkts
|
Cumulative number of incoming packets destined for all ports on the fabric.
|
InDiscards
|
Cumulative number of inbound packets that the port discarded for a reason other than a packet error (such as the lack of buffer space).
|
InErrors
|
Number of inbound packets with errors that the port discarded.
|
InUnknownProtos
|
For packet-oriented interfaces, the number of packets received via the interface that were discarded because of an unknown or unsupported protocol. For character-oriented or fixed-length interfaces that support protocol multiplexing, the number of transmission units received via the interface that were discarded because of an unknown or unsupported protocol. For any interface that does not support protocol multiplexing, this counter is always 0.
|
OutOctets
|
Total number of octets transmitted out of the interface, including framing characters.
|
OutUcastPkts
|
Total number of packets that higher-level protocols requested be transmitted, and which were not addressed to a multicast or broadcast address at this sublayer, including those packets that were discarded or not sent.
|
OutMulticastPkts
|
Total number of packets that higher-level protocols requested be transmitted, and which were addressed to a multicast address at this sub-layer, including those that were discarded or not sent. For a MAC layer protocol, includes both Group and Functional addresses.
|
OutBroadcastPkts
|
Total number of packets that higher-level protocols requested to be transmitted, and which were addressed to a broadcast address at this sublayer, including those packets that were discarded or not sent.
|
OutDiscards
|
Number of outbound packets that were chosen to be discarded even though no errors had been detected to prevent their being transmitted. One possible reason for discarding such a packet could be to free-up buffer space.
|
OutErrors
|
For packet-oriented interfaces, the number of outbound packets that could not be transmitted because of errors. For character-oriented or fixed-length interfaces, the number of outbound transmission units that could not be transmitted because of errors.
|
Configuring the Refresh Rate
Element Manager refreshes all statistics displays at regular intervals. To configure the interval, perform the following steps:
Step 1 In the chassis display, click the port whose refresh rate you want to change.
Step 2 Click the Report menu and choose Graph Port. A window opens that displays the type and number of the port.
Step 3 Click the pulldown menu at the bottom of the window and choose the interval at which you want the display to refresh.
Note You do not need to click any apply or ok button. The change takes place immediately.
Viewing Fibre Channel Statistics
In addition to general statistics, the Report menu provides Fibre Channel-specific statistics for FC gateway ports. To view FC statistics, perform the following steps:
Step 1 In the chassis display, click the FC gateway port whose FC statistics you want to view.
Step 2 Click the Report menu and choose Graph Port. A window opens that displays the type and number of the port.
Step 3 Click the FibreChannel tab. A table of FC statistics appears. Table 7-2 lists and describes the fields in this table.
Table 7-2 Fibre Channel Statistics Field Descriptions
Field
|
Description
|
FcSecondsSinceLastReset
|
Number of seconds since the Fibre Channel port last reset.
|
LinkEvents
|
Total number of link events (such as link up, link down) processed by the Fibre Channel interface gateway(s).
|
FcpCmdsOutstanding
|
Total number of FCP commands outstanding on the Fibre Channel interface gateway(s).
|
FcpCmdsCompleted
|
Total number of FCP commands completed on the Fibre Channel interface gateway(s).
|
FcpErrors
|
Total number of FCP errors encountered on the Fibre Channel interface gateway(s).
|
FcInitiatorIO
|
Quantity of Initiator I/O.
|
FcTxFrames
|
Number of transmitted Fibre Channel frames.
|
FcTxWords
|
Number of transmitted Fibre Channel words.
|
FcRxFrames
|
Number of received Fibre Channel frames.
|
FcRxWords
|
Number of received Fibre Channel words.
|
FcLIPCount
|
Number of Loop Initialization Primitives.
|
FcNOSCount
|
Number of not operational primitive sequences.
|
FcErrorFrames
|
Number of error frames.
|
FcDumpedFrames
|
Number of frames that the port dumped.
|
FcLinkFailureCount
|
Number of link failures.
|
FcLossOfSyncCount
|
Number of loss-of-sync errors.
|
FcLossOfSignalCount
|
Number of loss-of-signal errors.
|
FcPrimitiveSeqProtocolErrCount
|
Number of primitive sequence protocol errors.
|
FcInvalidTxWordCount
|
Number of invalid transmission word errors.
|
FcInvalidCRCCount
|
Number of invalid cyclical redundancy checks.
|
Viewing IP Statistics
In addition to general statistics, the Report menu provides IP-specific statistics for Ethernet gateway ports. To view IP statistics, perform the following steps:
Step 1 In the chassis display, click the Ethernet gateway port whose IP statistics you want to view.
Step 2 Click the Report menu and choose Graph Port. A window opens that displays the type and number of the port.
Step 3 Click the IP tab. A table of IP statistics appears. Table 7-3 lists and describes the fields in this table.
Table 7-3 IP Statistics Field Descriptions
Field
|
Description
|
InReceives
|
Cumulative number of input datagrams (including errors) that interfaces received for the IP address that you specified with the ip keyword.
|
InHdrErrors
|
Cumulative number of datagrams that interfaces discarded. Reasons to discard a datagram include the following:
•Bad checksums
•Version number mismatches
•Format errors
•Exceeded time-to-live values
•IP option processing errors
|
InHdrChksumErr
|
The number of input datagrams discarded due to a checksum error in their IP headers.
|
InAddrErrors
|
Cumulative number of input datagrams that ports discarded because the IP address in the destination field of the header of the datagram was not a valid address to be received by the port.
|
ForwDatagrams
|
Cumulative number of datagrams that arrived at the port en-route to a final destination. For non-IP-gateway ports, this value includes only packets that the port source-routed successfully.
|
InUnknownProtos
|
Cumulative number of datagrams that the port successfully received but discarded due to an unknown or unsupported protocol.
|
InDiscards
|
Cumulative number of datagrams that the port discarded for a reason other than a problem with the datagram (such as the lack of buffer space).
|
InDelivers
|
Cumulative number of input datagrams that the port successfully delivered to IP user protocols, including the Internet Control-Message Protocol (ICMP).
|
OutRequests
|
Cumulative number of IP datagrams that local IP user protocols (including ICMP) supplied to IP in-requests. This counter does not include any datagrams counted as forw-datagrams.
|
OutDiscards
|
Cumulative number of output IP datagrams that the port discarded for a reason other than a problem with the datagram (such as the lack of buffer space).
|
OutNoRoutes
|
Cumulative number of IP datagrams that the port discarded because a route could not be found to transmit them to their destination. This counter includes any packets counted in forw-datagrams that still qualify. This counter also includes any datagrams that a server switch cannot route because all of the gateways on the server switch are down.
|
FragOKs
|
Cumulative number of IP datagrams that the port has successfully fragmented.
|
FragFails
|
Cumulative number of IP datagrams that the port discarded because the port could not fragment them. (For instance, this occurs when the Don't Fragment flag of the datagram is set.)
|
FragCreates
|
Cumulative number of IP datagram fragments that the port has generated.
|
Viewing Ethernet Statistics
In addition to general statistics, the Report menu provides IP-specific statistics for Ethernet gateway ports. To view Ethernet statistics, perform the following steps:
Step 1 In the chassis display, click the Ethernet gateway port whose Ethernet statistics you want to view.
Step 2 Click the Report menu and choose Graph Port. A window opens that displays the type and number of the port.
Step 3 Click the Ethernet tab. A table of Ethernet statistics appears. Table 7-4 lists and describes the fields in this table.
Table 7-4 Ethernet Statistics Field Descriptions
Field
|
Description
|
AlignmentErrors
|
A count of frames received on a particular interface that are not an integral number of octets in length and do not pass the FCS check. The count represented by an instance of this object is incremented when the alignmentError status is returned by the MAC service to the LLC (or other MAC user). Received frames for which multiple error conditions obtain are counted exclusively according to the error status presented to the LLC. This counter does not increment for 8-bit wide group encoding schemes.
|
FCSErrors
|
A count of frames received on a particular interface that are an integral number of octets in length but do not pass the FCS check. This count does not include frames received with frame-too-long or frame-too-short errors. The count represented by an instance of this object is incremented when the frameCheckError status is returned by the MAC service to the LLC (or other MAC user). Received frames for which multiple error conditions obtained are counted exclusively according to the error status presented to the LLC.
Coding errors detected by the physical layer for speeds above 10 Mbps will cause the frame to fail the FCS check.
|
SingleCollisionFrames
|
A count of successfully transmitted frames on a particular interface for which transmission is inhibited by exactly one collision. A frame that is counted by an instance of this object is also counted by the corresponding instance of the out-ucast-pkts, out-multicast-pkts, or out-broadcast-pkts, and is not counted by the corresponding instance of the multiple-collision-frames object. This counter does not increment when the interface is operating in full-duplex mode.
|
MultipleCollisionFrames
|
A count of successfully transmitted frames on a particular interface for which transmission is inhibited by more than one collision. A frame that is counted by an instance of this object is also counted by the corresponding instance of the out-ucast-pkts, out-multicast-pkts, or out-broadcast-pkts, and is not counted by the corresponding instance of the single-collision-frames object. This counter does not increment when the interface is operating in full-duplex mode.
|
SQETestErrors
|
A count of times that the SQE TEST ERROR message is generated by the PLS sublayer for a particular interface. The SQE TEST ERROR is set in accordance with the rules for verification of the SQE detection mechanism in the PLS Carrier Sense Function, as described in IEEE Std. 802.3, 1998 Edition, section 7.2.4.6. This counter does not increment on interfaces operating at speeds greater than 10 Mbps or on interfaces operating in full-duplex mode.
|
DeferredTransmissions
|
A count of frames for which the first transmission attempt on a particular interface is delayed because the medium is busy. The count represented by an instance of this object does not include frames involved in collisions. This counter does not increment when the interface is operating in full-duplex mode.
|
LateCollisions
|
The number of times that a collision is detected on a particular interface later than one Ethernet slot-time unit into the transmission of a packet. A late collision included in a count represented by an instance of this object is also considered as a generic collision for purposes of other collision-related statistics. This counter does not increment when the interface is operating in full-duplex mode.
|
ExcessiveCollisions
|
A count of frames for which transmission on a particular interface fails due to excessive collisions. This counter does not increment when the interface is operating in full-duplex mode.
|
InternalMacTransmitErrors
|
A count of frames for which transmission on a particular interface fails due to an internal MAC sublayer transmit error. A frame is only counted by an instance of this object if it is not counted by the corresponding instance of the late-collisions object, the excessive-collisions object, or the carrier-sense-errors object. The precise meaning of the count represented by an instance of this object is implementation-specific. In particular, an instance of this object may represent a count of transmission errors on a particular interface that is not otherwise counted.
|
CarrierSenseErrors
|
The number of times that the carrier sense condition was lost or never asserted when attempting to transmit a frame on a particular interface. The count represented by an instance of this object is incremented at most once per transmission attempt, even if the carrier sense condition fluctuates during a transmission attempt. This counter does not increment when the interface is operating in full-duplex mode.
|
FrameTooLongs
|
A count of frames received on a particular interface that exceed the maximum permitted frame size. The count represented by an instance of this object is incremented when the frame-too-longs status is returned by the MAC service to the LLC (or other MAC user). Received frames for which multiple error conditions obtain are counted exclusively according to the error status presented to the LLC.
|
InternalMacReceiveErrors
|
A count of frames for which reception on a particular interface fails due to an internal MAC sublayer receive error. A frame is only counted by an instance of this object if it is not counted by the corresponding instance of the frame-too-longs, alignment-errors, or fcs-errors object. The precise meaning of the count represented by an instance of this object is implementation-specific. In particular, an instance of this object may represent a count of receive errors on a particular interface that is not otherwise counted.
|
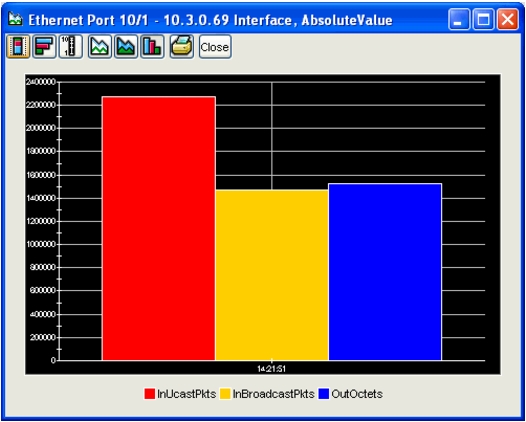
Graphing Port Statistics
Element Manager provides utilities that create line charts, area charts, bar charts, and pie charts to visually represent port statistics.
To graph particular port statistics, perform the following steps:
Step 1 In the chassis display, click the port whose statistics you want to view.
Step 2 Click the Report menu and choose Graph Port. A window opens that displays the type and number of the port.
Step 3 Click the Interface tab. (Optionally, you can click the IP, Ethernet, or FibreChannel tabs, when available.) A table of port statistics appears.
Step 4 Select the values that you want to include in the graph with one of the following methods:
–Click-and-drag your cursor across the values that you want to graph.
–Hold the Ctrl key and click the values that you want to graph.
Step 5 Click the button of the graph that you want to create. See Figure 7-1. The graph appears
Figure 7-1 Graph Buttons
 Line Chart
 Area Chart
 Bar Chart
 Pie Chart
Note With most charts, the display will reload with updated information based on the refresh rate. To configure the interval, refer to the "Configuring the Refresh Rate" section.
Using a Swap Chart Type, Layout, and Scale
With the exception of pie charts, the chart display lets you do the following:
•Swap between charts.
•Increase or decrease the scale of the display.
•View the chart horizontally or vertically.
To perform these functions, use the buttons in Table 7-5.
Table 7-5 Chart Buttons
Button
|
Name
|
Function
|

|
Stacked
|
Overlays the graphical output of each statistic.
|

|
Horizontal
|
Rotates the axis of the graph by 90 degrees.
|

|
Log Scale
|
Zooms in and out.
|

|
Line Chart
|
Displays a line chart.
|

|
Area Chart
|
Displays an area chart.
|

|
Bar Chart
|
Displays a bar chart.
|
Viewing Card Statistics
With Element Manager, you can view statistics of Fibre Channel gateway cards or Ethernet gateway cards.
Viewing Fibre Channel Card Statistics
To view port statistics, perform the following steps:
Step 1 In the chassis display, click the card whose statistics you want to view.
Step 2 Click the Report menu and choose Graph Card. A window opens that displays the type and number of the card and presents card statistics in tabular format. Table 7-6 lists and describes the fields in this table.
Table 7-6 FC Card Statistics
Field
|
Description
|
LinkEvents
|
Total number of link events (such as the link up, link down) processed by the Fibre Channel interface gateway(s).
|
SrpInitiatedIos
|
Total number of SRP I/O requests.
|
SrpCmdsCompleted
|
Cumulative number of commands that one or all FC gateways executed.
|
SrpBytesRead
|
Cumulative number of SRP bytes read by one or all FC gateways.
|
SrpBytesWritten
|
Cumulative number of SRP bytes written by one or all FC gateways.
|
SrpConnections
|
Total number of connections used by the SRP initiator.
|
SrpCmdsOutstanding
|
Cumulative number of outstanding SRP commands.
|
SrpErrors
|
Cumulative number of SRP errors.
|
FcInitiatedIos
|
Total number of I/O responses by the Fibre Channel device to SRP initiator requests.
|
FcpCmdsCompleted
|
Cumulative number of commands that one or all FC gateways executed.
|
FcpBytesRead
|
Cumulative number of FC bytes read by one or all FC gateways.
|
FcpBytesWritten
|
Cumulative number of FC bytes written by one or all FC gateways.
|
FcpCmdsOutstanding
|
Cumulative number of outstanding FC commands.
|
FcpErrors
|
Cumulative number of FC errors on one or all gateways.
|
Viewing Ethernet Card Statistics
To view port statistics, perform the following steps:
Step 1 In the chassis display, click the card whose statistics you want to view.
Step 2 Click the Report menu and choose Graph Card. A window opens that displays the type and number of the card and presents card statistics in tabular format. Table 7-7 lists and describes the fields in this table.
Table 7-7 Ethernet Card Statistics
Field
|
Description
|
InReceives
|
Cumulative number of input datagrams (including errors) that interfaces received for the IP address that you specified with the ip keyword.
|
InHdrErrors
|
Cumulative number of datagrams that interfaces discarded. Reasons to discard a datagram include the following:
•Bad checksums
•Version number mismatches
•Format errors
•Exceeded time-to-live values
•IP option processing errors
|
InHdrChksumErr
|
Cumulative number of header checksum errors.
|
InAddrErrors
|
Cumulative number of input datagrams that ports discarded because the IP address in the destination field of the header of the datagram was not a valid address to be received by the port.
|
ForwDatagrams
|
Cumulative number of datagrams that arrived at the port en-route to a final destination. For non-IP-gateway ports, this value includes only packets that the port source-routed successfully.
|
InUnknownProtos
|
Cumulative number of datagrams that the port successfully received but discarded due to an unknown or unsupported protocol.
|
InDiscards
|
Cumulative number of datagrams that the port discarded for a reason other than a problem with the datagram (such as the lack of buffer space).
|
InDelivers
|
Cumulative number of input datagrams that the port successfully delivered to IP user protocols, including Internet Control-Message Protocol (ICMP).
|
OutRequests
|
Cumulative number of IP datagrams that local IP userprotocols (including ICMP) supplied to IP in-requests. This counter does not include any datagrams counted as forw-datagrams.
|
OutDiscards
|
Cumulative number of output IP datagrams that the port discarded for a reason other than a problem with the datagram (such as the lack of buffer space).
|
OutNoRoutes
|
Cumulative number of IP datagrams that the port discarded because a route could not be found to transmit them to their destination. This counter includes any packets counted in forw-datagrams that still qualify. This counter also includes any datagrams that a server switch cannot route because all of the gateways on the server switch are down.
|
FragOKs
|
Cumulative number of IP datagrams that the port has successfully fragmented.
|
FragFails
|
Cumulative number of IP datagrams that the port discarded because the port could not fragment them. (For instance, this occurs when the Don't Fragment flag of the datagram is set.)
|
FragCreates
|
Cumulative number of IP datagram fragments that the port has generated.
|
Configuring the Refresh Rate
Element Manager refreshes all statistics displays at regular intervals. To configure the interval, perform the following steps:
Step 1 In the chassis display, click the port whose refresh rate you want to change.
Step 2 Click the Report menu and choose Graph Card. A window opens that displays the type and number of the port.
Step 3 Click the pulldown menu at the bottom of the window and choose the interval at which you want the display to refresh.
Note You do not need to click any apply or ok button. The change takes place immediately.
Graphing Card Statistics
Element Manager provides utilities that create line charts, area charts, bar charts, and pie charts to visually represent port statistics.
To graph particular card statistics, perform the following steps:
Step 1 In the chassis display, click the card whose statistics you want to view.
Step 2 Click the Report menu and choose Graph Card. A window opens that displays the type and number of the port. A table of card statistics appears.
Step 3 Select the values that you want to include in the graph with one of the following methods:
–Click-and-drag your cursor across the values that you want to graph.
–Hold the Ctrl key and click the values that you want to graph.
Step 4 Click the button of the graph that you want to create. See Figure 7-2. The graph appears.
Figure 7-2 Graph Buttons
 Line Chart
 Area Chart
 Bar Chart
 Pie Chart
The graph appears.
Example

Note With most charts, the display will reload with updated information based on the refresh rate. To configure the interval, refer to the "Configuring the Refresh Rate" section.
Using Swap Chart Type, Layout, and Scale
With the exception of pie charts, the chart display lets you do the following:
•Swap between charts.
•Increase or decrease the scale of the display.
•View the chart horizontally or vertically.
To perform these functions, use the buttons in Table 7-5.
Table 7-8 Chart Buttons
Button
|
Name
|
Function
|

|
Stacked
|
Overlays the graphical output of each statistic.
|

|
Horizontal
|
Rotates the axis of the graph by ninety degrees.
|

|
Log Scale
|
Zooms in and out.
|

|
Line Chart
|
Displays a line chart.
|

|
Area Chart
|
Displays an area chart.
|

|
Bar Chart
|
Displays a bar chart.
|

 Feedback

