-
Cisco Prime Performance Manager User Guide, 1.3
-
Preface
-
Prime Performance Manager Overview
-
Managing Gateways and Units Using the Command Line Interface
-
Managing the Web Interface
-
Integrating Prime Performance Manager with Prime Central
-
Discovering Network Devices
-
Managing Users
-
Managing Reports and Dashboards
-
Managing Devices
-
Managing Network Alarms and Events
-
Managing Thresholds
-
Displaying System Properties, Statuses, Messages, and Logs
-
Managing Gateways and Units
-
Configuring Prime Performance Manager for Firewalls
-
Backing Up and Restoring Prime Performance Manager
-
Prime Performance Manager and IPv6
-
Commands Reference
-
Predefined Thresholds
-
Glossary
-
Index
-
 Feedback
Table Of Contents
Overview to Prime Performance Manager
Overview to Prime Performance Manager
Cisco Prime Performance Manager provides performance statistics and reports for service provider and large enterprise networks including access, edge, distribution, core, mobile backhaul, Carrier Ethernet, and core MPLS networks.
The following topics provide an overview to Cisco Prime Performance Manager user operations:
Features and Functions
Prime Performance Manager acquires devices by importing Cisco Prime Network devices or by running device discovery (see Chapter 5 "Discovering Network Devices"). After acquiring devices, Prime Performance Manager uses SNMP polling to collect device performance statistics. Prime Performance Manager sends SNMP get, getnext, and getbulk requests to the device targeting many different SNMP MIBs. The device responds with data, and Prime Performance Manager collects the data and allows you to display it in many different ways in the Prime Performance Manager GUI.
In addition to SNMP, Prime Performance Manager supports Telnet and SSH polling for Y.1731 reports, and CSV-based (bulkstats) data collection.
Prime Performance Manager supports Cisco and non-Cisco platforms and devices. Supported Cisco devices include the Cisco 7600 Series Routers, Cisco ASR 901, 903, 1000, 5000, 5500, and 9000 Series Aggregation Services Routers, Cisco ME 3400, 3600, and 3800 Series Ethernet Access Switches, the Cisco Carrier Routing System (CRS), Cisco Mobile Wireless Routers (MWR), the Cisco uBR, CSV-based (bulk statistics) data collectin for StarOS mobile wireless reports, and many others.
Prime Performance Manager also provides extensive data center support including reports for data center networking, computing, storage, and virtualization devices and technologies. For a list of supported data center devices and technologies, see Displaying Data Center Reports.
For a detailed list of devices supported by Prime Performance Manager, visit: http://www.cisco.com/en/US/products/ps11715/products_device_support_tables_list.html
Prime Performance Manager is packaged with over 2800 standard historical, aggregation, and summary reports. Reports can be automatically generated on a 1-minute, 5-minute, 15-minute, hourly, daily, weekly, or monthly basis. Prime Performance Manager allows you to define collection intervals for each supported time interval on a per-report basis. All reports are available in GUI and CSV export format. In addition, you can use an XML editor to define new reports or extend the packaged reports. All reports are available in graph and table view formats in the GUI, and in CSV export format.
Note
For a list of all reports provided with Prime Performance Manager, from the Help menu, choose Reports, then click Reports List Readme.
Additional Prime Performance Manager features and functions include:
•
•
•
•
•
•
•
•
•
•
•
•
•
•
•
•
•
•
•
•
•
•
•
Reports
Prime Performance Manager includes over 1900 reports. All reports support table, chart, and dashboard outputs. High-level report categories include:
•
•
•
•
•
•
•
•
•
•
•
•
•
•
•
•
•
•
In addition, Prime Performance Manager Data Center view provides an extensive range of data center networking, computing, storage, and virtualization device and technology reports. For more information about Prime Performance Manager reports, see Chapter 7 "Managing Reports, Dashboards, and Views."
You can modify the provided Prime Performance Manager reports or create new reports. For information, see the Cisco Prime Performance Manager 1.3 Integration Developer Guide.
Dashboards
Prime Performance Manager dashboards present data from different sources on a single page. For example, the ICMP (Internet Control Message Protocol) application dashboard presents the top ten ICMP hourly packet rates, total errors, total echoes, and echo replies. The CPU/Memory dashboard presents the top ten hourly CPU average and peak utilization as well as the top ten hourly memory pool average and peak utilization. Dashboards provided with the Prime Performance Manager package include:
•
•
•
•
•
•
•
•
•
•
•
•
You can modify the provided Prime Performance Manager dashboards or create new ones. For information, see the Cisco Prime Performance Manager Integration Developer Guide.
For more information about Prime Performance Manager dashboards, see Chapter 7 "Managing Reports, Dashboards, and Views."
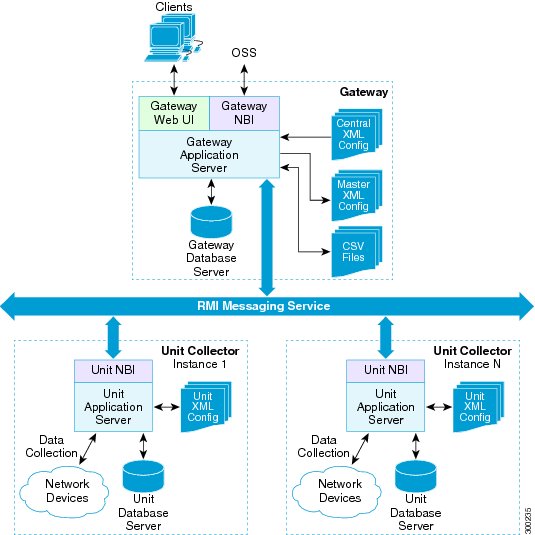
Architecture
Prime Performance Manager software and functions are distributed across a single gateway and one or more unit servers. The units connect to a gateway through the IP network and through a Secure Sockets Layer (SSL) connection. The gateway is the connection point for users, administrators, and northbound interface (NBI ) applications. It stores summarized data for network reports, and is the control point for alarm monitoring and forwarding. The gateway synchronizes administrative data with the units.
Units poll network devices and compute and store the data received from the devices. A unit can be installed with a gateway on the same physical server, or a unit can be installed on a separate physical server. The monitored devices are distributed across a single or multiple units, as directed by the gateway server.
All unit monitoring and management is conducted through the gateway. Gateway-to-unit communication is conducted using Java Remote Method Invocation (RMI).
Figure 1-1 shows the Prime Performance Manager architecture. Architecture elements include:
•
•
•
•
•
Figure 1-1 Prime Performance Manager Architecture
Note
Device Discovery
Devices can be added to Prime Performance Manager using one or both of the following methods:
•
•
If devices are imported from Prime Network or Prime Central, the device inventory updates are automatically communicated to Prime Performance Manager. Prime Network and Prime Central users can cross launch Prime Performance Manager reports directly from those applications.
For more information about Prime Performance Manager device discovery, see Chapter 5 "Discovering Network Devices."
Security
Prime Performance Manager security functions include:
•
•
•
•
•
•
•
For more information about Prime Performance Manager security functions, see Chapter 6 "Managing Users and Security."