
-
Cisco Prime Network User Guide, 3.11
-
Preface
-
Setting Up Devices and Using the GUI Clients
-
Working with the Cisco Prime Network Vision Client
-
Viewing and Managing NE Properties
-
Device Configurations and Software Images
-
Working with Prime Network Vision Maps
-
Working with Links
-
Labeling NEs Using Business Tags
-
Working with the Prime Network Events
-
Tracking Faults Using Prime Network Events
-
Working with Tickets in Cisco Prime Network Vision
-
Working with Reports
-
Using Cisco PathTracer to Diagnose Problems
-
Monitoring Carrier Ethernet Services
-
Monitoring Carrier Grade NAT Properties
-
Monitoring DWDM Properties
-
Monitoring Ethernet Operations, Administration,and Maintenance Tool Properties
-
Monitoring Y.1731 IPSLA Configuration
-
IPv6 and IPv6 VPN over MPLS
-
Viewing IP and MPLS Multicast Configurations
-
Viewing and Managing SBCs
-
Monitoring AAA Configurations
-
Monitoring IP Pools
-
Monitoring BNG Configurations
-
Icon and Button Reference
-
Glossary
-
Index
-
Table Of Contents
Viewing and Managing NE Properties
User Roles Required to Work with Prime Network Vision
Information Available in Element Icons
Viewing the Properties of a Network Element
Checking VNE Connectivity and Communication Status
Viewing the Physical Properties of a Device
Viewing Port Status and Properties
Generating the Port Utilization Graph
Viewing the Logical Properties of a Network Element
Logical Inventory Navigation Pane Branches
Logical Inventory Navigation Pane Icons
Logical Inventory Content Pane Tabs
Viewing Device Operating System Information
Running an Activation from the Activation Menu
Searching for Activations (Activation History)
Cloning an Existing Activation
Viewing and Managing NE Properties
The following topics describe the user access roles required to use Cisco Prime Network Vision (Prime Network Vision) and how to view network element physical and logical properties in any mapped network:
•
User Roles Required to Work with Prime Network Vision
•
Information Available in Element Icons
•
Viewing the Properties of a Network Element
•
Checking VNE Connectivity and Communication Status
•
Viewing the Physical Properties of a Device
•
Viewing the Logical Properties of a Network Element
•
Viewing Device Operating System Information
•
Running an Activation from the Activation Menu
Note
Prime Network Vision maintains continuous, real-time discovery of all the physical and logical entities of the network inventory and the relationships among them. The Prime Network Vision distributed system inventory automatically reflects every addition, deletion, and modification that occurs in the network.
User Roles Required to Work with Prime Network Vision
This topic identifies the roles that are required to work with Prime Network Vision. Prime Network determines whether you are authorized to perform a task as follows:
•
For GUI-based tasks (tasks that do not affect elements), authorization is based on the default permission that is assigned to your user account.
•
For element-based tasks (tasks that do affect elements), authorization is based on the default permission that is assigned to your account. That is, whether the element is in one of your assigned scopes and whether you meet the minimum security level for that scope.
For more information on user authorization, see the Cisco Prime Network 3.10 Administrator Guide.
The following tables identify the tasks that you can perform:
•
Table 3-1 identifies the tasks that you can perform if a selected element is not in one of your assigned scopes.
•
Table 3-2 identifies the tasks that you can perform if a selected element is in one of your assigned scopes.
By default, users with the Administrator role have access to all managed elements. To change the Administrator user scope, see the topic on device scopes in the Cisco Prime Network 3.10 Administrator Guide.
Table 3-1 Default Permission/Security Level Required for Prime Network Vision Functions - Element Not in User's Scope
View maps
X
X
X
X
X
View network element properties
—
—
—
—
X
View network element properties in logical and physical inventory
—
—
—
—
X
View port status and properties
—
—
—
—
X
View VNE properties
—
—
—
—
X
Open the Port Utilization Graph
—
—
—
—
X
Enable and disable port alarms
—
—
—
—
X1
View tickets in inventory window
—
—
—
—
X
View network events in inventory window
—
—
—
—
X
View provisioning events in inventory window
—
—
—
—
X
Create activation wizards
—
—
—
—
—
Preview and perform activations and deactivations
—
—
—
—
—
View activation details and output
—
—
—
—
X
Search for activations
—
—
—
—
X
Table 3-2 Default Permission/Security Level Required for Prime Network Vision Functions - Element in User's Scope
View maps
X
X
X
X
X
View network element properties
X
X
X
X
X
View network element properties in logical and physical inventory
X
X
X
X
X
View port status and properties
—
X
X
X
X
View VNE properties
X
X
X
X
X
Open the Port Utilization Graph
X
X
X
X
X
Enable and disable port alarms
—
—
—
X1
X1
View tickets in inventory window
X
X
X
X
X
View network events in inventory window
X
X
X
X
X
View provisioning events in inventory window
X
X
X
X
X
Create activation wizards
—
X
X
X
X
Preview and perform activations and deactivations
—
—
—
X
X
View activation details and output
X
X
X
X
X
Search for activations
—
X
X
X
X
1 To enable and disable port alarms on a device, the Administrator scope level must also be configured for that device.
Information Available in Element Icons
Element icons in Prime Network Vision maps display different amounts of information according to their size as shown in Table 2-2. Table 3-3 identifies the information that is available for different types of elements for the four icons sizes.
Viewing the Properties of a Network Element
You can view the general information about a selected network element in the Prime Network Vision map view and view more detailed information by viewing the Properties window for the selected element.
Step 1
To view general information about a network element, hover your mouse cursor over the NE icon, and use the mouse scroll to zoom in and out.
Step 2
For more detail, open the Properties (inventory) window, double-click the icon.
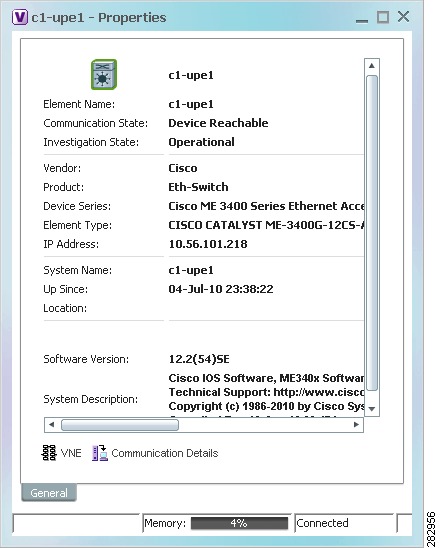
Depending on your selection, either the Properties window or inventory window is displayed with the inventory window providing slightly more information than the Properties window. Figure 3-1 shows the Properties window.
Figure 3-1 Properties Window
Table 3-4 describes the information displayed in both the Properties and inventory windows.
Table 3-4 Properties and Inventory Windows
Element icon
Icon representing the element in Prime Network Vision and displaying the current color associated with the element operational health. For more information on severity colors, see Prime Network Vision Status Indicators.
The icon might include a badge that indicates an alarm or another item of interest associated with the element. For more information about badges, see Network Element Badges.
Element Name
Name assigned to the element for ease of identification.
Communication State
Ability of the VNE to reach the network element, according to the health of the element. For more information about communication states, see the Cisco Prime Network 3.10 Administrator Guide.
Investigation State
Level of network element discovery that has been performed or is being performed by the VNE. For more information about investigation states, see the Cisco Prime Network 3.10 Administrator Guide.
Vendor
Vendor name, as defined in the device MIB.
Product
Product name of the element, as defined in the device MIB; for example, Router.
Device Series
Product series that the device belongs to, such as Cisco 7600 Series Routers.
Element Type
Element model, such as Cisco 7606.
Serial Number1
Serial number of the element.
CPU Usage1
Percentage of CPU currently in use by the element.
Memory Usage1
Amount of memory currently in use by the element.
IP Address
IP address used for managing the element.
System Name
Name of the device, as defined in the device MIB.
Up Since
Date and time the element was last reset.
Contact
Email address of the person responsible for the element.
Location
Physical location of the element, as defined in the device MIB.
DRAM Usage1
Percentage of available DRAM currently in use by the element.
Flash Device Size1
Amount of flash memory available on the element.
NVRAM Size1
Amount of NVRAM available on the element.
Software Version
Software version running on the element.
Software Description
Description of the system taken from the element.
Processor DRAM1
Amount of DRAM currently in use by the element's processor.
Sending Alarms1
Whether or not the element is configured for sending alarms: True or False.
VNE Details
Displays the VNE's general properties, from where you can edit the VNE's properties, perform maintenance, configure polling rates, and identify IP addresses for which SNMP syslog and trap events are to be generated. For more information, see:
•
VNE Properties Window (VNE Status Button in the content pane of the Inventory Window)
VNE Status
Displays details about the VNE's communication and connectivity, such as the status of device protocols and whether the device is sending traps and syslogs. For more information, see VNE Communication Status (VNE Details Button in the content pane of the Inventory Window).
1 Displayed only in the inventory window.
Network Element Badges
Network elements and links can also display badges that are technology-specific, such as a Protected LSP or an STP root. Table 3-5 describes some of the badges that are available in Prime Network Vision. For more information, see the related topics.
Table 3-5 Network Element Badges
Access gateway
An MST or REP access gateway is associated with the element.
Blocking
The element associated with this badge has a REP alternate port.
Viewing REP Information in VLAN Domain Views and VLAN Overlays
Clock service
A clocking service is running on the associated element.
Lock
The associated network LSP is in lockout state.
Multiple links
One or more links is represented by the visual link and at least one of the links contains a badge.
Viewing REP Information in VLAN Domain Views and VLAN Overlays
Reconciliation
The element with this badge is associated with a network element that does not exist. For example, the device configuration has changed and a network problem exists.
Some elements can be deleted only if their components, such as EFPs, VPLS forwards, or VRFs, display the reconciliation icon.
REP primary blocking
The element associated with this badge has a REP primary port that is also blocking.
Viewing REP Information in VLAN Domain Views and VLAN Overlays
REP primary
The element associated with this badge has a REP primary port.
Viewing REP Information in VLAN Domain Views and VLAN Overlays
Redundancy service
The element associated with this badge is a backup pseudowire or a protected LSP.
STP root
The element associated with this badge is a STP root bridge or the root of an STP tree.
Viewing STP Information in VLAN Domain Views and VLAN Overlays
The Inventory Window
Table 3-6 describes the tasks that you can perform from the inventory window and related topics.
Table 3-6 Tasks Available from Inventory and Related Topics
Add or remove links.
Generate the Port Utilization graph for physical ports.
Manage the alarms being sent on a port.
Open Cisco PathTracer and launch a path trace.
Open the Prime Network Command Builder to create customized commands.
Open the Prime Network Soft Properties Manager to extend the amount of information displayed.
Check VNE properties and communication status when inventory is incomplete or missing
View physical and logical inventory information.
•
Viewing the Physical Properties of a Device
View tickets or events for a device, service, or component.
The inventory window also allows you to view technology-specific information. For more information on viewing technology-specific information in logical inventory or physical inventory, see:
•
Chapter 13 "Monitoring Carrier Ethernet Services"
•
Chapter 14 "Monitoring Carrier Grade NAT Properties"
•
Chapter 15 "Monitoring DWDM Properties"
•
Chapter 16, "Monitoring Ethernet Operations, Administration, and Maintenance Tool Properties"
•
Chapter 17 "Monitoring Y.1731 IPSLA Configuration"
•
Chapter 18 "IPv6 and IPv6 VPN over MPLS"
•
Chapter 19 "Monitoring MPLS Services"
•
Chapter 20 "Viewing IP and MPLS Multicast Configurations"
•
Chapter 21 "Monitoring MToP Services"
•
Chapter 22 "Viewing and Managing SBCs"
•
Chapter 23 "Monitoring AAA Configurations"
•
Chapter 24 "Monitoring IP Pools"
•
Chapter 25 "Monitoring BNG Configurations"
•
Chapter 26 "Monitoring Mobile Technologies"
•
Chapter 27 "Monitoring Data Center Configurations"
To open the inventory window, do one of the following:
•
If the element icon is at the largest size, click the Inventory icon.
•
Double-click an item in the navigation pane or map.
•
Right-click an element in the navigation pane or map and choose Inventory.
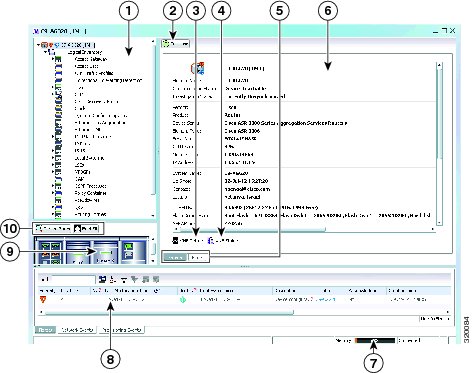
Figure 3-2 shows an example of an inventory window.
Figure 3-2 Inventory Window
Navigation pane
Content pane
Poll Now button (see Performing a Manual Device Poll)
Status bar
VNE Details button (see VNE Properties Window (VNE Status Button in the content pane of the Inventory Window))
Ticket and events pane
VNE Status button (see VNE Communication Status (VNE Details Button in the content pane of the Inventory Window))
Device view pane
Content pane tabs
Device view pane toolbar
The inventory window displays the physical and logical inventory for the selected item. For more information about the options in the inventory window, see:
•
Checking VNE Connectivity and Communication Status
All areas displayed in the inventory window are correlated; this means that selecting an option in one area affects the information displayed in the other areas.
The information displayed in the inventory window varies according to the item selected in the navigation pane.
To view logical inventory information, expand the Logical Inventory branch. For more information about logical inventory information, see Viewing the Logical Properties of a Network Element.
To view physical inventory information, expand the Physical Inventory branch. For more information about physical inventory information, see Viewing the Physical Properties of a Device.
Click Poll Now to update the display with the current VNE information.
Click the top right corner to close the inventory window.
Navigation Pane
The navigation pane in the inventory window displays a tree-and-branch representation of the selected device and its modules. The navigation pane contains two main branches:
•
Logical Inventory—Includes logical items related to the selected element, such as access lists, ATM traffic profiles, and routing entities.
•
Physical Inventory—Includes the various device components, such as chassis, satellite, cards, subslots, and so on.
When you select an item in the navigation pane, the information displayed in the content pane is updated. You can expand and collapse the branches in the navigation pane to display and hide information as needed.
The window heading and the highest level in the navigation pane display the name of the VNE given to the element as defined in Cisco Prime Network Administration. The element icon and status are displayed at the top of the navigation and content panes.
The color of the element icon reflects the element operational status. For more information about indicators of operational health and status, see:
•
Prime Network Vision Status Indicators
Status Indicators
A status indicator icon appears next to the element icon for any unacknowledged tickets associated with the element. In addition, status indicator icons are displayed next to the specific logical or physical inventory branches that are associated with the ticket.
If you click a branch in the navigation pane that contains a status icon, the associated tickets and events are displayed in the tickets and events pane at the bottom of the inventory window.
Communication and Investigation State Icons
The navigation pane can also display a communication or investigation state icon next to the element icon in the navigation and content panes.
For more information about communication and investigation state icons, see VNE Management State.
Content Pane
The content pane contains two tabs:
•
General—Contains physical or logical information specific to the item you select in the navigation pane or device view panel; for example, information about pseudowires or the chassis.
The General tab can also display context-sensitive tabs and buttons; the buttons displayed depend on your selection in the navigation pane or device view panel. For example, if an ATM port is selected, the Show VC Table, Show Cross-Connect, or Show Encapsulation button might be displayed.
•
Ports—Lists all ports on the device with their current alarm status, location, and other properties, and enables you to change their status by using a right-click menu. For more information, see Working with Ports.
The content pane can also display context-sensitive tabs and buttons; the buttons displayed depend on your selection in the navigation pane or device view panel. For example, if an ATM port is selected, the Show VC Table, Show Cross-Connect, or Show Encapsulation button might be displayed.
In addition, you can view the properties of a row in a table by double-clicking the row or by right-clicking the row and choosing Properties.
For information about tables that appear in the content pane, see Filtering and Sorting Tabular Content.
Device View Pane
The device view pane enables you to visually locate elements in the chassis and identify their status. All occupied slots in the chassis are rendered in the device view pane. If a port is down, it is shown in red in both the navigation pane and the device view pane, allowing you to quickly pinpoint the problem.
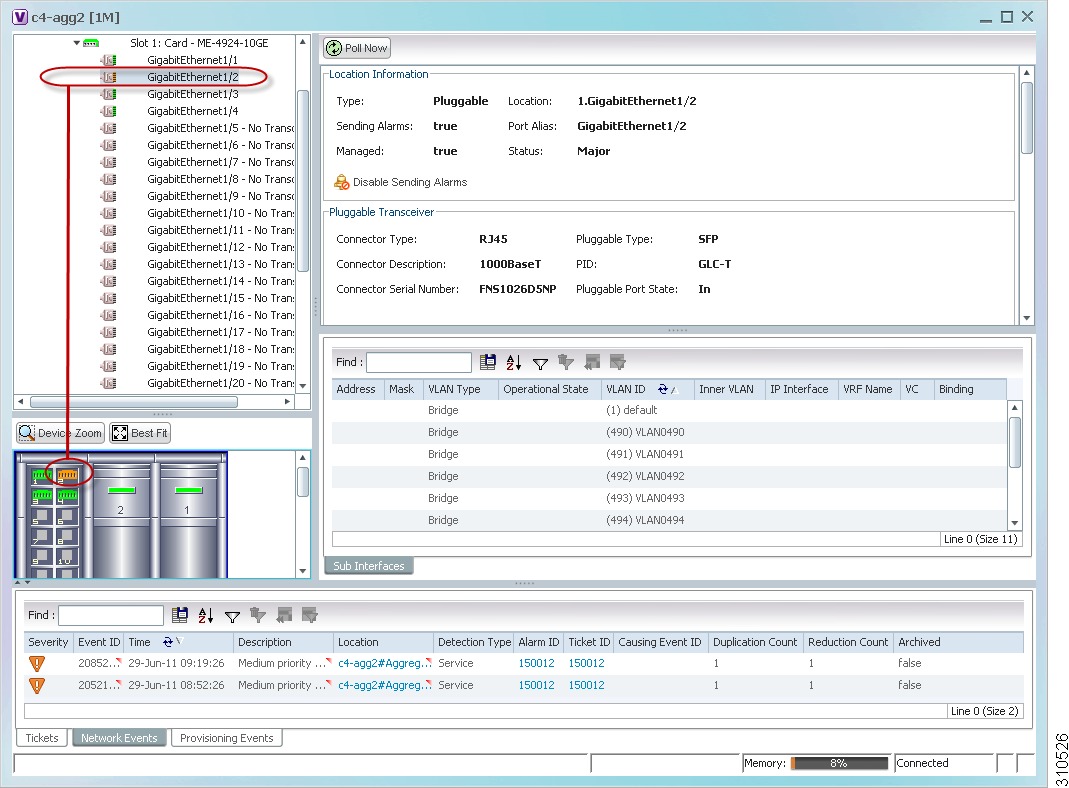
Figure 3-3 provides an example of the device view pane for a Cisco device. The circled slot in the device view pane corresponds to the circled slot in the physical inventory navigation pane. If you click a port in the device view pane (see the circled port), Prime Network Vision displays both the properties of the element and its location in the navigation pane and content pane.
Figure 3-3 Device View Pane
Device View Pane Toolbar
The following tools for working with the device view pane:
Ticket and Events Pane
The ticket and events pane is displayed at the bottom of the inventory window and contains the following tabs:
•
Tickets—Displays the tickets that are collected on the selected element, service, or component in the navigation pane.
Table 10-3 describes the information that is available in the Tickets tab.
•
Network Events—Displays all active network events associated with tickets and alarms, and all archived events with a timestamp that falls within the specified events history size (see Adjusting the Prime Network Vision GUI Client Settings).
Table 3-7 describes the information that is available in the Network Events tab.
•
Provisioning Events—Available to users with the Configurator role or higher for the selected element. This tab displays provisioning events with their source in the selected element and with a timestamp that falls within the specified events history size (see Adjusting the Prime Network Vision GUI Client Settings).
All activations that occur are also included in this tab.
Table 9-4 describes the information that is available in the Provisioning Events tab.
Note
Provisioning events that are caused by workflows (AVM 66) are not displayed in this table even if the element is affected by the workflow.
When displaying network and provisioning events, Prime Network Vision monitors the history size value defined in the Events tab of the Options dialog box (Tools > Options > Events). The default value is six hours and can be changed in Prime Network Administration. In addition, Prime Network Vision limits the maximum number of network and provisioning events that are sent from the server to client to 15,000 each. If the number of network or provisioning events exceeds the limit specified in the Options Events tab or the 15,000 maximum limit, Prime Network Vision purges the oldest events from table. The purging mechanism runs once per minute.
Tip
You can display or hide the ticket and events pane by clicking the arrows displayed below the device view panel.
Checking VNE Connectivity and Communication Status
Virtual Network Elements (VNEs) are the Prime Network entities that simulate managed devices. Each VNE is assigned to manage a single network element instance and is designated by the NE name and IP address.
VNEs are created using the Prime Network Administration GUI client. After a VNE is created and started, Prime Network investigates the network element and automatically builds a live model of it including its physical and logical inventory, configuration, and status. As different VNEs build their model, a complete model of the network is created.
For the most part, VNE operations are hidden from Prime Network Vision GUI client users because those users are interested in devices, not these back-end processes. But VNEs must have connectivity to a device in order to maintain the NE model. To provide connectivity and polling information, you can view VNE properties from the device inventory:
•
VNE Status to view the VNE Properties window. This window provides details such as the VNE's protocol and polling settings and other configuration information. See VNE Properties Window (VNE Status Button in the content pane of the Inventory Window).
•
VNE Details to view more details about device and VNE connectivity. See VNE Communication Status (VNE Details Button in the content pane of the Inventory Window).
VNE Properties Window (VNE Status Button in the content pane of the Inventory Window)
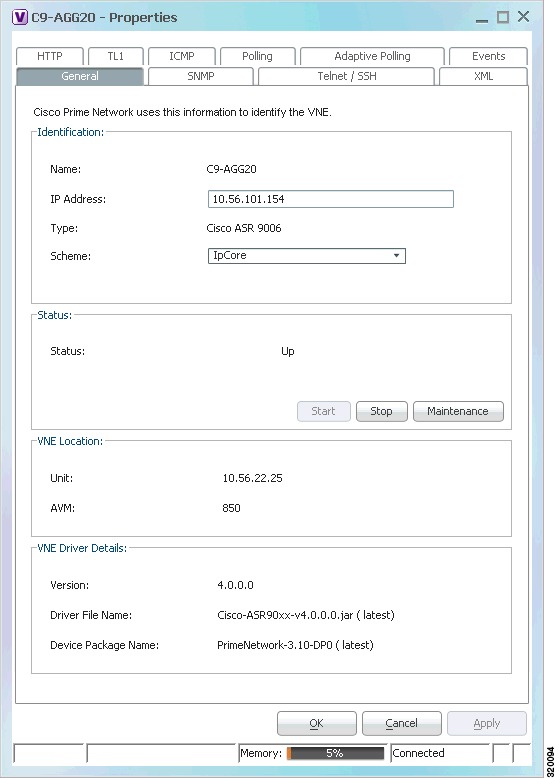
Figure 3-4 provides an example of a VNE properties window. This VNE is modeling a Cisco 3620 router.
Figure 3-4 VNE Properties Window
Note
VNE status is not the same as device status. A device may be fully reachable and operating even though the VNE status is Down, Unreachable, or Disconnected.
The Cisco Prime Network 3.10 Administrator Guide describes these properties in detail, but for a Prime Network Vision GUI Client user, probably the most important information is the VNE status.
VNE Communication Status (VNE Details Button in the content pane of the Inventory Window)
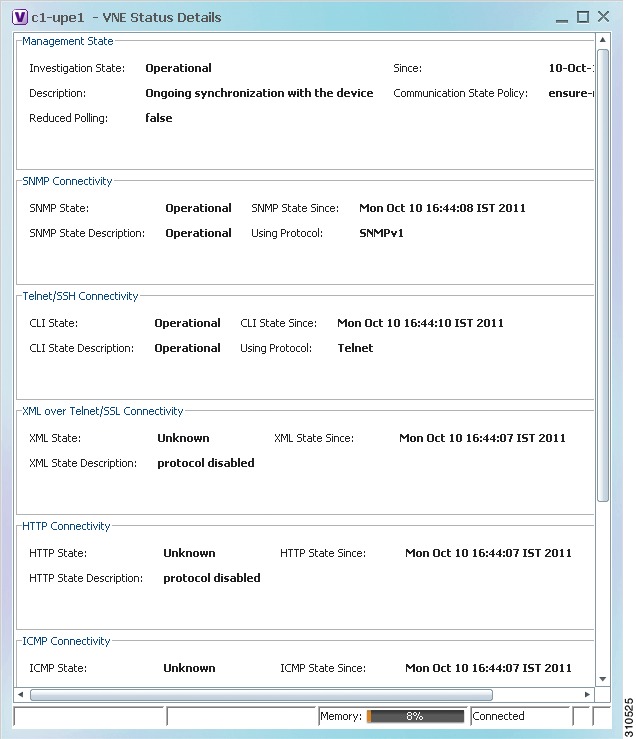
Figure 3-5 provides an example of a VNE Status Details window for a different VNE. This window provides information about the VNE and device connectivity.
Figure 3-5 VNE Status Details Window
The VNE Status Details window provides this information about the VNE:
•
Its management connectivity state, which has to do with how the VNE was configured
•
The protocols the VNE is using to communicate with the device and the status of each
•
Whether the device is generating syslogs or traps
In the Management State area, if the Reduced Polling field is true and the Investigation State is Currently Unsychronized, refer to the information in the topic Performing a Manual Device Poll.
This information can be useful to users who are troubleshooting device problems. For more information about the VNE Status Details window, see the Cisco Prime Network 3.10 Administrator Guide.
Performing a Manual Device Poll
The VNE settings determine how often a VNE polls a device to update its model. Some VNEs use the reduced polling (also called event-based polling) mechanism. A reduced polling VNE polls the device when a configuration change syslog is received and immediately updates the VNE information accordingly. In other words, updates are driven by incoming events.
The risk with reduced polling is dropped events. But if an event is dropped, the network element shows a Currently Unsynchronized investigation state. If you notice this VNE state, initiate polling by right-clicking the element and choosing VNE Tools > Poll Now.
For more information about reduced polling, see the Cisco Prime Network 3.10 Administrator Guide.
Viewing the Physical Properties of a Device
Each device that is managed by Prime Network is modeled in the same manner. The physical inventory reflects the physical components of the managed network element, as shown in Table 3-8.
Table 3-8 Physical Inventory Icons
Chassis
Satellite
Shelf
Card/Subcard
Port/Logical Port
Pluggable Transceiver
Unmanaged Port
Physical inventory is continuously updated for both status and configuration. The addition of a new card, the removal of a card, or any change to the device is reflected by the VNE and updated instantly.
If you physically remove an item that Prime Network Vision is managing, the following changes occur in physical inventory, depending on the item removed:
•
Removing an item other than a pluggable transceiver results in the following changes:
–
The color of the icon in physical inventory changes to black.
–
The item's status changes to Out.
The other properties of the removed item reflect the most recent value that was updated from the device with the following exceptions:
–
Cards—If the card was participating in a card redundancy configuration, the redundancy state changes to None.
–
Port—The operational status of the port changes to Down.
•
Removing a pluggable transceiver results in the following changes:
–
The color of the pluggable transceiver icon changes to gray.
–
The pluggable transceiver status changes to Disabled.
–
In the Pluggable Transceiver panel:
— The properties are no longer displayed.
— The connector type changes to Unknown.
— The pluggable port state changes to Out.
Fans and power supplies are displayed in physical inventory if they are field replacable units (FRUs). The manner in which the fans are displayed depends on whether the fans can be separated or not:
•
If the fans under the fan trays are inseparable, only the fan trays are represented.
•
If the fans under the fan trays can be separated, they are shown as separate items in physical inventory.
The window displayed for all the devices is similar in appearance. However, the individual sections that are displayed depends on the selected item. For example, when a port that supports pluggable transceivers is selected, the Pluggable Transceiver section is displayed. This section provides information such as the port connector's type and serial number, as well as an indication whether a transceiver is currently plugged in.
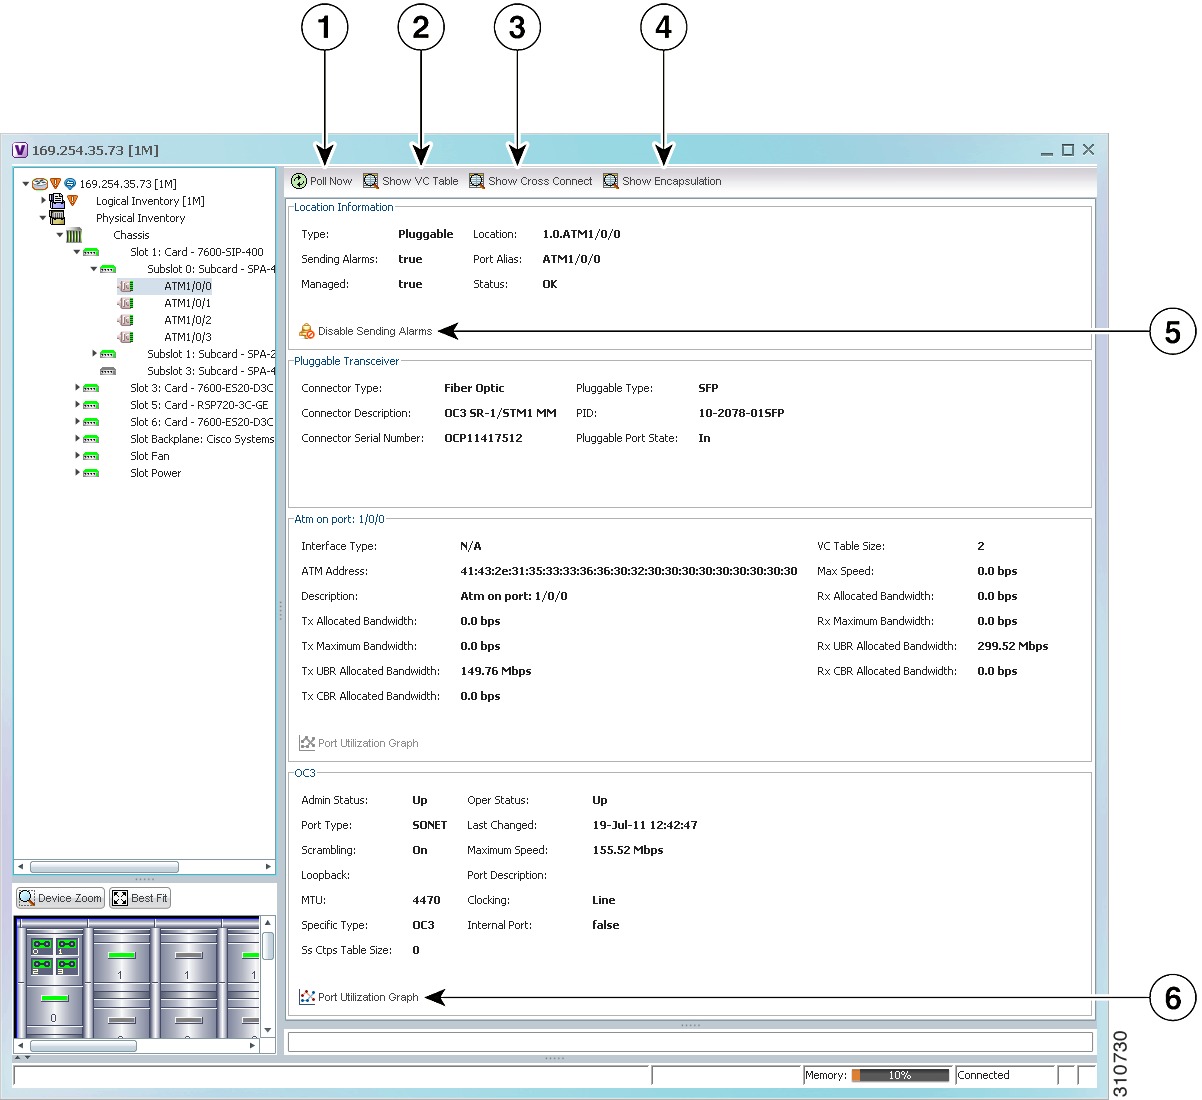
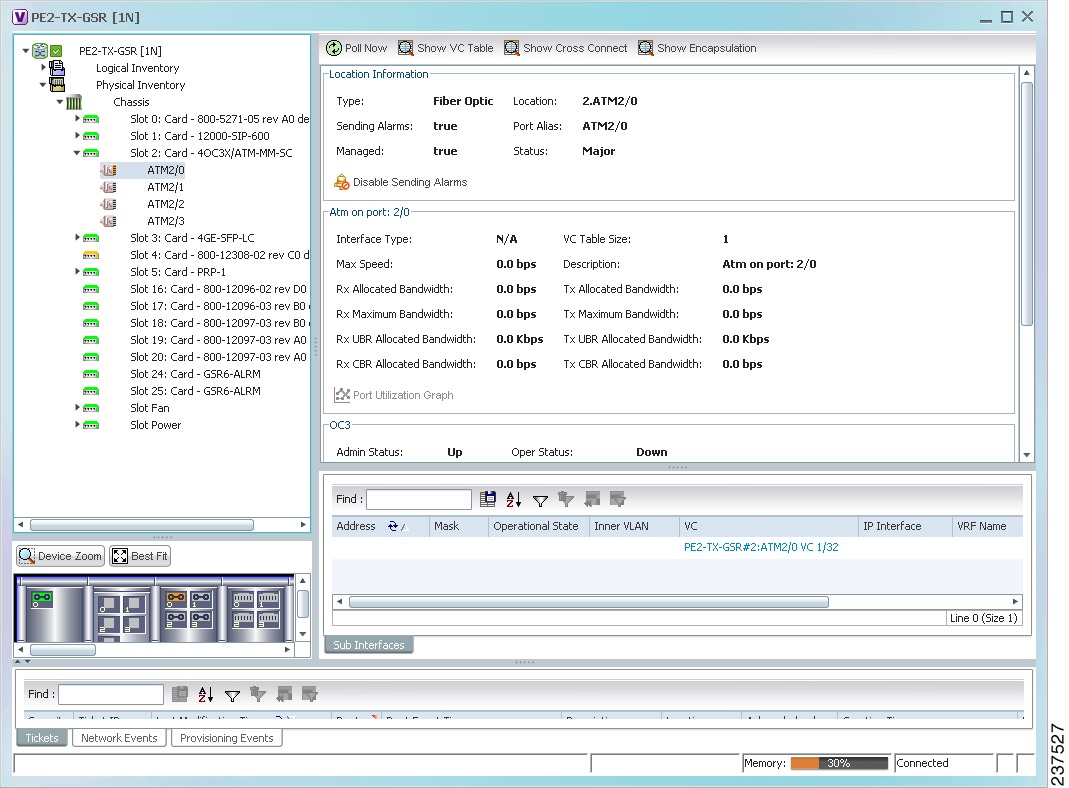
Figure 3-6 shows an example of a selection in physical inventory and the available buttons.
Figure 3-6 Physical Inventory Example
Poll Now button
Poll the VNE and update the information as needed.
For more information, see Performing a Manual Device Poll.
Show VC Table button
Displays virtual circuit (VC) information for the selected port.
For more information, see Viewing ATM VPI and VCI Properties.
Show Cross Connect button
Displays cross-connect information for incoming and outgoing ports.
For more information, see Viewing ATM Virtual Connection Cross-Connects.
Show Encapsulation button
Displays encapsulation information for incoming and outgoing traffic for the selected item.
For more information, see Viewing Encapsulation Information.
Disable Sending Alarms button
Enables you to manage the alarms on a port.
For more information, see Working with Ports.
Port Utilization Graph button
Displays the selected port traffic statistics: Rx/Tx Rate and Rx/Tx Rate History.
For more information, see Generating the Port Utilization Graph.
Show DLCI Table button
(not displayed)Displays data-link connection identifier (DCLI) information for the selected port.
The buttons that are displayed in the physical inventory content pane depend on the selected port.
For information about configuring topology from a port, see Adding Static Links.
For a detailed description of device properties, see Viewing the Properties of a Network Element.
Redundancy Support
In Prime Network, redundancy is modeled as part of the physical inventory. You can view the redundancy parameters including the following:
•
Redundancy Configured—Indicates whether redundancy is configured for the Route Switch Processor (RSP) or Route Processor (RP) card. This parameter displays "Working" if redundancy is configured and "None" if it is not configured.
•
Redundancy Status—Indicates the redundancy status of the RSP or RP card, which can be Active or Standby Mode.
•
Redundancy Type—The type of redundancy, which can be Stateful or Stateless. This parameter is available only for Cisco ASR9000 and Cisco ASR903 series routers.
•
Redundancy Info—Provides information about the redundancy technology that is configured. For example, Nonstop Routing (NSR), Stateful Switchover (SSO), or Route Processor Redundancy (RPR). This parameter is available only for Cisco ASR9000 and Cisco ASR903 series routers.
Note
If SSO is configured, then the Redundancy type will be Stateful. If RPR is configured, then the Redundancy Type will be Stateless.
Viewing Satellite Properties
Prime Network provides satellite support for Cisco Aggregation Service Router (ASR) 9000 series network elements. Satellites are used to enhance performance bandwidth of Cisco ASR 9000 network elements. Each satellite is modeled as a chassis in the physical inventory.
To view the satellite properties:
Step 1
In Cisco Prime Network Vision, double-click the required device.
Step 2
In the Inventory window, choose Physical Inventory > Satellite. Satellite is modeled as a type of chassis in the physical inventory.
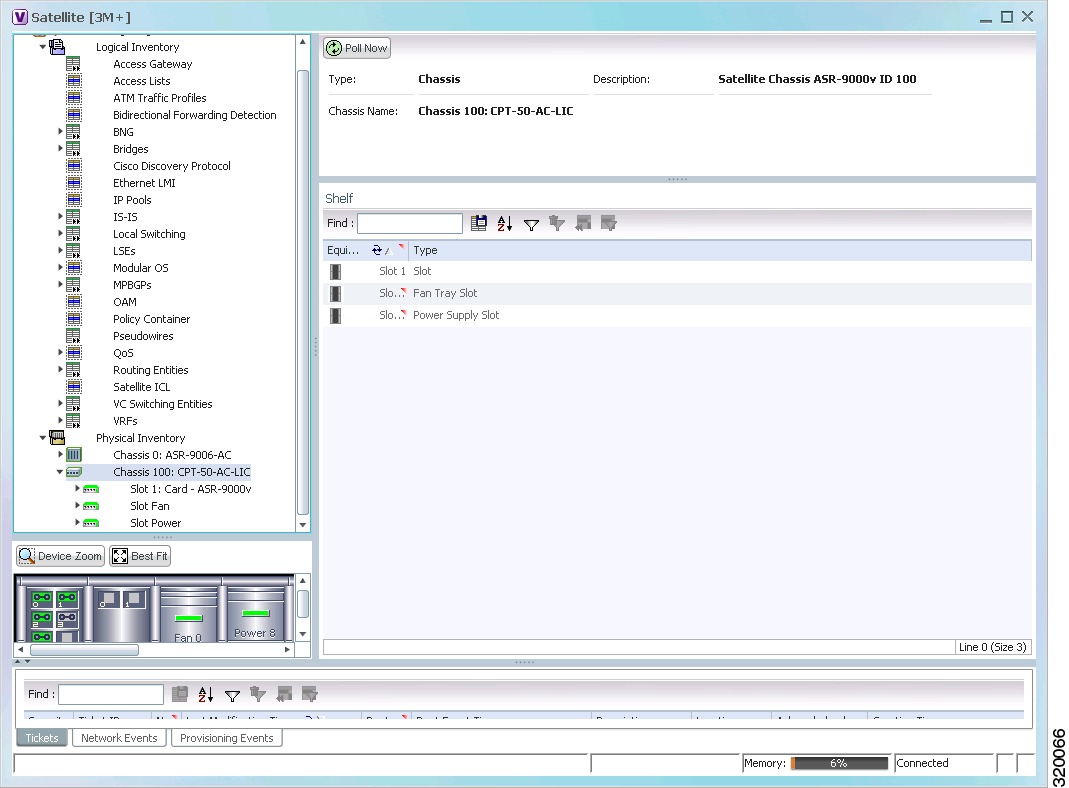
Figure 3-7 shows an example of the information (including the slots) displayed when a satellite is selected in the physical inventory branch of the inventory window.
Figure 3-7 Satellite Properties
One or more satellites are connected to the host Cisco ASR 9000 series network element by using the physical ethernet links, which also act as inter-chassis links (ICLs) for connecting the satellites with the other chassis or satellites within the host.
To view the satellite ICLs, choose the Satellite ICL container in the logical inventory of the device. The content pane displays a list of satellite ICLs with the following details.
Working with Ports
The following topics describe some of the options available for working with ports:
•
Viewing Port Status and Properties
•
Disabling and Enabling Alarms
•
Generating the Port Utilization Graph
Viewing Port Status and Properties
Prime Network Vision displays all ports on a device in the Ports tab in the inventory window.
This information is available to users with an Operator or higher role on the selected device. Users with a Configurator or higher role can modify the status of a single port or a selected group of ports as described in the following sections:
•
Disabling and Enabling Alarms
•
Generating the Port Utilization Graph
You can export the port list from Prime Network Vision by using the Export to CSV option in the toolbar.
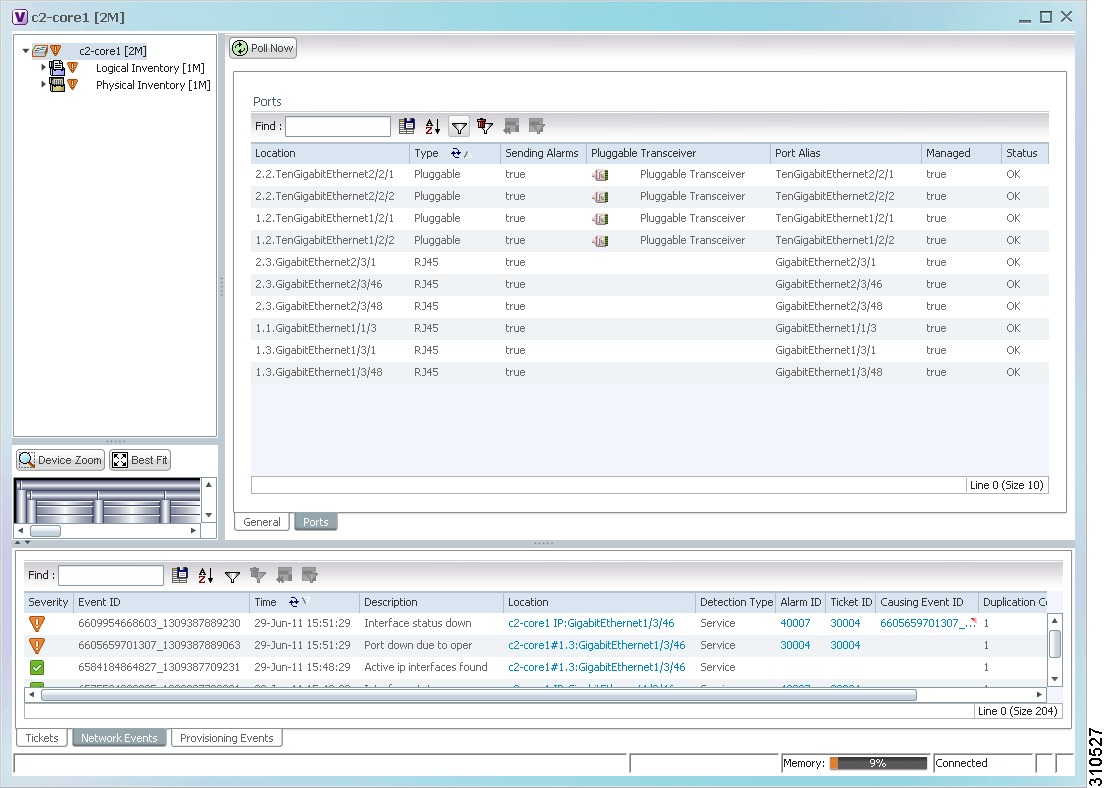
Figure 3-8 shows an example of the Ports tab in the inventory window.
Figure 3-8 Ports Tab in the Inventory Window
Table 3-10 describes the information that is displayed in the Ports tab.
Viewing a Port Configuration
In addition to viewing logical inventory information from the logical inventory branch, you can view services provisioned on physical ports by clicking a physical port in the physical inventory branch. Information that is displayed includes:
•
Physical layer information.
•
Layer 2 information, such as ATM and Ethernet.
•
Subinterfaces used by a VRF.
To view a port's configuration:
Step 1
In Cisco Prime Network Vision, double-click the required device.
Step 2
In the inventory window, choose Physical Inventory > Chassis > Slot > Subslot > Port.
Figure 3-9 shows an example of the information (including the subinterfaces) displayed when a port is selected in the physical inventory branch of the inventory window.
Figure 3-9 Port Information in the Inventory Window
The subinterface is a logical interface defined in the device; all of its parameters can be part of its configuration. Table 3-11 describes the information that can be displayed in the Subinterfaces table. Not all fields appear in all Subinterfaces tables.
Table 3-11 Subinterfaces Table
Address
IP address defined in the subinterface.
Mask
Subnet mask.
VLAN Type
Type of VLAN, such as Bridge or IEEE 802.1Q.
Double-click the entry to view the Port IP VLAN Properties window containing:
•
VLAN type
•
VLAN identifier
•
Operational status
•
A brief description of the VLAN
Operational State
Operational state of the subinterface.
VLAN ID
VLAN identifier.
Inner VLAN
CE-VLAN identifier.
IP Interface
IP interface, hyperlinked to the VRF properties in the inventory window.
VRF Name
Name of the VRF.
Is MPLS
Whether this is an MPLS interface: True or False.
VC
Virtual connection (VC) configured on the interface, hyperlinked to the VC Table window.
For more information about VC properties, see Viewing ATM Virtual Connection Cross-Connects.
Tunnel Edge
Hyperlinked entry to the specific tunnel edge in logical inventory.
Binding
Hyperlinked entry to the specific bridge or pseudowire in logical inventory.
Disabling and Enabling Alarms
By default, alarms are enabled on all ports. When the alarms are disabled on a port, no alarms are generated for the port and they are not displayed in the ticket and events pane.
To disable alarms on ports:
Step 1
Open the inventory window for the required device.
Step 2
To disable alarms on individual ports, right-click the port and choose Disable Sending Alarms.
The Sending Alarms field displays the value false, indicating that the alarm for the required port has been disabled, and the content pane displays the Enable Sending Alarms button.
Step 3
To disable alarms on one or more ports at the same time:
a.
In the inventory window, click the Ports tab.
b.
In the Ports table, select the required ports. You can select multiple ports by using the Ctrl and Shift keys.
c.
Right-click one of the selected ports, and choose Disable Sending Alarms. In response, the Sending Alarms field displays the value false for the selected ports.
To enable alarms, use the previous procedure but choose Enable Sending Alarms.
Generating the Port Utilization Graph
Prime Network Vision enables you to view the Rx/Tx Rate and Rx/Tx Rate History of a port.
Note
Port utilization graphs are for physical ports only. Port utilization graphs are not available for ATM, E1/T1, or ATM IMA interfaces that are included in an IMA group.
To view port utilization statistics:
Step 1
Open the inventory window and select the required port in physical inventory.
Step 2
In the Ethernet CSMA/CD section, click Port Utilization Graph.
The following information is displayed in the Port Statistics dialog box:
•
Rx Rate—The reception rate as a percentage.
•
Rx Rate History—The reception rate history is displayed as a graph.
•
Tx Rate—The transmission rate as a percentage.
•
Tx Rate History—The transmission rate history is displayed as a graph.
Step 3
Click
to close the Port Statistics dialog box.
Viewing the Logical Properties of a Network Element
Prime Network Vision enables you to view logical inventory information. Prime Network Vision maintains logical inventory for each network element. The logical inventory reflects dynamic data such as configuration data, forwarding, and service-related components that affect traffic handling in the element.
The information displayed in the inventory window changes according to the type of element and branch selected in the navigation pane.
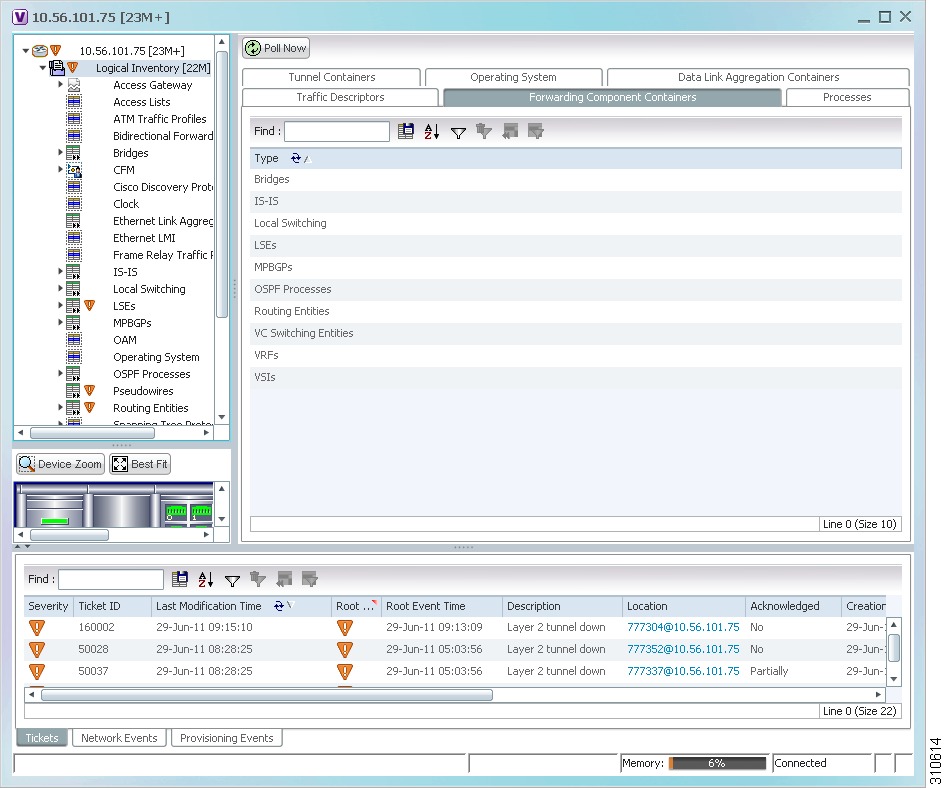
Logical Inventory Window
Logical inventory information is displayed in the inventory window as shown in Figure 3-10.
Figure 3-10 Logical Inventory Information Displayed in the Inventory Window
Note
For more information about opening the inventory window, see The Inventory Window.
Logical Inventory Navigation Pane Branches
Table 3-12 describes the branches that appear in the logical inventory navigation pane.
Logical Inventory Navigation Pane Icons
Each branch in the logical inventory navigation pane is represented by an icon and, if appropriate, includes an icon indicating the status.
Table A-3 describes the icons used in the logical inventory navigation pane.
Logical Inventory Content Pane Tabs
Table 3-13 describes the tabs that are displayed in the logical inventory content pane when you select Logical Inventory, depending on the device configuration.
Note
Prime Network Vision does not display the tabs in Table 3-13 for devices that support multiple contexts. Instead, when you select Logical Inventory for a device that contains multiple contexts, Prime Network Vision displays a Contexts table that lists the contexts configured on the device.
Viewing Device Operating System Information
Prime Network Vision discovers and automatically displays operating system information for Cisco IOS, Cisco IOS XR, and Cisco IOS XE devices in logical inventory. For other devices, choose the element name at the top of the inventory window navigation pane.
To view operating system information for Cisco IOS, Cisco IOS XR, or Cisco IOS XE devices:
Step 1
In Prime Network Vision, double-click the required device.
Step 2
For a Cisco IOS device, view information about the operating system by clicking Logical Inventory and choose the Operating System tab. Table 3-14 describes the information that is displayed in the Operating System tab.
Step 3
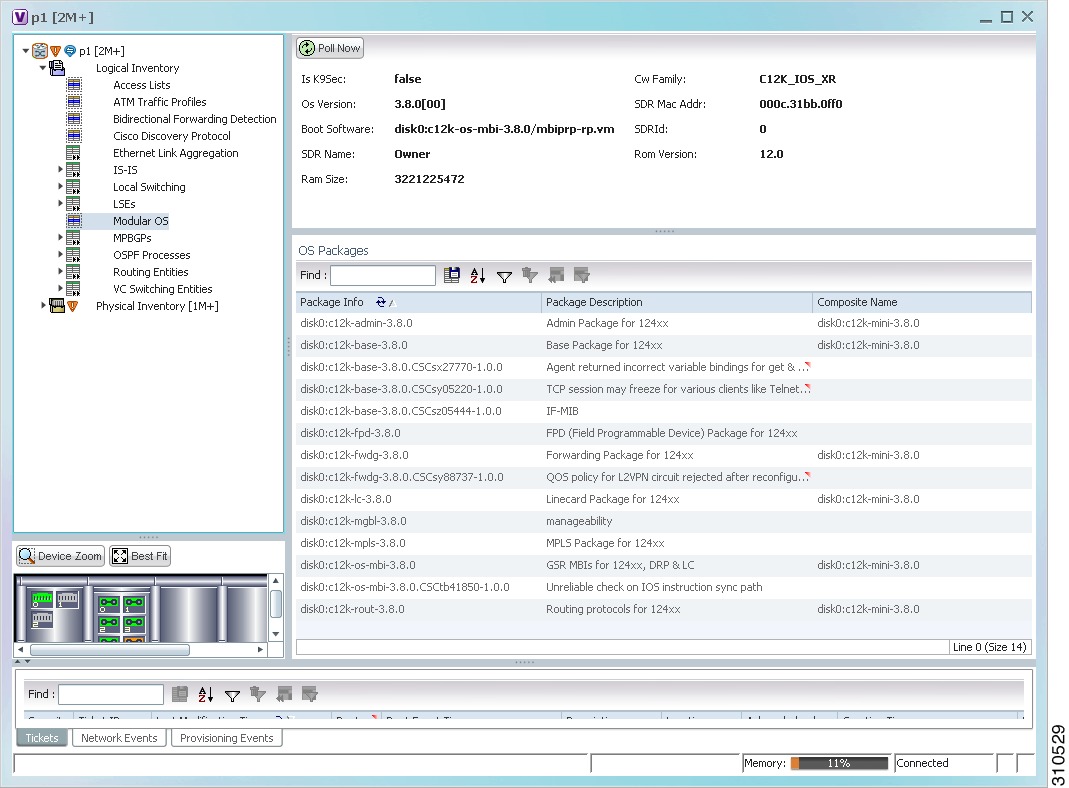
For a Cisco IOS XR device, view information about the operating system by opening the inventory window and choosing Logical Inventory > Modular OS. Figure 3-11 shows an example of the information that is displayed for Cisco IOS XR devices.
Figure 3-11 Modular OS Information in Logical Inventory
Table 3-15 describes the information that is displayed for Cisco IOS XR system.
Table 3-16 describes the information that is displayed for modular operating systems in the Operating System tab.
Running an Activation from the Activation Menu
You can run activation wizards from the GUI client using the Activations main menu. These are wizards that have been created using the Activation Wizard Builder (AWB), which is described in the Cisco Prime Network 3.10 Customization Guide. You can only run activations on devices that are within your device scope.
These topics describe how to run activations:
•
Searching for Activations (Activation History)
•
Cloning an Existing Activation
Network Activation Window
Operators can access Activation wizards by launching them from the Activation menu in Prime Network Vision. The window is divided into the following parts.
Running Activations
Activations can be launched from the Prime Network Vision GUI client.
Note
The Cisco Developer Network (CDN) has some scripts that you can use as examples for using the framework. Other activation scripts are only available through Cisco Advanced Services.
Step 1
From the Vision main menu, choose Activation > Activation. This opens a menu that lists the activations that the user can launch, depending on their user access role.
Step 2
Expand the tree and highlight the activation wizard you want to launch, and click Next.
Step 3
Enter all of the required data. You can only run activations on devices that are within your device scope.
Step 4
Check your entries and preview your changes:
a.
Click the User Input tab and check all of the values you entered.
b.
Click the Preview Configuration tab, which displays and validates the CLI commands that will be run on the device. It also highlights any errors so that you can make corrections to your input.
Step 5
Run the activation.
Note
You might be prompted to enter your device access credentials. Once you have entered them, these credentials will be used for every subsequent activation in the same GUI client session. If you want to change the credentials, click Edit Credentials.
Step 6
View the output:
a.
Select the activation in the Activation History window, right-click and choose Show Output. The information presented in similar to the data displayed in Step 4 except it reflects the real runtime results.
–
Workflow Output—The sequence of commands that were run on the devices.
–
CLI Output—The actual CLI commands that were executed for the selected activation (for activations with an Add operation and a Done state).
b.
If you want to view the output at a later time, export the activation to a local drive by clicking Export to File. We recommend that you do not change the file type in case you seek help from a support team.
Searching for Activations (Activation History)
The Activation History window displays information about executed activations, even if the activations failed. The window displays a user-friendly search tools that allow you to locate specific activations and filter the results. A counter displays the total number of activations in the system.
Keep the following in mind when using the Activation History window:
•
Searches are case-insensitive and wild card characters are not supported.
•
Results are returned only if the utility can match attributes with data in the database.
If the search results display any empty fields, this is most likely because the search criteria was not entered correctly. If you confirm that the attributes were entered correctly and the fields are still empty, the attributes were probably not used by the activation so they were not saved in the database.
Rolling Back an Activation
Completed activations can be deactivated—that is, rolled back—to return a device to its original configuration. The rollback is a best effort; in some cases complete rollbacks may not be possible.
Before you roll back and activation, you can preview the CLI configuration sequence that will be executed before the rollback is performed.
Step 1
From the Activation menu, choose Activation History. The Activation History window displays a list of recent activation attempts.
Step 2
If necessary, search for the desired activation (see Searching for Activations (Activation History)).
Step 3
Select the activation and view its details. Activations can be rolled back if the Operation column displays Add and the State column displays Done.
Note
You can attempt a deactivation on an aborted activation to clean up partial rollbacks, but the cleanup is a best effort.
Step 4
Right-click the selected activation and choose Deactivate Preview. You should verify the information in the User Input tab and the Preview configuration tab (errors will be highlighted).
If you want to test the deactivation on a single device before performing it on all selected devices, export the preview deactivation sequence to you local drive using Export to File. Then you can copy and paste the commands to a specific device.
Step 5
Right-click the selected activation and choose Deactivate.
Step 6
On the confirmation dialog box, click Yes and Close.
Cloning an Existing Activation
Cloning is useful when you know you will have to repeat an activation in the future. The cloning process saves all of the values that you entered in the original activation. This is useful when you have to perform a deactivation, but you know it will be followed be a re-activation with the same settings.
Step 1
From the Activation menu, choose Activation.
Step 2
Select the activation that you want to clone and click Clone Activation. The Activation History window is displayed.
Step 3
Search for the specific activation deployment that contains the settings you want to clone.
Note
The search results return the search based on the activation you have selected.
Step 4
Click OK. The activation clone is created.
Deleting Activations
Users with Administrator privileges can delete activations and activation templates from the Prime Network Administrator GUI client. Executed activations are automatically purged from the Prime Network database according to the purging settings set by the administrator. For more information on the Administrator GUI client, see the Cisco Prime Network 3.10 Administrator Guide.

 Feedback
