Table Of Contents
Monitoring Y.1731 IPSLA Configuration
Y.1731 Technology - An Overview
Y.1731 Performance Management Mechanisms
User Roles Required to Work with Y.1731 Probes
Working with Y.1731 IPSLA Configurations
Viewing the Y.1731 Probe Properties
Configuring Y.1731 Probes
Configure Probe Endpoint Association
Configure Profile
Create On Demand Probe Configuration
Deassociate Profile
Delete Profile
Configure IP SLA Parameters
Delete IP SLA
Diagnosing Y.1731 Probes
Show SLA Operations Detail
Show SLA Profiles
Show IP SLA
Monitoring Y.1731 IPSLA Configuration
The following topics provide an overview of the Y.1731 technology and describe how to view and monitor Y.1731 configurations in Prime Network Vision:
•
Y.1731 Technology - An Overview
•
User Roles Required to Work with Y.1731 Probes
•
Working with Y.1731 IPSLA Configurations
Y.1731 Technology - An Overview
Y.1731 is an ITU-T recommendation that provides mechanisms for service-level Operation, Administration, and Maintenance (OAM) functionality in Ethernet networks. It covers mechanisms for Fault and Performance Management. Performance Management is the most sought-after functionality in this standard.
In Prime Network, devices that are configured using Y.1731 are detected, scanned for configurations, and monitored. A device configured using Y.1731 has probes, which are root objects or containers that hold single or multiple instances of Service Level Agreement (SLA) probes configured by the user.
In Prime Network, the Y.1731 technology is supported on the Cisco Aggregation Service Router (ASR) 9000 and Cisco Carrier Packet Transport (CPT) network elements.
Y.1731 Performance Management Mechanisms
The OAM functions for performance monitoring according to Y.1731 allow measurement of the following performance parameters.
•
Frame Loss Ratio—Expressed as a percentage. This ratio is defined as the number of frames not delivered divided by the total number of frames during a time interval.
•
Frame Delay—A one-way delay for a frame, where one-way frame delay is defined as the time elapsed since the start of transmission of the first bit of the frame by a source node until the reception of the last bit of the same frame by the destination node.
•
Frame Delay Variation—The measure of the variations in the frame delay between a pair of service frames. The service frames belong to the same CoS (Class of Service) instance on a point-to-point Ethernet (ETH) connection or multipoint ETH connectivity.
•
Throughput—The average rate of successful traffic delivery over a communication channel. Typically used under test conditions, such as out-of service tests, when there is no traffic for the tested Ethernet connection.
User Roles Required to Work with Y.1731 Probes
This topic identifies the roles that are required to work with Y.1731 probes. Prime Network determines whether you are authorized to perform a task as follows:
•
For GUI-based tasks (tasks that do not affect elements), authorization is based on the default permission that is assigned to your user account.
•
For element-based tasks (tasks that do affect elements), authorization is based on the default permission that is assigned to your account. That is, whether the element is in one of your assigned scopes and whether you meet the minimum security level for that scope.
For more information on user authorization, see the topic on device scopes in the Cisco Prime Network 3.10 Administrator Guide.
Table 17-1 Default Permission/Security Level Required for Y.1731 Probes
Task
|
Viewer
|
Operator
|
OperatorPlus
|
Configurator
|
Administrator
|
View the Y.1731 probe properties
|
X
|
X
|
X
|
X
|
X
|
Configure Y.1731 probes
|
—
|
—
|
—
|
X
|
X
|
Working with Y.1731 IPSLA Configurations
This topic contains the following sections:
•
Viewing the Y.1731 Probe Properties
•
Configuring Y.1731 Probes
•
Diagnosing Y.1731 Probes
Viewing the Y.1731 Probe Properties
To view the Y.1731 probes and their properties for a device:
Step 1
Right-click on the device and choose Inventory.
Step 2
In the Inventory window, choose Logical Inventory > Probes > Y1731 Probes. A list of Y.1731 probes is displayed in the Y.1731 Probes content pane as shown in Figure 17-1.
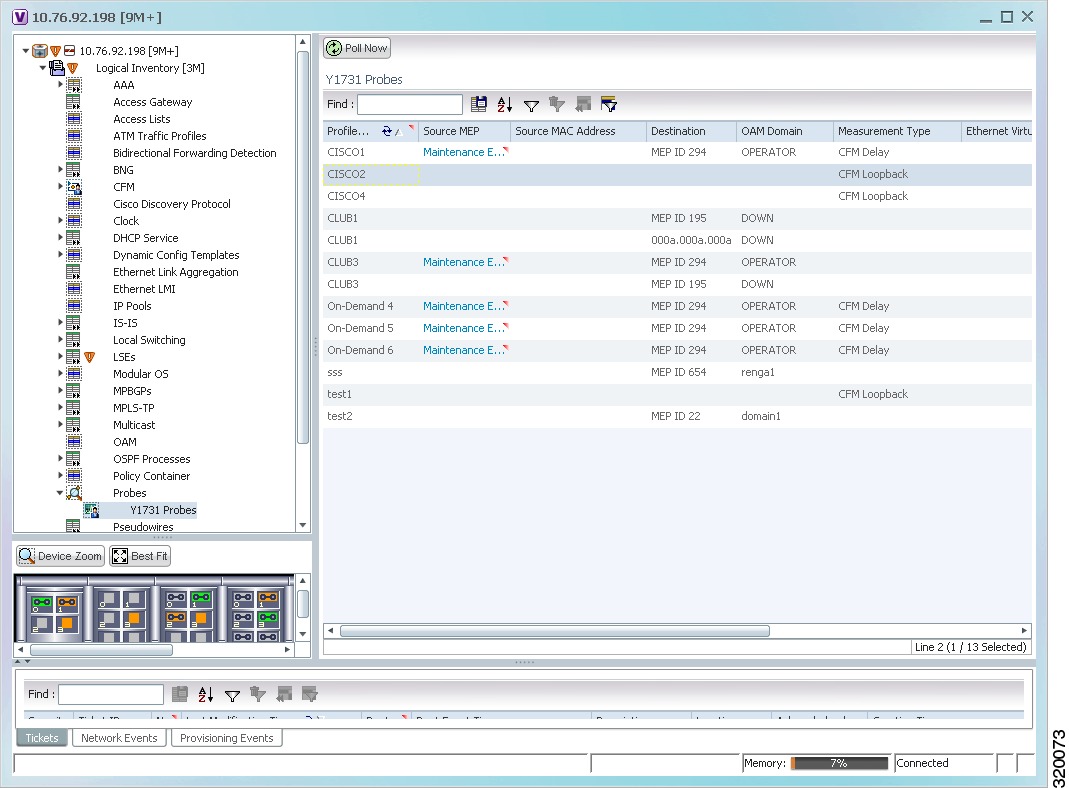
Figure 17-1 Y.1731 Probes Content Pane
Table 17-2 describes the fields that are displayed in the content pane.
Table 17-2 Y.1731 Content Pane
Field Name
|
Description
|
Profile Name
|
The name of the profile created for performance monitoring of the SLA configuration.
|
Source MEP
|
The maintenance endpoint (MEP) interface ID where the probe is getting initiated.
|
Source MAC Address
|
The source interface MAC address where the probe is getting initiated.
|
Destination
|
The interface ID or MAC address, which will help the probe to reach its destination.
|
OAM Domain
|
The name of the OAM domain.
|
Measurement Type
|
The type of performance operation, which could be cfm-delay-measurement or cfm-loopback.
|
Ethernet Virtual Connection
|
The name or identifier of the ethernet virtual connection, which connects two User-Network Interfaces (UNI). This is applicable only for the Cisco CPT devices.
|
Packet Size
|
The size of the service packet. This includes padding size when required.
|
Packets Per Burst
|
The number of packets transmitted per burst.
|
Burst Period
|
The time taken to send the packets from the source to their destination. This period is usually specified in terms of seconds or milliseconds.
|
Step 3
Right-click on a probe and choose Properties to view its properties. Additionally, the following information is displayed in the Probe Properties window for a Cisco CPT device.
Table 17-3 describes the additional fields that are displayed for a Cisco CPT device in the Probe Properties window.
Table 17-3 Probe Properties Window
Field Name
|
Description
|
Measurements
|
Statistics Type
|
The statistics type, which is Round Trip Delay or Round Trip Jitter.
|
Aggregate Bin Count
|
The aggregate count of bins to store the counter values of the result of each performance parameter.
Note The counter value refers to the counter of number of results that fall within a particular range specified for each performance attribute.
|
Aggregate Bin Boundaries
|
The bin boundary for the bins. For Cisco CPT devices, bin boundary is specified as comma separated intervals; whereas for ASR9K devices, it is an integer. Bin boundaries are specified in terms of milliseconds.
|
Bucket Size
|
The number of buckets required to store the performance attribute results gathered during a specified period. By default, a separate bucket is created for each probe, which will contain the results relating to measurements made by the probe.
|
Configuring Y.1731 Probes
You can configure Y.1731 probes using a certain set of commands. The following commands can be launched from the inventory by right-clicking the appropriate node and selecting Commands. Before executing any commands, you can preview them and view the results. If desired, you can also schedule the commands. To find out if a device supports these commands, see the Cisco Prime Network 3.10 Supported Cisco VNEs.
The following commands facilitate the configuration of Y.1731 probes for a Cisco ASR9000 device:
•
Configure Probe Endpoint Association
•
Configure Profile
•
Create On Demand Probe Configuration
•
Deassociate Profile
•
Delete Profile
The following commands facilitate the configuration of Y.1731 probes for a Cisco CPT device:
•
Configure IP SLA Parameters
•
Delete IP SLA
Configure Probe Endpoint Association
To configure endpoint association of a probe:
Step 1
In the inventory window, expand the Logical Inventory tree and choose the Probes > Y1731 Probes node.
Step 2
Right-click and choose Commands > Configuration > Configure Probe EndPoint Association. The Configure Probe EndPoint Association dialog box opens.
Step 3
By default, the General tab is selected. Provide values for the following parameters.
Input Parameter
|
Description
|
Interface
|
The interface ID, which is either a MEPID or a MAC Address.
|
OAM Domain
|
The OAM domain.
|
Service Name
|
The name of the service.
|
Source Maintenance Endpoint ID
|
The identification of the source maintenance endpoint.
|
Profile Name
|
The name of the profile created for performance monitoring for Service Level Agreements configuration.
|
Destination Type
|
The destination type, which is either a MEPID or a MAC Address.
|
Destination
|
The destination MEPID or the MAC Address.
|
Step 4
Preview, schedule, or execute the command.
Configure Profile
To configure a profile for the probe.
Step 1
In the inventory window, expand the Logical Inventory tree and choose the Probes > Y1731 Probes node.
Step 2
Right-click and choose Commands > Configuration > Configure Profile. The Configure Profile dialog box opens.
Step 3
By default, the General tab is selected. Provide values for the following parameters:
Input Parameter
|
Description
|
Profile Name
|
The name of the profile that must be configured.
|
Operation Type
|
The operation type as cfm-delay-measurement or cfm-loopback.
|
Probe Type
|
The probe type as burst or packet.
|
Probe Schedule Type
|
The schedule type for probes as every or once.
|
Probe Schedule Value
|
The value for the schedule type selected in the previous field.
|
Probe Scheduled Units
|
The units for the schedule type and value selected in the previous fields. Values are:
• milliseconds
• seconds
• minutes
• hours
• none
|
Number of Packets
|
The number of packets transmitted from the source to the destination.
|
Interval Period
|
The time taken to send the packets from the source to their destination.
|
Interval Period Units
|
The unit of the interval period. Values are:
• Milliseconds
• Seconds
• None
|
Packet Size
|
The size of the service packet (including padding size when required).
|
Test Pattern
|
The test pattern. Values are:
• hex
• pseudo-random
• None
|
Test Pattern Value
|
The value for the selected test pattern.
|
Priority Value
|
The priority value.
|
Step 4
Select the SLA Statistics tab. Provide values for the following parameters:
Input Parameter
|
Description
|
Statistics Type
|
The statistics type. Values are:
• one-way-delay-ds
• one-way-delay-sd
• one-way-jitter-ds
• one-way-jitter-sd
• round-trip-delay
• round-trip-jitter
|
Aggregate Period
|
The aggregate period, which can be configure or none.
|
Aggregate Bins
|
The aggregate count of bins to store the counter values of the result of each performance parameter.
|
Aggregate Width
|
The aggregate width of each bin.
|
Bucket Size
|
The number of buckets required to store the performance attribute results gathered during a specified period.
|
Bucket Size Units
|
The units for the bucket size, which can be per-probe or probes.
|
Bucket Archive
|
The number of buckets archived.
|
Step 5
Select the SLA Schedule tab. Provide values for the following parameters:
Input Parameter
|
Description
|
Schedule Time or Day
|
The time or day for the SLA schedule.
|
Schedule Time Units
|
The units for the schedule. Values are:
• hours
• minutes
• none
|
Schedule At
|
The time at which the SLA must be scheduled.
|
Schedule for Duration
|
The duration for which the SLA must be scheduled.
|
Schedule for Units
|
The units for the schedule. Values are:
• seconds
• minutes
• hours
• days
• week
• None
|
Step 6
Preview, schedule, or execute the command.
Create On Demand Probe Configuration
To create on demand probe configuration:
Step 1
In the inventory window, expand the Logical Inventory tree and choose the Probes > Y1731 Probes node.
Step 2
Right-click and choose Commands > Configuration > Create On Demand Probe Configuration. The Create On Demand Probe Configuration dialog box opens.
Step 3
By default, the General tab is selected. Provide values for the following parameters:
Input Parameter
|
Description
|
Operation Type
|
The type of operation, which can be cfm-delay-measurement or cfm-loopback.
|
OAM Domain
|
The OAM domain.
|
Source Interface [B/G/T/P Location]
|
The source interface ID for a probe.
|
Destination Type
|
The destination type, which can be mac-address or mep-id.
|
Destination Value
|
The interface ID of the destination, which is either a MAC Address id or a MEPID.
|
Packet Size
|
The size of the service packet. This also includes padding size when required.
|
Test Pattern
|
The test pattern. Values are:
• hex
• pseudo-random
• None
|
Test pattern value
|
The value of the selected test pattern.
|
Priority Value
|
The priority value.
|
Probe Type
|
The type of probe. Values are:
• burst
• packet
• none
|
Probe Schedule Type
|
The schedule type for probes, which can be every or once.
|
Probe Schedule Value
|
The value for the schedule type selected in the previous field.
|
Probe Scheduled Units
|
The units for the schedule type and value selected in the previous fields. Values are:
• minutes
• hours
• none
|
Number of Packets
|
The number of packets transmitted from the source to the destination.
|
Interval Period
|
The time taken to send the packets from the source to their destination.
|
Step 4
Choose the Probe Statistics tab. Provide values for the following parameters:
Input Parameter
|
Description
|
Statistics Type
|
The statistics type. Values are:
• one-way-delay-ds
• one-way-delay-sd
• one-way-jitter-ds
• one-way-jitter-sd
• round-trip-delay
• round-trip-jitter
|
Aggregate Period
|
The aggregate period, which can be configure or none.
|
Aggregate Bins
|
The aggregate count of bins to store the counter values of the result of each performance parameter.
|
Aggregate Width
|
The aggregate width of each bin.
|
Bucket Properties
|
The bucket type. Values are:
• archive
• size
• none
|
Archive/Bucket Size
|
The number of buckets required to store the performance attribute results gathered during a specified period.
|
Step 5
Choose the Probe Schedule tab. Provide values for the following parameters:
Input Parameter
|
Description
|
Schedule Config
|
The schedule to be used for the configuration. Values are:
• now
• at
• in
• None
|
Schedule At
|
The time at which the probe must be scheduled.
|
Schedule At Date
|
The date on which the probe must be scheduled.
|
Schedule In
|
The time period for which the probe must be scheduled.
|
Schedule In Units
|
The units to be used for the schedule. Values are:
• seconds
• minutes
• None
|
Schedule for Duration
|
The duration for which the probe must be scheduled.
|
Schedule for Units
|
The units for the schedule duration. Values are:
• seconds
• minutes
• None
|
Repeat Probe Interval
|
The interval during which the schedule must be repeated.
|
Repeat Probe Units
|
The units for the repeat schedule. Values are:
• seconds
• minutes
• None
|
Number of probes
|
The number of probes that must be configured.
|
Asynchronous
|
Indicates whether the schedule is asynchronous. Values are:
• enable
• disable
• None
|
Step 6
Preview, schedule, or execute the command.
Deassociate Profile
To deassociate a profile:
Step 1
In the inventory window, expand the Logical Inventory tree and choose the Probes > Y1731 Probes node.
Step 2
Right-click and choose Commands > Configuration > Deassociate Profile. The Deassociate Profile dialog box opens.
Step 3
By default, the General tab is selected. Provide values for the following parameters:
Input Parameter
|
Description
|
Profile Name
|
The name of the profile created for performance monitoring of the SLA configuration.
|
Interface Name
|
The interface ID.
|
Domain Name
|
The name of the OAM domain.
|
Service Name
|
The name of the service.
|
Source MEPID
|
The source interface ID for a probe where the probe is getting initiated.
|
Destination Type
|
The destination type, which can be mac-address or mep-id.
|
Destination Value
|
The interface ID of the destination, which is either a MAC Address ID or a MEPID.
|
Step 4
Preview, schedule, or execute the command.
Delete Profile
To delete a profile:
Step 1
In the inventory window, expand the Logical Inventory tree and choose the Probes > Y1731 Probes node.
Step 2
Right-click and choose Commands > Configuration > Delete Profile. The Delete Profile dialog box opens.
Step 3
By default, the General tab is selected. Provide values for the following parameters:
Input Parameter
|
Description
|
Profile Name
|
The name of the profile created for performance monitoring of SLA configuration.
|
Measurement Type
|
The measurement type, which can be cfm-delay-measurement or cfm-loopback.
|
Step 4
Preview, schedule, or execute the command.
Configure IP SLA Parameters
To configure an IP SLA profile for the probe.
Step 1
In the inventory window, expand the Logical Inventory tree and choose the Probes > Y1731 Probes node.
Step 2
Right-click and choose Commands > Configuration > Configure IP SLA Parameters. The Configure Profile dialog box opens.
Step 3
By default, the General tab is selected. Provide values for the following parameters:
Input Parameter
|
Description
|
SLA ID
|
The unique SLA ID.
|
Measurement Type
|
The measurement type, which can be cfm-delay-measurement or cfm-loopback.
|
OAM Domain Name
|
The name of the OAM domain.
|
Ethernet Virtual Connection
|
The name or identifier of the ethernet virtual connection, which connects two User-Network Interfaces (UNI).
|
Target Maintenance End point id or Mac Address Type
|
The target type, which can be Maintenance endpoint or Mac Address.
|
Target Maintenance End point id or Mac Address
|
The target maintenance endpoint ID or the Mac address, based on the type selected.
|
Class of Service
|
The class of service, which can be any value between 0 and 7.
|
Source Maintenance End point id or Mac Address Type
|
The source type, which can be Maintenance endpoint or Mac Address.
|
Source Maintenance End point id or Mac Address
|
The source maintenance endpoint ID or the Mac address, based on the type selected.
|
Y1731 Frame Type
|
The Y1731 frame type, which can be interval, offset, or size.
|
Y1731 Frame Parameters
|
The frame parameter, based on the frame type selected.
|
History Period
|
The number of historical aggregated interval statistics to be retained, which can be any value between 0 and 10.
|
Aggregate Period
|
The duration for which individual delay measurements are aggregated into cumulative statistics.
|
Distribution Type
|
The distribution type, which can be delay or delay-variation.
|
Distribution Value
|
The distribution value, based on the distribution type selected.
|
Distribution Boundaries [comma separated]
|
The distribution boundaries separated by a comma.
|
Max Delay in milliseconds
|
The maximum delay that is allowed as a valid delay measurement.
|
Owner Name
|
The name of the operation owner.
|
Step 4
Choose the SLA Schedule tab. Provide values for the following parameters:
Input Parameter
|
Description
|
Life Type
|
The schedule type for the two-way delay measurement on the sender, which can be forever, seconds, or None.
|
Life Period
|
The schedule period, based on the life type selected.
|
Start Time Type
|
The start time type for the schedule, which can be now, hh:mm [:ss], after {hh:mm:ss}, or None.
|
Start Time
|
The time when the schedule must start, based on the type selected.
|
Month Day Format
|
The month day format to be used for the schedule, which can be month-day, day-month, or None.
|
Month Day Input
|
The month day input format.
|
Age out Period in seconds
|
The age out period for the schedule.
|
Recurring
|
The option to execute the schedule repeatedly, which can be Disable, Enable, or None.
|
Step 5
Preview, schedule, or execute the command.
Delete IP SLA
To delete IP SLA:
Step 1
In the inventory window, expand the Logical Inventory tree and choose the Probes > Y1731 Probes node.
Step 2
Right-click and choose Commands > Configuration > Delete IP SLA. The Delete IP SLA dialog box opens.
Step 3
By default, the General tab is selected. Provide values for the following parameters:
Input Parameter
|
Description
|
SLA ID
|
The SLA ID that must be deleted.
|
Step 4
Preview, schedule, or execute the command.
Diagnosing Y.1731 Probes
The following commands facilitate diagnosing the Y.1731 probes for a Cisco ASR 9000 device:
•
Show SLA Operations Detail
•
Show SLA Profiles
The following command facilitates diagnosing the Y.1731 probes for a Cisco CPT device:
•
Show IP SLA
Show SLA Operations Detail
To view the details of the SLA operation:
Step 1
In the inventory window, expand the Logical Inventory tree and choose the Probes > Y1731 Probes node.
Step 2
Right-click and choose Commands > Diagnostics > Show SLA Operations Detail. The Show SLA Operations Detail dialog box opens.
The command checks the operational details and does not require any input parameters.
Step 3
To see the commands that will be applied on the device, click Preview.
Step 4
To schedule the command, click the Scheduling tab.
Step 5
To run the command, click Execute Now.
You can view errors in the Result tab, if there are any.
Step 6
To close the dialog box, click Close.
Show SLA Profiles
To view a list the SLA profiles:
Step 1
In the inventory window, expand the Logical Inventory tree and choose the Probes > Y1731 Probes node.
Step 2
Right-click and choose Commands > Diagnostics > Show SLA Profiles. The Show SLAProfiles dialog box opens.
The command checks the details and does not require any input parameters.
Step 3
To see the commands that will be applied on the device, click Preview.
Step 4
To schedule the command, click the Scheduling tab.
Step 5
To run the command, click Execute Now.
You can view errors in the Result tab, if there are any.
Step 6
To close the dialog box, click Close.
Show IP SLA
To view the IP SLA schedule details:
Step 1
In the inventory window, expand the Logical Inventory tree and choose the Probes > Y1731 Probes node.
Step 2
Right-click and choose Commands > Diagnostics > Show IP SLA. The Show IP SLA dialog box opens.
The command checks the details and does not require any input parameters.
Step 3
To see the commands that will be applied on the device, click Preview.
Step 4
To schedule the command, click the Scheduling tab.
Step 5
To run the command, click Execute Now.
You can view errors in the Result tab, if there are any.
Step 6
To close the dialog box, click Close.