Feedback
Table Of Contents
Using Cisco MPLS Diagnostics Expert
3.1 Performing an MPLS VPN Connectivity Verification Test
3.1.1 Configuration Using Customer VPN Information
3.2 Interpreting the Test Results
3.3 Advanced Troubleshooting Options
Using Cisco MPLS Diagnostics Expert
This chapter describes how to use Cisco MPLS Diagnostics Expert.
This chapter contains the following sections:
•
Performing an MPLS VPN Connectivity Verification Test
•
•
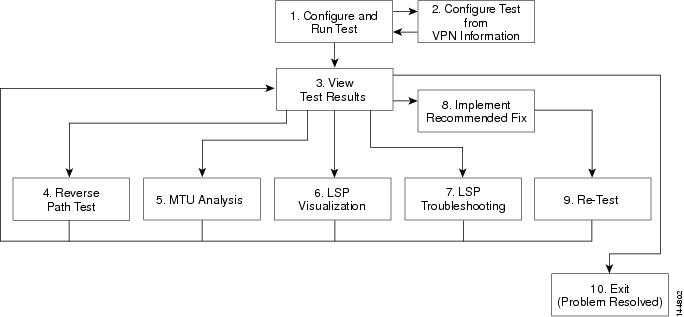
Figure 3-1 describes the workflow for using Cisco MPLS Diagnostics Expert.
Figure 3-1 Using Cisco MPLS Diagnostics Expert Workflow
1.
2.
3.
4.
5.
6.
7.
8.
9.
3.1 Performing an MPLS VPN Connectivity Verification Test
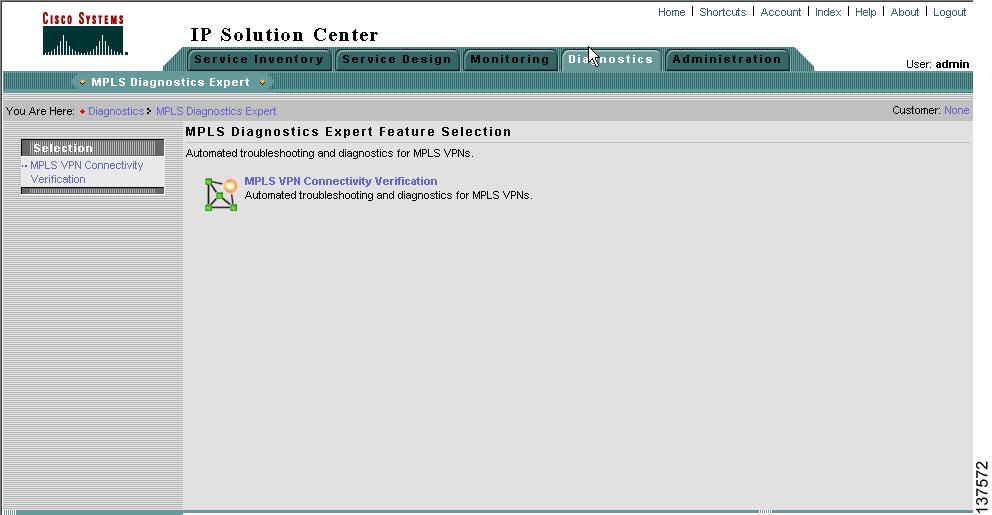
This section describes how to perform an MPLS VPN Connectivity Verification test. The Diagnostics tab (see Figure 3-2) allows you to configure this test and to view the results.
Note
Step 1
Figure 3-2 Diagnostics Tab
Step 2
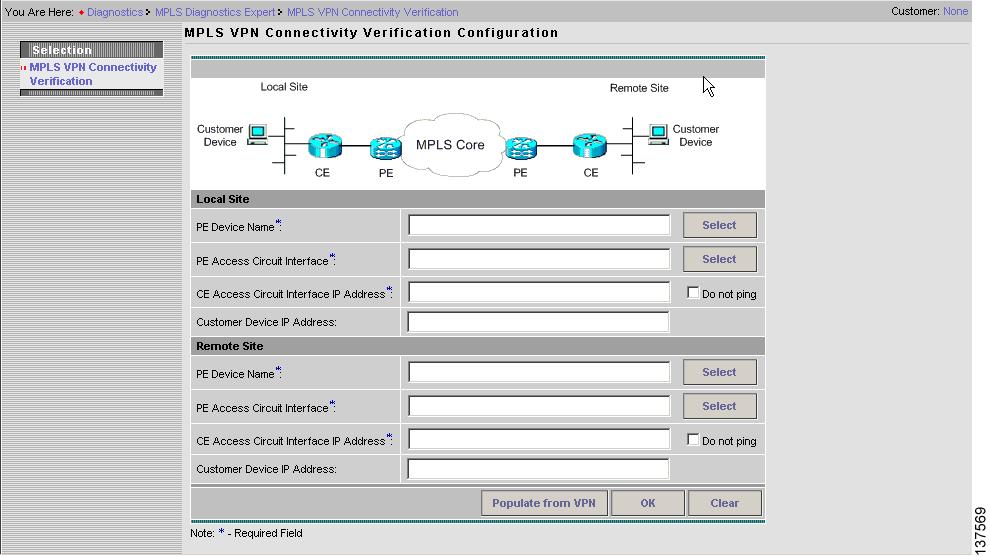
Figure 3-3 MPLS VPN Connectivity Verification Configuration Window
The MPLS VPN Connectivity Verification Configuration window allows you to configure the connectivity test to be performed. This window displays the following components:
•
•
•
The network diagram is a static image that provides you with context for the information you must enter to configure the test.
MPLS VPN Connectivity Verification tests connectivity between two sites in a VPN. Throughout the test, these sites are referred to as the local site and remote site. It is anticipated that a connectivity problem will be reported or detected from the perspective of a particular site. This particular site would typically be used as the local site, and the test is performed from this site. However, this is not mandatory, as any site can be used as the local or remote site, because connectivity is tested in both directions.
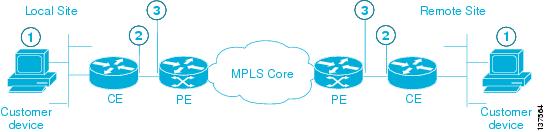
The scope of the L3 VPN connectivity test (see Figure 3-4) can be changed on a per-site basis. For each site you can test connectivity to a customer device within the site (shown on Figure 3-4 as 1), the CE access circuit interface (shown on Figure 3-4 as 2), or the PE access circuit interface (shown on Figure 3-4 as 3). The test scope is determined by the configuration that you provide.
It could be desirable to vary the test scope for a number for reasons. For example, a customer could use an access control list (ACL) on their customer edge (CE) access circuit interface to block ICMP Echo packets from entering the site network. In this instance it would be desirable to limit the test scope to the access circuit interface of the PE device. Alternatively you might want to test to a device within a customer site. A successful test verifies that VPN connectivity exists to that device. If the test to the customer device fails but you are able to verify connectivity between CE devices, this allows you to isolate the problem to the CE device or customer site network.
Figure 3-4 Test Scope
1.
2.
3.
By default, if you specify only the required fields for a site, the test is performed to the CE access circuit interface.
Note
To test connectivity to a device within the customer site subnetwork you should enter the IP address in the Customer Device IP Address field and make sure the Do not ping check box is not checked.
To restrict testing to the PE access circuit interface for a site, you should check the Do not ping check box located beside the CE Access Circuit Interface IP Address field. If a customer device IP address has been entered, then it is ignored during the test.
Note
Cisco IOS ACLs allow selected traffic to be blocked based on a wide variety of criteria. ACLs configured on the CE can lead to inconsistent results being reported when an MPLS VPN Connectivity Verification test is performed to a customer device or CE interface. Where possible an MPLS VPN Connectivity Verification test will report that traffic is blocked by an ACL configured on the CE device. However, depending on ACL configuration, it is not always possible to determine that traffic is blocked by an ACL configured on the CE device. In some cases an MPLS VPN Connectivity Verification test might report an access circuit failure or unknown failure. In cases where it is suspected that traffic is being blocked at the CE, the test scope should be reduced to the PE access circuit interface.
Step 3
Note
Table 3-1 provides field descriptions of the MPLS VPN Connectivity Verification Configuration window.
Table 3-1 Field Descriptions for the MPLS VPN Connectivity Verification Configuration Window
PE Device Name (required field)
Enter the local site PE Device Name in the PE Device Name field or select the local site PE Device Name by clicking the Select button.
Note
The Device Name is the fully qualified hostname and domain name of the device. For example, router1.cisco.com. However, the domain name is optional so in many cases the Device Name is the device hostname. For example, router1.
The Device Name specified must match that of a PE device with role type of N-PE. For details of how to create PE devices, see Inventory Setup.
PE Access Circuit Interface (required field)
Enter the interface name of the local site PE Access Circuit Interface in the PE Access Circuit Interface field or select the local site PE Access Circuit Interface by clicking the Select button.
Note
You must specify a valid local PE Device Name before selecting the PE Access Circuit Interface. The interface specified should be the access circuit interface attached to the site's CE. The interface name specified must match an interface on the device, but the interface does not necessarily need to be in the ISC device inventory.
CE Access Circuit Interface IP Address (required field)
Enter the IP address of the CE access circuit interface for the local site. This should be the access circuit interface attached to the specified PE. The IP address entered is validated to ensure it is in the same subnet as the specified PE access circuit interface. The test supports managed and unmanaged Cisco CE devices, and non-Cisco CE devices.
Do not ping (optional field)
Check this check box to restrict connectivity testing to the access circuit interface of the PE device. This option is intended for cases where the customer has blocked access to the CE interface, for example, when using an ACL.
Customer Device IP Address (optional field)
Enter the IP address of a customer device on the local site customer network. Entering the customer device IP address causes the connectivity test to be performed to this device.
PE Device Name (required field)
Enter the remote site PE Device Name in the PE Device Name field or select the remote site PE Device Name by clicking the Select button.
Note
The Device Name is the fully qualified hostname and domain name of the device. For example, router1.cisco.com. However, the domain name is optional so in many cases the Device Name is the device hostname. For example, router1.
The Device Name specified must match that of a PE device with role type of N-PE. For details of how to create PE devices, see Inventory Setup.
PE Access Circuit Interface (required field)
Enter the interface name of the remote site PE Access Circuit Interface in the PE Access Circuit Interface field or select the remote site PE Access Circuit Interface by clicking the Select button.
Click the Select button to open the Select Device Interface window (see Selecting a PE Access Circuit Interface).
You must specify a valid remote PE Device Name before selecting the PE Access Circuit Interface. The interface specified should be the access circuit interface attached to the site's CE. The interface name specified must match an interface on the device, but the interface does not necessarily need to be in the ISC device inventory.
CE Access Circuit Interface IP Address (required field)
Enter the IP address of the CE access circuit interface for the remote site. This should be the access circuit interface attached to the specified PE. The IP address entered is validated to ensure it is in the same subnet as the specified PE access circuit interface. The test supports managed and unmanaged Cisco CE devices, and non-Cisco CE devices.
Do not ping (optional field)
Check this check box to restrict connectivity testing to the access circuit interface of the PE device. This option is intended for cases where the customer has blocked access to the CE interface, for example, when using an access list.
Customer Device IP Address (optional field)
Enter the IP address of a customer device on the remote site customer network. Entering the customer device IP address causes the connectivity test to be performed to this device.
Populate from VPN
Click the Populate from VPN button to open the Populate from VPN window. The Populate from VPN window allows you to configure the test using customer VPN information (see Configuration Using Customer VPN Information.)
OK
Click OK to run the test.
Clear
Click Clear to reset all the fields in the window.
Selecting a PE Device
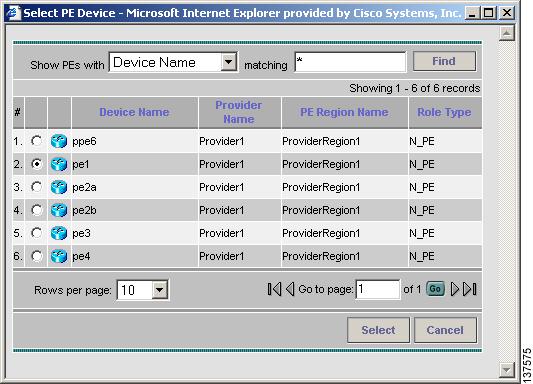
Click the Select button (for the Local/Remote PE Device Name) to open the Select PE Device window (see Figure 3-5) where you can choose the local/remote site PE. The Select PE Device window displays a table containing all the PE devices available in the inventory.
Figure 3-5 Select PE Device Window
You can perform a wildcard string search of all PE attributes displayed in the PE table. If you select a local/remote site PE from the ISC inventory, this overrides anything entered in the Local/Remote PE Device Name field (see Figure 3-3.)
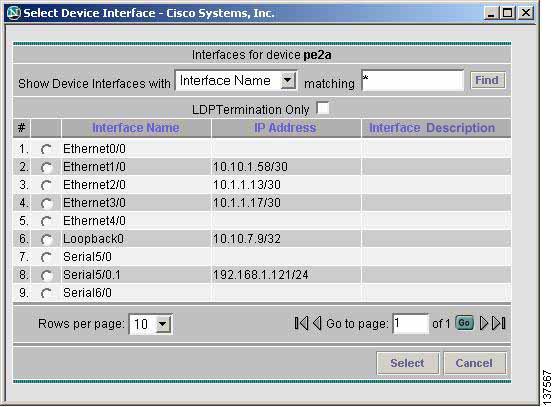
Selecting a PE Access Circuit Interface
Click the Select button (for the Local/Remote PE Access Circuit Interface) to open the Select Device Interface window (see Figure 3-6) where you can choose the interface name. The Select Device Interface window displays a table containing all interfaces for the selected local/remote PE device.
Note
Figure 3-6 Select Device Interface Window
You can perform a wildcard string search of all attributes displayed in the table. If you select a Local/Remote PE Access Circuit Interface from the ISC inventory, this overrides anything entered in the Local/Remote PE Access Circuit Interface field (see Figure 3-3).
Step 4
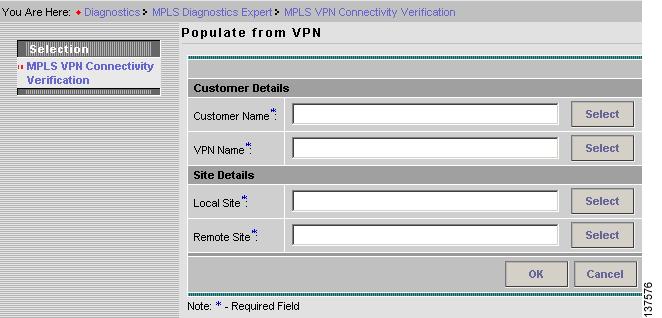
3.1.1 Configuration Using Customer VPN Information
Cisco MPLS Diagnostics Expert can be used standalone, without any dependency on other ISC functionality. However, if ISC VPN Provisioning functionality is used to provision VPNs within the network, this provisioning information, associated with the customer and VPN, can be used as an alternative means to configure an MPLS VPN Connectivity Verification test. Rather than specifying device-specific configuration, you can specify a customer, VPN, local site, and remote site. All required test configuration is then derived from this information.
Note
Step 1
Figure 3-7 Populate from VPN Window
Step 2
Step 3
Note
Note
Step 4
3.1.2 VPN Topologies
By default an MPLS VPN Connectivity Verification test assumes that the local and remote sites are connected through a full mesh VPN topology and that these sites can communicate directly. If the sites being tested are connected through a VPN topology other than full mesh, the required configuration for an MPLS VPN Connectivity Verification test might differ. In this situation the test might produce misleading results, so you must take care when interpreting the test results. The following sections detail the configuration required and how the test results should be interpreted for each supported VPN topology.
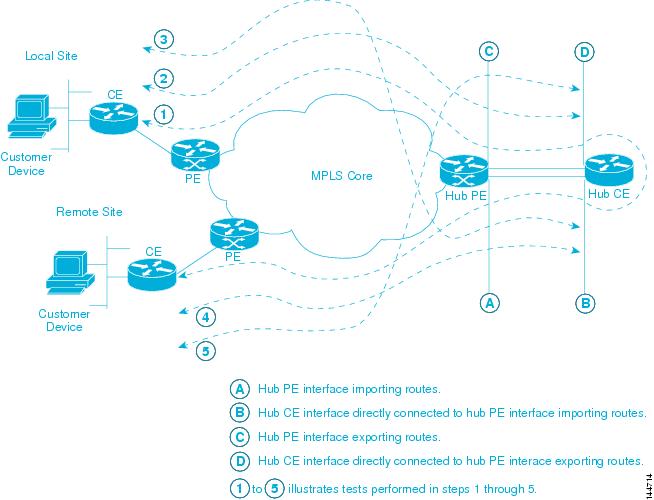
3.1.2.1 Testing with Hub and Spoke VPN Topology
Customer sites connected through a hub and spoke VPN cannot communicate directly. The customer sites (Spokes) communicate through a Hub router. When testing connectivity between two sites connected through a hub and spoke VPN you should perform the test using the following steps:
Step 1
Step 2
Step 3
Step 4
Step 5
Note
Note
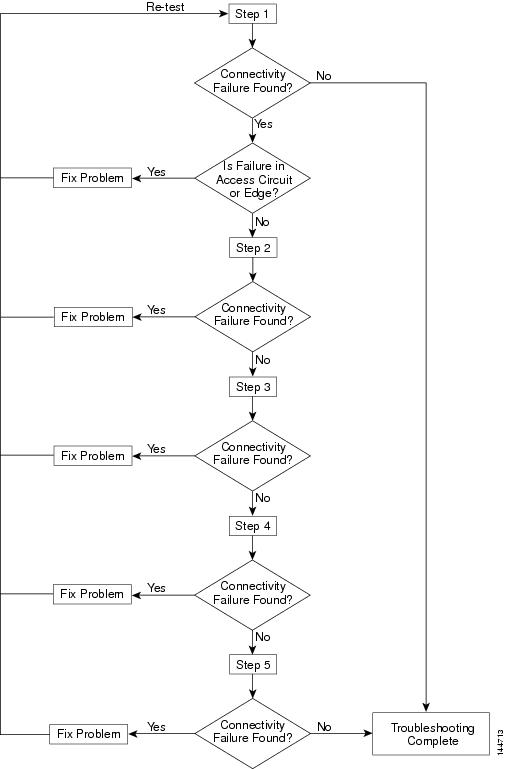
Each step involves performing an MPLS VPN Connectivity Verification test between different points. Depending on whether a connectivity failure exists and the location of this failure, it might not be necessary to perform all five steps. Figure 3-7 shows the workflow for testing a hub and spoke VPN.
Figure 3-8 Workflow
Figure 3-9 illustrates the MPLS VPN Connectivity Verification tests required to test connectivity between two sites in a hub and spoke VPN.
Figure 3-9 Testing a Hub and Spoke VPN Topology
Step 1
Note
Step 2
Step 3
Step 4
Step 5
3.1.2.2 Testing with Intranet/Extranet VPN Topology
Sites connected through an Intranet/Extranet VPN topology can communicate directly, similar to a full mesh VPN topology. When configuring an MPLS VPN Connectivity Verification test between two sites connected through an Intranet/Extranet VPN you should configure the test as normal.
When testing connectivity between sites connected through an Intranet/Extranet VPN, Cisco MPLS Diagnostics Expert will troubleshoot MPLS VPN connectivity issues including access circuit, VPN edge and MPLS core problems. Cisco MPLS Diagnostics Expert does not troubleshoot Intranet/Extranet VPN specific problems, such as missing or miss-configured route maps.
If an MPLS VPN Connectivity Verification test detects a connectivity failure but that failure cannot be attributed to MPLS VPN connectivity issues including access circuit, VPN edge and MPLS core problems, then the Test Results window will recommend that you troubleshoot the Intranet/Extranet configuration.
Note
3.1.2.3 Testing with Central Services VPN Topology
With a Central Services VPN topology the client sites can communicate directly with one or more central sites, but they cannot communicate with each other. When configuring an MPLS VPN Connectivity Verification test between a client site and central site, connected through a Central Services VPN topology, you should configure the test as normal by entering the client site and central site, as the local and remote site respectively.
It is not possible to perform an MPLS VPN Connectivity Verification test between two client sites in a Central Services VPN.
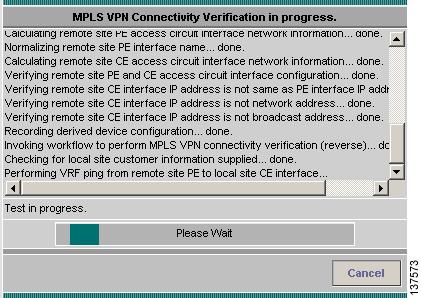
3.1.3 Progress Window
The time taken to perform an MPLS VPN Connectivity Verification test varies. A test could take some time to complete, depending on the size of your network, whether a connectivity problem is identified, and the nature of this connectivity problem. While the test is being performed the Progress window is displayed (see Figure 3-10).
The Progress window displays a one-line textual summary of each step that has been completed and the step that is currently executing.
Figure 3-10 Progress Window
Click the Cancel button to cancel the test if required. If you click Cancel, you are asked to confirm that you want to cancel the test. If you confirm, the test is cancelled when the current step has completed. If the current step involves device interaction, this completes before the test is cancelled. Upon cancellation, the Test Results window appears indicating that you cancelled the test. All completed steps are displayed in the test log.
When the test is complete the Test Results window appears. See Interpreting the Test Results, for further details.
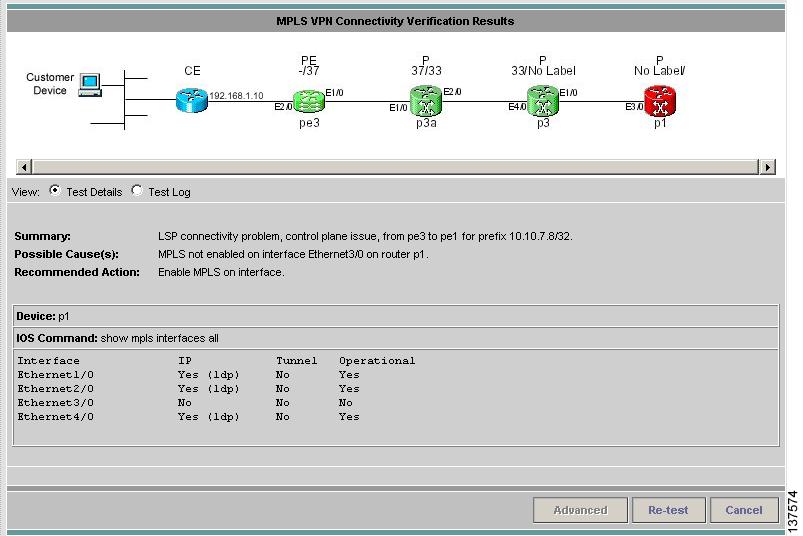
3.2 Interpreting the Test Results
Upon completion of a MPLS VPN Connectivity Verification test, the Test Results window appears (see Figure 3-11).
Figure 3-11 Test Results Window with Failure Specific Additional Information Displayed
The Test Result window displays the location and cause of the problem found, recommended actions, observations, and details of the automated troubleshooting and diagnostics steps performed. The Test Result window also allows you to invoke advanced troubleshooting options where appropriate (see Table 3-5).
The Test Results window consists of the following components:
Table 3-5 Field Descriptions for the Test Results Window
Data path
See Data Path
Test Details
See Test Details
Test Log
See Test Log
Export button
The Export button appears when the Test Log radio button is selected. See Export.
Advanced button
Click the Advanced button to launch advanced troubleshooting. See Advanced Troubleshooting Options. The options available on this button are dynamically configured depending on the test result. In some cases there might be no advanced troubleshooting options available.
Re-test button
Click the Re-test button to re-run the connectivity test using the existing configuration. This can be used to verify the fix implemented.
Cancel button
Click the Cancel button to cancel the current test and return to the Test Configuration window. You will not be asked to confirm cancellation.
Note
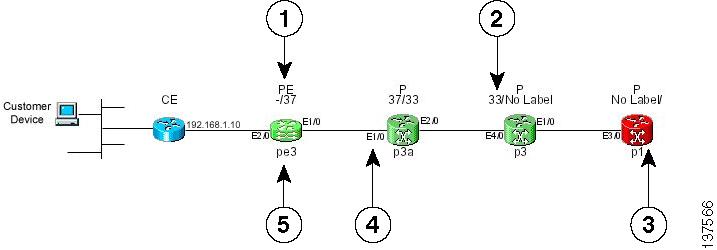
3.2.1 Data Path
The Data Path (see Figure 3-12) shows a graphical representation of the path between the two sites that have been tested.
Figure 3-12 Data Path
1.
2.
3.
4.
5.
If a failure is found, the data path highlights the failed device or link. The device colors used in the data path are described in Table 3-6.
The link color used in the data path is described in Table 3-7.
Table 3-7 Data Path Link Color Code
Red
A connectivity failure has been found. This failure might be due to a problem on one or both attached devices.
For each core PE and P device, the following information is displayed:
•
•
•
•
The information displayed for CE devices and customer devices is minimal. Typically only the information provided during test configuration is displayed for these devices.
3.2.1.1 Device Actions
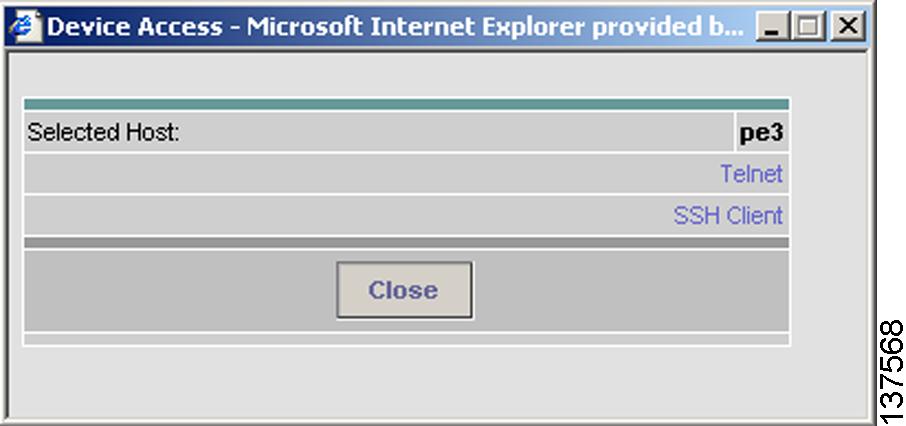
PE and P devices displayed in the Data Path support the invocation of device-specific actions. Device specific actions are invoked by left-clicking on the appropriate device within the data path. You can then select the action to invoke from a pop-up dialog (see Figure 3-13). The currently supported device actions are Telnet and SSH.
Note
Figure 3-13 Device Actions
The ability to launch device actions can be disabled using user roles. See User Roles for further details.
Note
Note
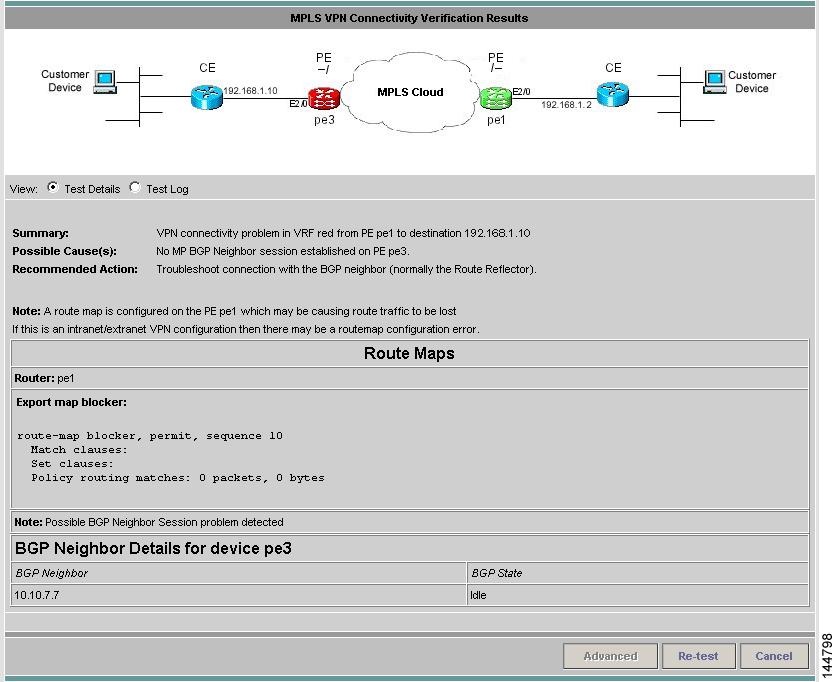
3.2.2 Test Details
The Test Details section of the Test Results window (see Figure 3-11) displays a summary of the automated troubleshooting and diagnostics results, observations made during troubleshooting, additional failure-specific information, and recommended action.
The Test Details summary is displayed in all cases. The test details summary consists of three fields that detail:
•
•
•
Failure-specific additional information is displayed below the summary as required. When displayed, this provides additional information on the problem found. For example, Forwarding Information Base (FIB), Label Forwarding Information Base (LFIB), BGP table entries, and route target import/exports. This additional failure specific information helps highlight problems such as FIB, LFIB, BGP inconsistencies, and route target import/export mismatches. For some failures no additional information is displayed.
Figure 3-11 shows an example Test Results window with failure specific information below the Test Details summary.
The Test Details radio button is selected by default.
Figure 3-14 Test Results Window with Observation Notes
Observations made during troubleshooting are displayed as notes below the Test Details summary. Observation notes detail observations made during troubleshooting which could be related to the failure. They should be considered as additional troubleshooting information. Figure 3-14 shows an example Test Results window with two observation notes. In some cases no observation notes are displayed, while in other cases multiple notes might be displayed.
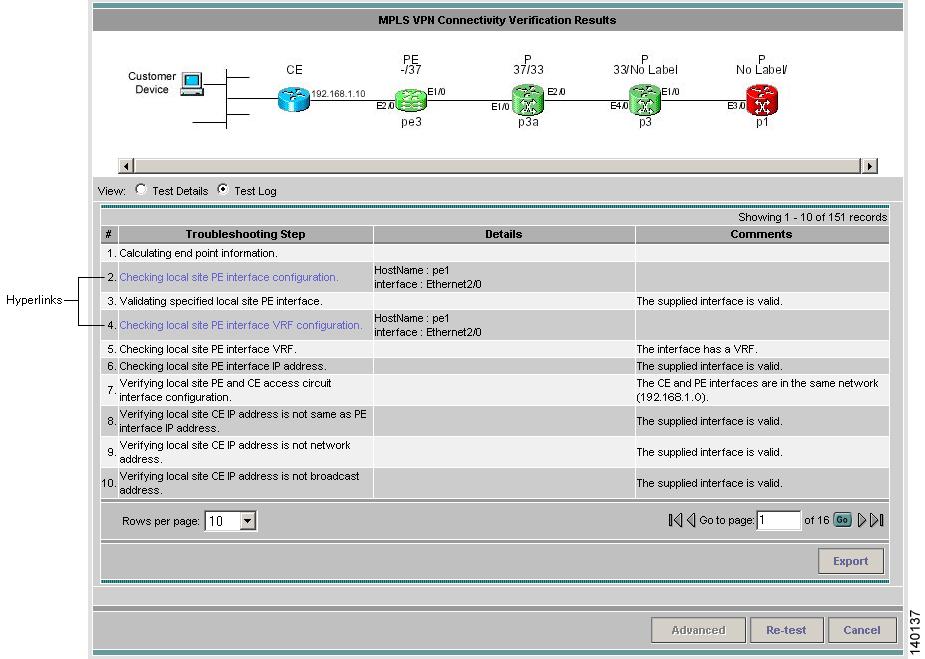
3.2.3 Test Log
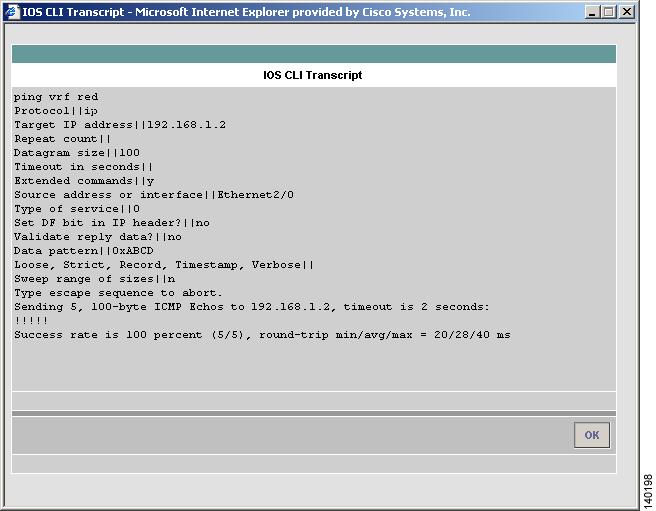
Click the Test Log (see Figure 3-15) radio button to display details of all troubleshooting and diagnostics steps in the order in which they were performed.
Figure 3-15 Test Results Window—Test Log
Some steps require device interaction involving the execution of IOS CLI commands. These steps appear in the Test Log as hyperlinks. Clicking a hyperlink opens a pop-up window that displays the IOS CLI transcript for the step (see Figure 3-16). This transcript includes the IOS commands run and all resulting output.
Figure 3-16 IOS CLI Transcript Window
3.2.4 Export
You might want to export the test log to include it in a trouble ticket, problem escalation, or when contacting Cisco TAC. The test log can be exported to file through the Export button located at the bottom of the Test Log (see Figure 3-15). All steps displayed in the test log, including IOS CLI transcripts, are exported in text format.
Step 1
Step 2
3.3 Advanced Troubleshooting Options
Advanced troubleshooting provides further options that you can use to troubleshoot your network. Advanced troubleshooting options are only available when the basic MPLS VPN Connectivity Verification test has been unable to find a failure or a failure has been found but its cause cannot be identified.
The advanced troubleshooting options supported are detailed in Table 3-8.
When appropriate, advanced troubleshooting options are made available through the Advanced drop-down button at the bottom of the Test Results window. In cases where no Advanced troubleshooting options are available, the Advanced button is disabled.
3.3.1 Reverse Path Testing
In some cases the MPLS VPN Connectivity Verification test detects a connectivity failure, but is unable to identify the cause of this failure. By repeating the test in the reverse direction (that is, reversing the local and remote site configuration) it might be possible to identify the cause of the problem. For example, while performing a connectivity test in the forward direction, an LSP connectivity problem might be identified on a device. However, this problem could be caused by an LDP miss-configuration on the downstream LSP neighbor. By repeating the test in the reverse direction, the miss-configured downstream router is be encountered first and the LDP miss-configuration is diagnosed. When this situation occurs, the Test Details displayed in the Test Results window advises you to perform the test in the reverse direction. The Reverse Test option is made available on the Advanced drop-down button in the Test Results window.
Selecting the Reverse Test advanced troubleshooting option invokes the MPLS VPN Connectivity Verification test in the reverse direction. No further configuration is required.
The results of the reverse path testing are displayed in the Test Results window.
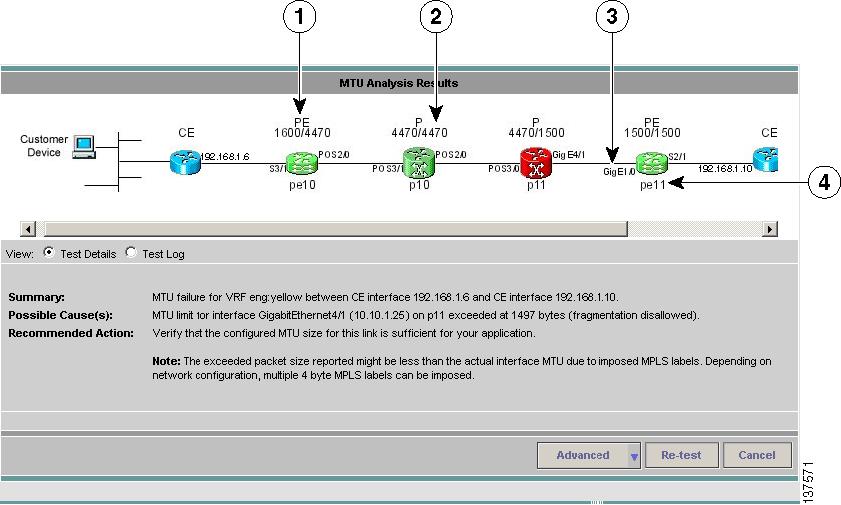
3.3.2 MTU Analysis
MTU Analysis determines the minimum interface MTU size for the tested path between the local and remote sites. It then tests that packets can be successfully sent from the local site to the remote site up to the determined minimum interface MTU size and that packets are dropped at the expected constricting interface after the minimum MTU size is exceeded. This is achieved using a sweeping ping vrf IOS command with the do not fragment option set. You must interpret the MTU analysis results to determine if the configured interface MTU sizes are sufficient for your application.
While MTU Analysis is being performed, the progress window is displayed. Once complete, MTU Analysis results (see Figure 3-17) are displayed in the Test Results window.
Figure 3-17 Test Results Window—MTU Analysis Results
1.
2.
3.
4.
The device that enforces the constricting MTU size is highlighted in red.
The Test Details section displays details of the constricting MTU including:
•
•
•
MTU analysis is only offered when an MPLS VPN Connectivity Verification test does not detect a connectivity problem.
Note
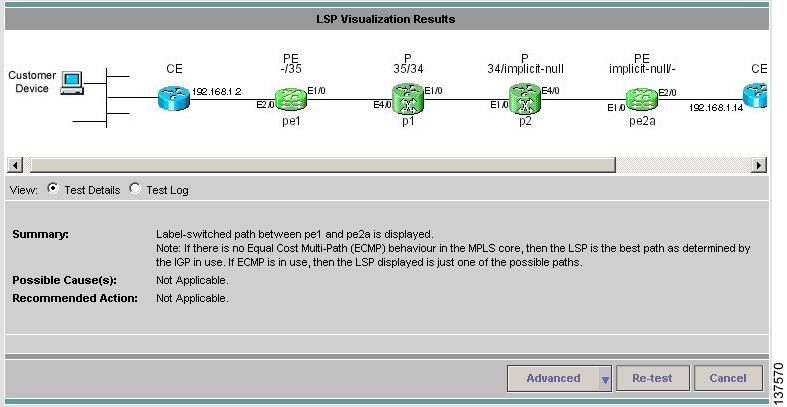
3.3.3 LSP Visualization
When no failure is found, the Test Results window data path displays a summary of the test performed. This does not show details of the path through the core that has been tested. LSP Visualization displays a hop-by-hop Data Path illustration of the MPLS label switched path (LSP) between the local and remote sites (see Figure 3-18). The path shown is the path tested during the MPLS VPN Connectivity Verification test.
Figure 3-18 Test Results Window—LSP Visualization
The Data Path displays the following for each PE and P device in the tested path:
•
•
•
•
For more details of what is displayed in the Data Path, see Data Path.
LSP Visualization is only offered when an MPLS VPN Connectivity Verification test does not detect a connectivity problem.
Note
3.3.4 LSP Troubleshooting
In some cases an IP failure might be found which masks an underlying LSP label problem. When an IP failure is found, the Test Results window displays details of the failure and informs the user that it might be due to an underlying LSP label problem. To eliminate possible LSP label issues, the user is advised to run LSP Troubleshooting using the Advanced button.