This whitepaper examines and analyses traffic latency on the Cisco ASR 1000 Series Routers. The Cisco ASR 1000 has three forwarding engines known as Cisco® ASR 1000 Series Embedded Services Processors (ESPs). This document will review the latency of two of those ESP forwarding engines, specifically the 10-Gbps Cisco ASR 1000 Series ESP (ASR1000-ESP10) and 20-Gbps Cisco ASR 1000 Series ESP (ASR1000-ESP20) forwarding engines. The goal of this whitepaper is to highlight how different forwarding rates impact the latency of the Cisco ASR 1000. This document highlights some of the choices that you must make while designing your network. This document covers the impact on overall latency relating to queuing, shaping and QoS which can impact the overall performance of your network.
The ASR1000-ESP20 was profiled in a WAN aggregation topology with services enabled to gain insight of how the system latency is affected while approaching the throughput non-drop rate (NDR).
This paper delivers results in two parts:
• Phase 1: Reporting RFC 2544 latency results for IP routing with and without services enabled as detailed in the RFC 2544 Test Setup. The results reported are the latency at the calculated NDR for that packet size/test.
• Phase 2: Profiling latency for different frame sizes at data points approaching the NDR in a WAN aggregation topology, in order to clearly illustrate and analyze the behaviour of the system.
Test results obtained from this testing are based on Cisco IOS XE release 2.2.2 for all tests. The routers were tested using procedures based on RFC 2544 Latency Testing.
Background on the RFC 2544 Latency Test
In the Latency Test, frames are transmitted for a fixed duration (120sec). Once per second, the test tags a frame and transmits it half way through the duration time. The test compares the tagged frame's timestamp when it was transmitted with the timestamp and when it was received. The difference between the two timestamps is the latency. The results taken will be the average latencies for 20 trials. To be certain of accurate results, the test was configured with a frame rate at which the Cisco ASR 1000 does not lose packets. RFC 2544 Throughput Test is performed; in order to know the maximum throughput rate. Results from the Throughput test will be used to choose a frame rate for the Latency test.
Model
ESP Type
LAN to LAN Connectivity
Traffic
Cisco ASR 1006
ASR1000-ESP10
GE-GE
IP
Cisco ASR 1006
ASR1000-ESP10
10 GE-10 GE
IP
Cisco ASR 1006
ASR1000-ESP20
GE-GE
IP
Cisco ASR 1006
ASR1000-ESP20
10 GE-10 GE
IP
Test Set-up Topologies
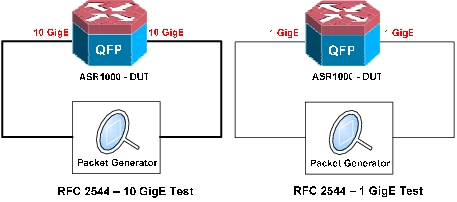
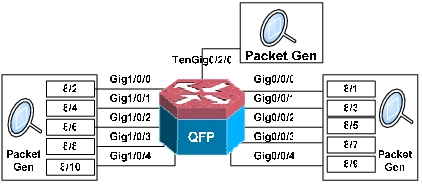
Refer to figure 1 for the RFC2544 latency testing topology. Figure 2 shows the WAN aggregation topology utilized for the RFC 2544 latency tests when services are enabled and not enabled.
The services configured for the test are; QoS queuing (and shaping) policy, access control lists, Netflow, uRPF and a dynamic routing protocol on each interface. The router learns, for the RFC2544 test, a nominal number of OSPF routes from it neighbors and must retain these adjacencies throughout the test. The configurations are further detailed in the configuration section below.
Figure 1. Physical topology for the RFC latency testing with and without features enabled.
Figure 2. Physical topology for the latency results in the WAN aggregation topology.
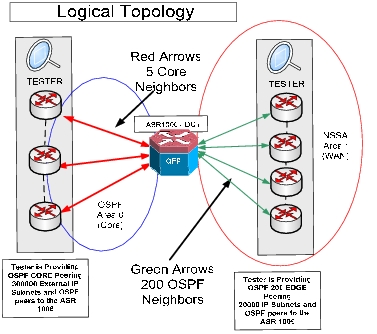
Figure 3 details the logical topology for the WAN aggregation latency test. In this test the services detailed in the prior paragraph are configured on the ASR1000-ESP20. However, in this instance the services are configured on all 205 sub-interfaces requiring a shaper to be configured on all 205 interfaces. In addition, the number of routes and routing adjacencies are significantly higher as detailed below in figure 3. The goal of this test topology was to utilize a likely deployed topology to examine latency under stress conditions. Traffic was sent to all 300,000 routes on all 205 interfaces, which allows for 120 million unique flows active during the test. In this situation all services, including Netflow, uRPF and QoS are subjected to a much higher load than normally found in static tests or real world WAN topologies.
Figure 3. Logical topology for the latency results in the WAN aggregation topology
RFC2544 Test Results and Analysis
All traffic sent in these tests is bidirectional and reported as such. All traffic being sent is default class or routine traffic. For the ASR1000-ESP10 the system bandwidth is 10Gbps, hence the NDR for the 10G test for ASR1000-ESP10 is 50% of line rate. 40,000 nanoseconds (ns) = .04 milliseconds (ms), 40000 nanoseconds (ns) = 40 microseconds (uSec)
The Tables above illustrate that the latency on the Cisco ASR 1000 platform at NDR is 20-30 microseconds without services. This is with the configuration detailed in table 12 below. Adding all of the services, as detailed in table 13, incurs only a 10usec delay as all services are performed on the QFP with hardware assists.
The ASR1000-ESP20 exhibits similar, though slightly lower latency when compared the ASR1000-ESP10 for the Gigabit ethernet testing, this is due to the fact that ASR1000-ESP20 is clocked slightly faster than ASR1000-ESP10. In the ten gigabit ethernet testing, the ASR1000-ESP20 can forward at the full 10Gbps bidirectional rate for packets greater than 200 bytes. With the ESP20 all interfaces are forwarding at line rate forcing an additional queuing operation at the interface level that is not realized on ASR1000-ESP10. (Note: Additional queuing not seen on ASR1000-ESP10 due to the bi-directional traffic flow allows 5Gbps on each 10Gbps interface) It is due to the 5Gbps transit on the ASR1000-ESP10 (see note) and the fact that the packet per second is doubled on the ASR1000-ESP20 from the ASR1000-ESP10 that the latency at NDR is around 100usecs higher for the ASR1000-ESP20 at NDR for 10Gbps testing.
When utilizing a hierachical QoS policy and shaping the latency increases by around 200usecs at NDR. Customers typically deploy shaping when configuring services on sub-interfaces or when a specific traffic rate is desired.
In this test shaping is not explicitly required, but it is detailed to provide a comparison with a normal queuing policy. This minor increase in latency is due to the shaper monitoring the traffic rate and the allowed burst per interval, then queuing if the calculated rate is above the shaper rate for that time interval, or passing if it is below. At NDR, this equates to either the line rate of the Gig interface for the Gigabit Ethernet test, or the system bandwidth of 10Gbps. At these rates the shaper is quite naturally queuing traffic so as to not exceed the configured bandwidth and to average to the configured rate; it is this queuing at NDR that causes the increased latency. It is important to note that the goal of any shaper is to not drop any traffic, but instead to queue it as it is in this instance. This shaping capability and operation is a fundamental difference to the queuing normally configured on switches, where strict priority and weighted round robin are the configured. The main goal of shaping in any router platform is maximize throughput and control, or smooth, the traffic to the desired rate.
To simplify, when you configure a router to shape an interface and then oversubscribe the interface, the shaping will cause latency to rise. This is a normal and expected behavior of any router with queuing and shaping.
The latency when approaching NDR and the usage of differentiated classes of traffic is further explored in the WAN aggregation topology test, where same shaper configurations are configured on all 205 subinterfaces, along with all the other services.
WAN Aggregation Test Results and Analysis
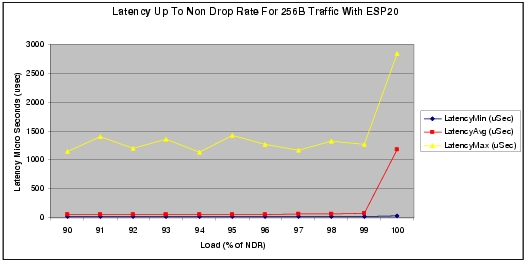
The following table profiles the latency for two packet sizes at data points approaching NDR. The 256B and 1518B sizes were chosen as both can forward up to 100% line rate and together they represent a smaller and larger sized packet profile. It must be noted here that the 64B packet could forward at a similar rate and at a similar average latency to that detailed in table 10 previously. All traffic being sent is default class or routine traffic.
Table 11. ASR1000-ESP20 WAN Aggregation Testing-Tracking Latency Up To NDR with Services (Shaping QoS)
Frame Size
(bytes)
Load (%)
Tx Frame Rate (fps)
TxFrames
Rx Frames
Loss (%)
Latency Min (uSec)
Latency Avg (uSec)
Latency Max (uSec)
256
90
8138926
2440244180
2440244180
0
24.49
50.248
1151.8
256
91
8242754
2469908995
2469908995
0
24.45
52.204
1402.46
256
92
8333333
2500008355
2500008355
0
24.33
51.946
1205.01
256
93
8381762
2517370200
2517370200
0
24.54
53.42
1357.82
256
94
8485690
2544074130
2544074130
0
24.54
55.309
1142.58
256
95
8590314
2575015980
2575015980
0
24.63
57.418
1431.35
256
96
8695652
2606439830
2606439830
0
24.68
60.018
1267.87
256
97
8740396
2628470785
2628470785
0
24.51
62.953
1167.44
256
98
8845515
2651953030
2651953030
0
24.59
66.447
1322.03
256
99
8951366
2684403160
2684403160
0
24.96
73.196
1273.95
256
100
9057971
2717400515
2717400515
0
33.54
1179.081
2846.29
1518
90
1597567
479270100
479270100
0
29.53
99.23
481.87
1518
91
1605678
481703400
481703400
0
29.56
100.87
481.34
1518
92
1599576
479872800
479872800
0
29.67
101.39
483.85
1518
93
1623496
487048800
487048800
0
29.74
103.56
485.34
1518
94
1610984
483295200
483295200
0
29.73
103.98
491.98
1518
95
1599374
479812200
479812200
0
29.71
104.34
488.43
1518
96
1623465
487039500
487039500
0
29.74
106.76
490.22
1518
97
1613427
484028100
484028100
0
29.73
105.44
491.23
1518
98
1591964
477497848
477497848
0
29.74
106.277
497.11
1518
99
1608198
482387054
482387054
0
29.73
114.08
521.04
1518
100
1624432
487331255
487331255
0
30.06
132.71
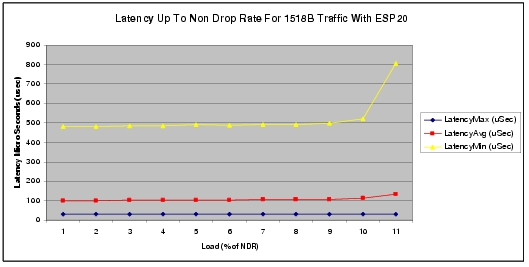
806.7
The table above clearly shows that the latency remains low up to 99% of NDR, which in this case is the line rate bi-directional 10Gbps traffic. (Note: Even though there is a shaper and queuing operation configured it has no impact on the forwarding latency up to the point where it actually is in effect- 100% of load) It is interesting to note that even at 99% of line rate the latency for both packet sizes is in the order of 50 to 100usecs. At or very close to NDR there is some queuing in effect with a shaper rate configured actively enforcing the burst rate and queuing accordingly. What is important to realize is that up until the point that the shaper is actually queuing traffic the latency remains low and deterministic, as illustrated in the charts below and table above, it is only at NDR that the shaper will begin queuing and hence the latency will increase ~ 200usec.
In the scenario where the traffic is approaching the NDR, or is in fact congested, then It is the goal of any routing platform to buffer non-priority traffic and maintain the throughput rate rather than immediately drop the traffic. Specifically with the Cisco ASR 1000 an additional millisecond, or N x 100 microseconds of latency is both tolerated and expected for the default traffic class. If the rate remains above the configured rate then the traffic will eventually be tail dropped when the configured queue is full for the class.
If a certain class/type of traffic is particularly latency/jitter sensitive and it must never incur any additional delay even when the system or link is approaching NDR or congested, then one must employ different classes of traffic where one traffic class is prioritized over another. In the case of the AR1000, there is support for two priority queues that could be used in this instance.
For this priority traffic the paradigm is obviously different, in this case latency remains consistently low and in this case the buffers are deliberately set shallower. The ultimate goal for priority, or low latency queuing (LLQ) traffic is just that, to keep latency low and in most cases the traffic profile is policed.
The test scenario above, where all traffic being sent is of the same class is not a test of QoS as such, to test QoS operation more completely one must have more that one traffic class configured then congest the interface and prioritize accordingly.
It must be noted that the Cisco ASR 1000 has a systemic notion of high and low priority traffic even within QFP and outside the queuing chipset, therefore low latency traffic is always guaranteed to be serviced first throughout the platform. In these test profiles, but outside of the RFC2544 testing, priority traffic was sent concurrently to help ensure LLQ operation. In all cases the priority traffic incurred latency in the order of 30 ~ 50usec, while default traffic was either buffered or tail dropped.
Conclusion
The overall goal of this whitepaper was to explain the Cisco ASR 1000 latency in response to different configuration and load conditions. In summary, the Cisco ASR 1000 has extremely good latency while running with basic routing functions as well as with multiple services turned on. It was also demonstrated that like any router with shaping turned latency will increase as you get to closer to the NDR. In these scenarios latency will be higher due to the need for the router to buffer and shape the packets while sustaining a 100% traffic load.