In managing today's complex, multiservice networks, introducing new services while ensuring the quality of existing services requires the ability to rapidly identify potential performance and reliability issues.
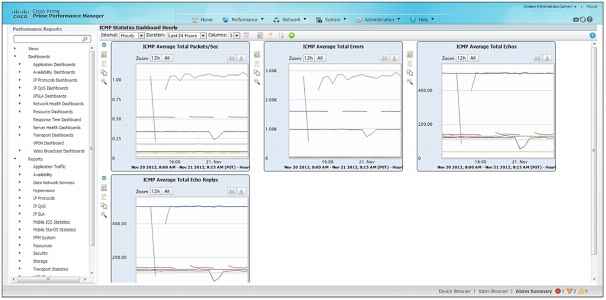
Cisco Prime™ Performance Manager is a performance management solution that provides immediate, actionable information to help service providers deliver carrier-class voice, video, mobile, cloud, and managed services. It is a highly scalable solution that gathers detailed performance statistics for Cisco® and multivendor network devices deployed across the entire network - from subscriber access all the way to the data center. (Refer to Figure 1.)
Figure 1. Cisco Prime Performance Manager - Statistics Dashboard Example
Cisco Prime Performance Manager is offered as a standalone product or as an integrated component of the Cisco Prime Carrier Management suite, a comprehensive network management solution that drastically simplifies the design, provisioning, and management of carrier-grade networks.
When combined with Cisco Prime Network, Cisco Prime Performance Manager provides operators granular visibility into network and service topologies along with related performance metrics. This provides a powerful solution that provides both postevent fault management and information to proactively avoid future disruptions. Cisco Prime Performance Manager also seamlessly integrates with Cisco Prime Central to provide centralized performance management and service assurance for the entire network.
Benefits
Easy to deploy: Simple and easy installation on single or multiple servers with an embedded database minimizes deployment time.
Easy to use: Intuitive web-based interface provides fast access to performance reports with flexible drill-down options to find more detail.
Easy to extend: Facilitates the dynamic loading of new reports, extensions to existing reports, or the addition of new devices, including non-Cisco equipment, to the network through field customization.
Fast, actionable information: Easy-to-use autodiscovery or GUI-driven integration with Cisco Prime Central and Cisco Prime Network helps ensure fast deployment and centralized access to essential network information. Cisco Prime Performance Manager also provides instant visibility into performance issues through user-defined threshold-crossing alerts (TCAs).
Features
Carrier class scale without the cost: Capable of managing 100,000 devices and approximately 9.7 million interfaces. Cisco Prime Performance Manager is designed for low startup and administrative costs with support for Cisco Unified Computing System™ (Cisco UCS®), Linux, VMware, and an embedded database that eliminates the need for third-party license and maintenance costs. Distributed architecture provides reliability, deployment flexibility, and horizontal scaling to grow with the network.
Flexible user-defined views: Better meet customer needs by quickly building and providing domain-specific views.
Prepackaged reports: Generate more than 4500 prepackaged reports on a wide range of network services, technologies, and devices. Gain more visibility into the network and service performance characteristics on devices. Reports are automatically generated, without the need for complex customization or configuration, reducing the total cost of ownership. (See Figure 1.)
Data collection and processing: Standards-based data collection can be easily applied to any Simple Network Management Protocol (SNMP)-enabled device. Generate 1 minute, 5 minute, 15 minute, hourly, weekly and monthly summarized reports, available in an easy-to-use web interface and as a comma-separated value (CSV) data file that can be exported for integration with third-party operations support systems (OSSs).
Multitechnology support: With extensive support for a wide variety of network services, technologies, and devices, Cisco Prime Performance Manager facilitates proactive service assurance and detection of network congestion.
Table 1 provides details on the features and benefits of Cisco Prime Performance Manager.
Table 1. Cisco Prime Performance Manager Features and Benefits
Feature
Description
Benefit
Architecture
Autodiscovery
Supports discovery of devices based on given IP address range, seed device, or subnets.
Minimizes the rollout period of the application by using autodiscovery and device-to-unit autoassignment.
Carrier class scale
Supports up to 100,000 devices with close to 9.7 million interfaces and 100 UI clients.
Supports distributed installation for horizontal scaling.
Minimizes the need to have multiple installations and reduces the cost of deployment and management complexity.
Offers investment protection and allows growing management applications in line with work and traffic growth.
High Availability (HA)
Support for both local and geographical HA on gateway and units.
Supports failover for units on a 1:1 or N:1 basis, where N = any number of primary units.
High Availability on gateway with clustering.
Helps enable continuous business operations through comprehensive support for failover.
Redundant units provide the capability for continuous operations with no stoppage.
IPv6 support
Performs device monitoring on an IPv6 network.
Linux with VMware, Cisco Unified Computing System, embedded database
Provides best-in-class technology choices and lower-cost platforms.
Lowers total cost of ownership by increasing deployment flexibility and supporting virtualized environments.
Report/View Customization
Extensions and report customizations
Ability to load new MIBs.
Ability to customize existing reports and add new reports.
Dynamic loading of new reports without the need for system restart.
Ability to customize report display and CSV export options.
Helps enable the rollout of new services or the addition of new devices to the network through field customization.
Customizable views
User-defined views, allowing placement of graphs, tables, and reports in predefined templates.
Granular control of type of data to display on graphs and tables.
Ability to merge one or more graphs.
View of multiple time periods for the same key performance indicator (KPI).
User-defined views.
Allows operators to focus on specific areas of the network as needed.
Helps meet customer requirements by offering views that are specific to their domains.
User Interface
Web user interface
Integrated user interface that supports administrative and report viewing functions with online help included.
Eliminates the need to install client applications on multiple client machines and the need to manage client upgrades.
Easy-to-use interface with instant access to online documentation, training videos on demand (VoDs), and software download links maximize productivity.
Report viewing user interface
Provides highly flexible report viewing options:
• CSV, table, graph-based views.
• Network-level summary views for each report.
• Very flexible drill-down options from device to corresponding dashboard views, interface views; reports into different time granularity, and so on.
• View of predefined reports or generation of custom reports.
• Star graphs per device.
Provides visibility to network and traffic behavior at various granularities leading to actionable results toward network optimization and service assurance.
Administrative user interface
Provides a centralized administrative UI for the following functions:
• Management of gateway and units.
• Assignment of devices to units.
• Autodiscovery administration.
• Flexible policies for autoassignment of device to unit assignment such as IP address range, subnet, and so on.
• User management.
• Device administrative operations.
• Centralized alarm viewer and context-based alarm viewers.
• Report administrative options.
• Visibility into various logs.
• Default summarized views for aggregate views of the system.
Reduces cost of operations through consolidated administration console and easy-to-use controls.
System Administration
Grouping and aggregate reporting
Provides logical grouping of interfaces, devices, and other KPIs.
Ability to create groups with Group editor.
Predefined XML aggregation definitions for commonly requested reports (such as Interface, VPN).
Allows operators to view consolidated performance reports pertaining to a KPI category.
Simplifies operations by automatically providing commonly used reports.
Custom Report Builder
Web Report Editor provides a GUI interface that facilitates creating the new XML version/format of any custom web reports. Rather than writing XML code, the user can use the GUI to compose the XML document and display a preview as the document is composed. The user steps through the wizard, working with options that are context specific.
Users can also view and edit existing web reports using a simple interface.
Provides more simplified operations through an interface that is much more intuitive.
Automatic generation and emailing of reports
Graphs, reports, dashboards, or customized views are automatically generated so a user can email any of these to a group at a scheduled time. They can be set to be recurring.
Simplifies operations through automation.
Network Administration
Data collection
Supports SNMPv1-, SNMPv2C-, and SNMPv3-based data collection.
Provides standards-based data collection that can be easily applied to any SNMP-enabled device.
Polling
Provides ability to configure polling parameters by individual device and device group.
Displays metrics based on real-time polling (under one minute polling interval).
Facilitates the administration of a large number of devices.
Provides more accurate insight into current state of the network.
Data processing
Supports complex calculations based on the raw data collected such as multitable joins, delta, rate, percentage, average, minimum, and maximum calculations.
Maintains aggregate summaries for 1 minute, 5 minute, 15 minute, 1 hour, and daily intervals.
Provides meaningful metrics such as availability and utilization.
NetFlow data
As network demands and speeds increase, the ability to monitor capacity, utilization, and detailed information about the traffic flowing on the network can be summarized in a format showing the conversation between two network nodes known as flow. NetFlow is a Cisco implementation, a simple and effective way to increase visibility of the traffic types and usage between two nodes.
Assists in capacity planning and optimization by collecting and identifying the top traffic utilization, capacity (bytes and packets), protocols, and services between two network nodes.
Event/Alarm Management
Threshold-crossing alerts
Thresholds are rules or policies that determine when a KPI has risen or fallen to a particular level and when an event should be forwarded to a northbound system.
Email notifications can be launched from TCAs.
Scripts can be automatically executed in response to alerts.
Thresholds on subobjects, such as logical interfaces based on type of service (ToS) or a specific class map.
Provides instant and granular visibility into performance issues to help enable rapid resolution.
Simplifies operations through predefined TCA alarm definitions for common scenarios.
Event editor
Event-related properties can be modified through the event editor.
Easy to configure custom event properties.
Data export
Predefined data export to the local file system in standards-based format (Third-Generation Partnership Project [3GPP] type A and type B).
Standards-based CSV format to reduce expensive integration costs.
Secure User Management and Administration
Role-based security
Supports role-based security to distinguish between operator and administrative actions.
Supports three predefined roles and two custom roles.
Aligns with organizational security recommendations.
Secure protocols
Support carrier class secure implementations such as secure protocols from UI to gateway; gateway to units; secure protocol to database.
Support flexible deployments with firewalls at each of these communications layers.
Aligns with organizational security recommendations.
External authentication
Supports external authentication using Lightweight Directory Access Protocol (LDAP), RADIUS, and TACACS. Supports fallback options for local authentication in the case of external authentication server failure.
Aligns to customer deployment scenarios to use external authentication systems.
OSS Integration
Cisco Prime Central and Cisco Prime Network integration
Easy-to-use GUI-driven configuration of the integration and installation of cross-launch scripts.
Cisco Prime Performance Manager synchronizes device list, credentials, and business tags from Cisco Prime Network.
Performance reports generated in Cisco Prime Performance Manager can be contextually cross-launched from Cisco Prime Network.
TCAs can be forwarded to Cisco Prime Central or Cisco Prime Network.
User management integrated with Cisco Prime Central.
Reduces the cost of systems integration by providing out-of-the-box integration. Easy-to-use single-click configuration lets operators focus on business problems rather than systems integration. Increases efficiencies in performance management and service assurance through centralization.
Provides seamless experience for viewing performance reports integrated with network and service topologies driving information for actionable results.
SNMP trap notification to OSS applications
Sends internal Cisco Prime Performance Manager-generated alarms as well as TCAs as event promulgation manager (EPM) SNMP trap notifications based on configurable rules.
Provides easy integration into fault management dashboards for proactive visibility into Cisco Prime Performance Manager-generated errors. (For example, upstream OSS alarms can be filtered by severity.)
Northbound APIs
RESTful APIs.
Simplifies integration with third-party applications.
Report Management
Mobility
Mobility reports including IOS, StarOS CDMA, StarOS EPC, and StarOS KPI. It also provides SGSN and MME reports.
Facilitates mobile service assurance for customers with CDMA and PMIP deployments. MME and SGSN reporting capabilities serve the LTE and UMTS customers.
Cable
Performance monitoring and management reports for cable access devices including Cisco router uBR10012-CMTS, Wideband EBC, RFGW.
Helps provide cable service assurance.
Data center and virtualization
Reports for key data center components including network, compute, and storage, as well as virtualization. It also provides reports for virtual services and devices.
Trending of compute, network, and storage infrastructure components, facilitating identification of performance issues in the data center.
Capacity management reports provide a way to easily identify bottlenecks in compute and network infrastructure.
Cisco Prime Performance Manager supports the key Cisco platforms listed in Table 2. In addition, Cisco Prime Performance Manager can provide reports for any SNMP-enabled device on the network. Please refer to Cisco Prime Performance Manager 1.4 compatibility information for the full list of devices that are supported.
Table 2. Examples of Cisco Platforms Supported
CRS-1
ME 3800X, ME 3600X, ME 4900
MWR 2900
ASR 9000
ASR 1000
ISR 1900, ISR 2900, ISR 3800, ISR 3900
7600
ASR 5000, ASR500
Catalyst® 4500, Catalyst 4900
Cisco UCS B Series, C Series
Cisco Nexus® Switches including Cisco Nexus 1Kv
Hypervisors - VMware, Xen, Hyper-V, KVM
Cisco Prime Performance Manager provides a rich set of prepackaged reports based on MIBs along with capabilities to extend to generate new reports and support new devices (Table 3). New MIBs can be added and new report definitions can be dynamically loaded without requiring system restart.
Table 3. Examples of Cisco Prime Performance Manager Reports
Report Category
Second-Level Category
Third-Level Category
Report Type
Standard MIB-Based or Cisco
Application Traffic
Authentication, authorization, and accounting (AAA)
In Segment Availability, Out Segment Availability, Tunnel Availability
Standard
Layer 2 VPNs
ATMs, EPL EVPLs, Frame Relays, TDMs, VPLS
Cisco
Pseudowires
Global Availability, Inbound Availability, Outbound Availability
Cisco
SNMP ping
SNMP Availability
Standard
Compute
ESXi
Data store, Disk, Network, Total CPU, Memory, Availability
Standard
Hyper-V
Host, Virtual Machine
Standard
KVM
Host, Virtual Machine
Standard
UCS Clusters
Chassis, Fabric Interconnect
Standard
Xen
Host, Virtual Machine
Standard
vCenter
Data store Clusters, Data stores, Hosts and Clusters
Standard
IP Quality of Service (Quos)
Committed Access Rate (CAR)
Traffic Bits/Sec, Traffic Percentage of Access Rate, Traffic Percentage of Interface, Traffic Distribution Percentage, Conform Continue, Conform Dropped, Conform Precedence, Conform Traffic, Conform Transmit, Current Burst, Excess Continue, Excess Dropped, Excess Precedence, Excess Traffic, Excess Transmit
Cisco
Class map
Pre- and Post-Policy Bytes, Pre- and Post-Policy Byte Rate, Pre- and Post-Policy Utilization, Pre-Policy Statistics, Post-Policy Statistics, Dropped Statistics, Police Statistics, Queuing Discards Statistics, Committed Info Rate Statistics, Peak Info Rate Statistics, Random Early Detection Statistics, Traffic Shaping Statistics
Cisco
Ethernet Flow Point
Interface CIR Utilization
Cisco
Video Monitoring
Bit Rate, Bytes, Packet Rate, Packets, Lost Packets, Media Rate Variation, Discontinuity Count, RTP Expected Packet, Jitter, Lost Distance, Lost Duration, Lost Fraction, Lost Interval
Cisco
IP Protocols
Border Gateway Protocol (BGP)
Total Messages, Total Update Percentage, Peer Messages, Peer Update Percentage, Peer Flap Statistics
Please see the Cisco Prime Performance Manager User Guide for information on how to view and utilize reports as well as manage report policies.
System Requirements
The server and web browser system requirements for Cisco Prime Performance Manager can be found in the Cisco Prime Performance Manager 1.4 Quick Start Guide.
About Cisco Prime
The Cisco Prime portfolio of IT and service provider management offerings empowers IT organizations to more effectively manage their networks and the services they deliver. Built on a service-centered foundation, Cisco Prime supports integrated lifecycle management through an intuitive workflow-oriented user experience - providing A-to-Z management for evolved programmable networks (EPNs), mobility, video, cloud, and managed services.
Service and Support
Cisco offers a wide range of services programs to accelerate customer success. These innovative services programs are delivered through a unique combination of people, processes, tools, and partners, resulting in high levels of customer satisfaction. Cisco services help you to protect your network investment, optimize network operations, and prepare the network for new applications to extend network intelligence and the power of your business. For more information about Cisco services, please visit the Cisco Services page on Cisco.com.
Ordering Information
Cisco Prime Performance Manager is available for purchase through regular Cisco sales and distribution channels worldwide. See Table 4 for part numbers. To place an order, visit the Cisco Ordering Homepage.
Table 4. Ordering Information for Cisco Prime Performance Manager 1.4
Part Number
Description
PERFMGR-1.4-K9
Cisco Prime Performance Manager 1.4 Base Application
PERFMGR-1.4-SBY-K9
Cisco Prime Performance Manager 1.4 - Standby Application (Redundancy)
PERFMGR-1.4-LAB-K9
Cisco Prime Performance Manager 1.4 Laboratory License (Not for Production Use)
PERFMGR-1-GR-A-RTM
Cisco Prime Performance Manager 1.x Group A Right to Manage
PERFMGR-1-GR-B-RTM
Cisco Prime Performance Manager 1.x Group B Right to Manage
PERFMGR-1-GR-C-RTM
Cisco Prime Performance Manager 1.x Group C Right to Manage
PERFMGR-1-GR-D-RTM
Cisco Prime Performance Manager 1.x Group D Right to Manage
PERFMGR-1-GR-E-RTM
Cisco Prime Performance Manager 1.x Group E Right to Manage
PERFMGR-1-GR-F-RTM
Cisco Prime Performance Manager 1.x Group F Right to Manage
For More Information
For more information about Cisco Prime Performance Manager, contact your local account representative or visit the Cisco Prime Performance Manager Overview at www.cisco.com/go/performance.
Download a no-cost, 60-day evaluation version of Cisco Prime Performance Manager from the Cisco Marketplace at www.cisco.com/go/nmsevals.